Bertie County, NC Map & Demographics
Bertie County Map
Bertie County Overview
$27,311
PER CAPITA INCOME
$59,840
AVG FAMILY INCOME
$41,652
AVG HOUSEHOLD INCOME
12.4%
WAGE / INCOME GAP [ % ]
87.6¢/ $1
WAGE / INCOME GAP [ $ ]
$7,123
FAMILY INCOME DEFICIT
0.54
INEQUALITY / GINI INDEX
17,818
TOTAL POPULATION
9,227
MALE POPULATION
8,591
FEMALE POPULATION
107.40
MALES / 100 FEMALES
93.11
FEMALES / 100 MALES
45.9
MEDIAN AGE
3.1
AVG FAMILY SIZE
2.3
AVG HOUSEHOLD SIZE
6,745
LABOR FORCE [ PEOPLE ]
44.4%
PERCENT IN LABOR FORCE
6.4%
UNEMPLOYMENT RATE
Bertie County Area Codes
Income in Bertie County
Income Overview in Bertie County
Per Capita Income in Bertie County is $27,311, while median incomes of families and households are $59,840 and $41,652 respectively.
| Characteristic | Number | Measure |
| Per Capita Income | 17,818 | $27,311 |
| Median Family Income | 4,264 | $59,840 |
| Mean Family Income | 4,264 | $86,264 |
| Median Household Income | 6,984 | $41,652 |
| Mean Household Income | 6,984 | $67,133 |
| Income Deficit | 4,264 | $7,123 |
| Wage / Income Gap (%) | 17,818 | 12.39% |
| Wage / Income Gap ($) | 17,818 | 87.61¢ per $1 |
| Gini / Inequality Index | 17,818 | 0.54 |
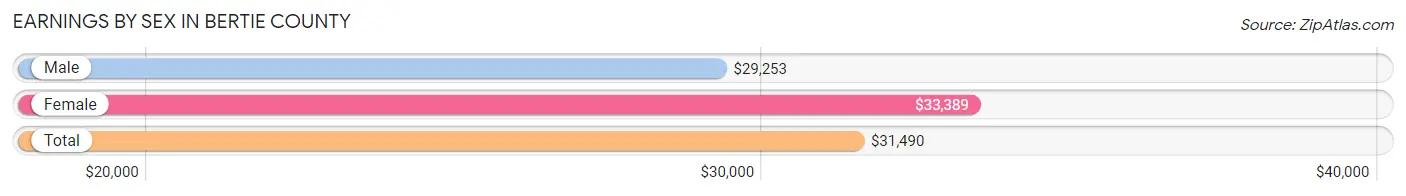
Earnings by Sex in Bertie County
Average Earnings in Bertie County are $31,490, $29,253 for men and $33,389 for women, a difference of 12.4%.
| Sex | Number | Average Earnings |
| Male | 3,686 (50.4%) | $29,253 |
| Female | 3,622 (49.6%) | $33,389 |
| Total | 7,308 (100.0%) | $31,490 |
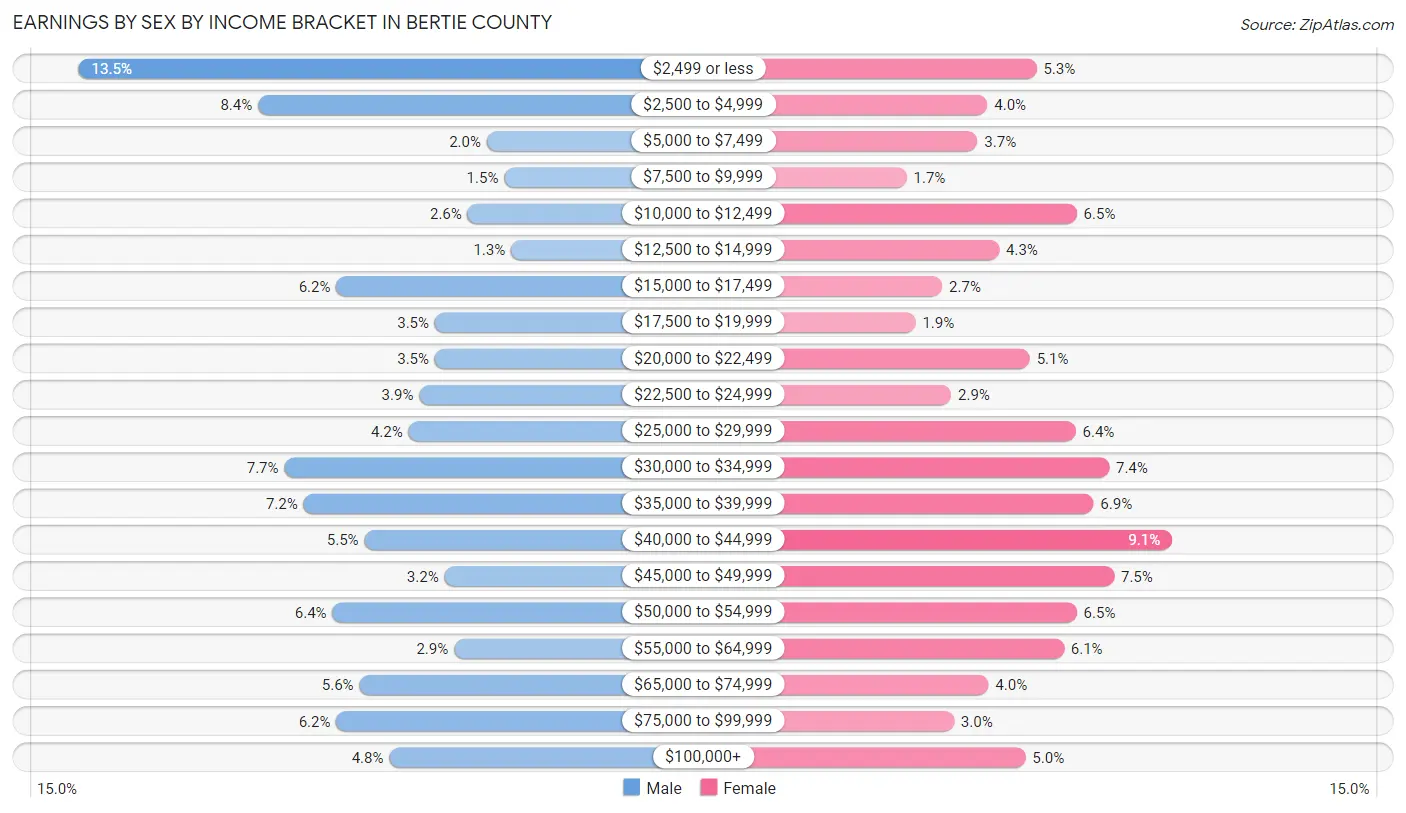
Earnings by Sex by Income Bracket in Bertie County
The most common earnings brackets in Bertie County are $2,499 or less for men (497 | 13.5%) and $40,000 to $44,999 for women (331 | 9.1%).
| Income | Male | Female |
| $2,499 or less | 497 (13.5%) | 193 (5.3%) |
| $2,500 to $4,999 | 311 (8.4%) | 143 (4.0%) |
| $5,000 to $7,499 | 74 (2.0%) | 133 (3.7%) |
| $7,500 to $9,999 | 56 (1.5%) | 61 (1.7%) |
| $10,000 to $12,499 | 94 (2.5%) | 234 (6.5%) |
| $12,500 to $14,999 | 49 (1.3%) | 155 (4.3%) |
| $15,000 to $17,499 | 230 (6.2%) | 97 (2.7%) |
| $17,500 to $19,999 | 128 (3.5%) | 70 (1.9%) |
| $20,000 to $22,499 | 128 (3.5%) | 186 (5.1%) |
| $22,500 to $24,999 | 144 (3.9%) | 106 (2.9%) |
| $25,000 to $29,999 | 155 (4.2%) | 233 (6.4%) |
| $30,000 to $34,999 | 284 (7.7%) | 267 (7.4%) |
| $35,000 to $39,999 | 264 (7.2%) | 251 (6.9%) |
| $40,000 to $44,999 | 201 (5.4%) | 331 (9.1%) |
| $45,000 to $49,999 | 118 (3.2%) | 272 (7.5%) |
| $50,000 to $54,999 | 234 (6.4%) | 234 (6.5%) |
| $55,000 to $64,999 | 108 (2.9%) | 221 (6.1%) |
| $65,000 to $74,999 | 206 (5.6%) | 144 (4.0%) |
| $75,000 to $99,999 | 230 (6.2%) | 109 (3.0%) |
| $100,000+ | 175 (4.8%) | 182 (5.0%) |
| Total | 3,686 (100.0%) | 3,622 (100.0%) |
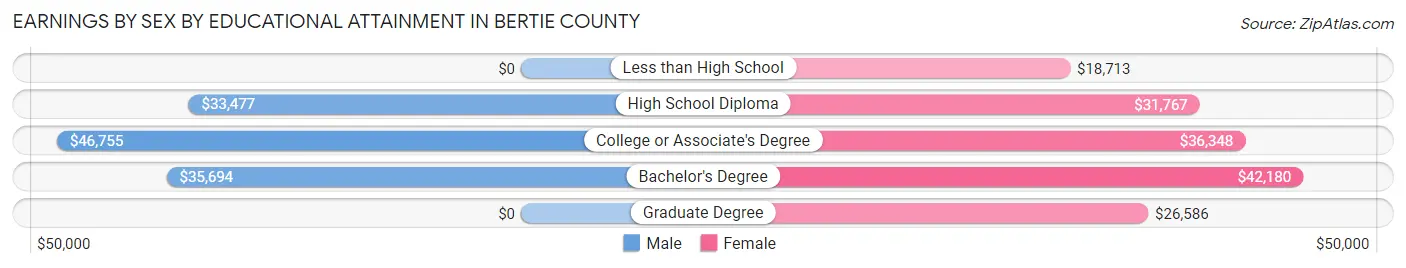
Earnings by Sex by Educational Attainment in Bertie County
Average earnings in Bertie County are $31,894 for men and $36,476 for women, a difference of 12.6%. Men with an educational attainment of college or associate's degree enjoy the highest average annual earnings of $46,755, while those with high school diploma education earn the least with $33,477. Women with an educational attainment of bachelor's degree earn the most with the average annual earnings of $42,180, while those with less than high school education have the smallest earnings of $18,713.
| Educational Attainment | Male Income | Female Income |
| Less than High School | - | - |
| High School Diploma | $33,477 | $31,767 |
| College or Associate's Degree | $46,755 | $36,348 |
| Bachelor's Degree | $35,694 | $42,180 |
| Graduate Degree | - | - |
| Total | $31,894 | $36,476 |
Family Income in Bertie County
Family Income Brackets in Bertie County
According to the Bertie County family income data, there are 917 families falling into the $50,000 to $74,999 income range, which is the most common income bracket and makes up 21.5% of all families. Conversely, the $10,000 to $14,999 income bracket is the least frequent group with only 115 families (2.7%) belonging to this category.
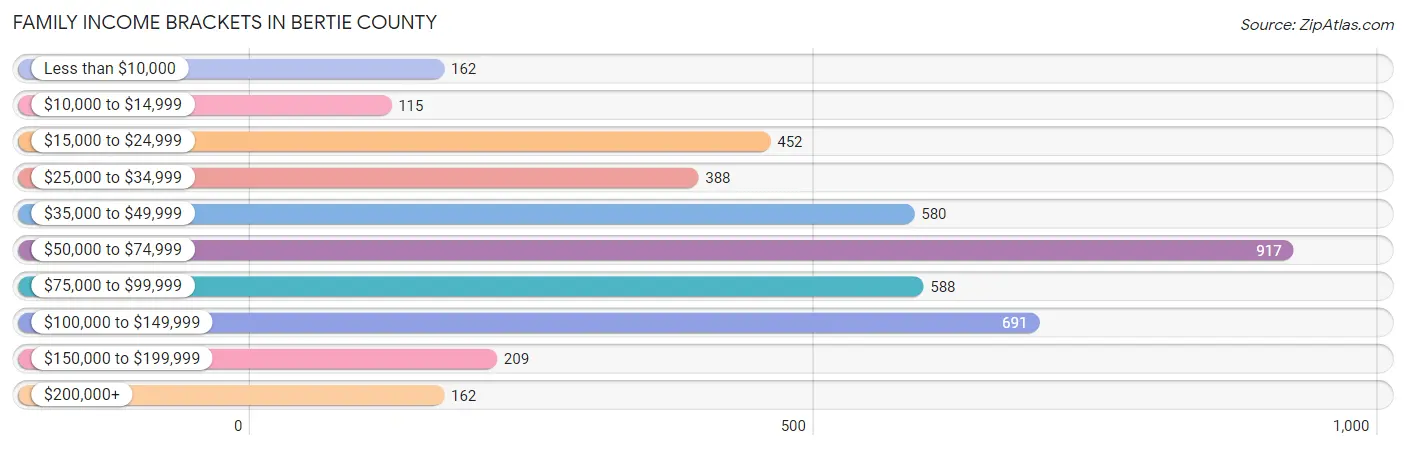
| Income Bracket | # Families | % Families |
| Less than $10,000 | 162 | 3.8% |
| $10,000 to $14,999 | 115 | 2.7% |
| $15,000 to $24,999 | 452 | 10.6% |
| $25,000 to $34,999 | 388 | 9.1% |
| $35,000 to $49,999 | 580 | 13.6% |
| $50,000 to $74,999 | 917 | 21.5% |
| $75,000 to $99,999 | 588 | 13.8% |
| $100,000 to $149,999 | 691 | 16.2% |
| $150,000 to $199,999 | 209 | 4.9% |
| $200,000+ | 162 | 3.8% |
Family Income by Famaliy Size in Bertie County
5-person families (123 | 2.9%) account for the highest median family income in Bertie County with $107,852 per family, while 2-person families (2,150 | 50.4%) have the highest median income of $27,066 per family member.
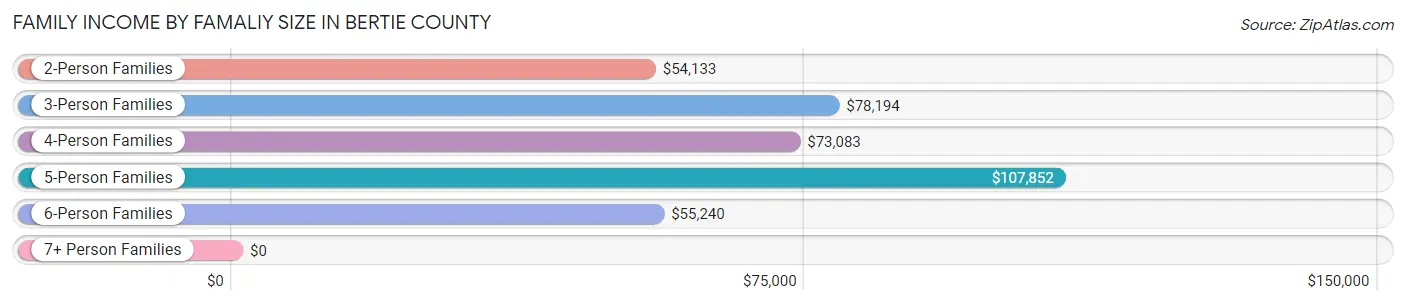
| Income Bracket | # Families | Median Income |
| 2-Person Families | 2,150 (50.4%) | $54,133 |
| 3-Person Families | 1,117 (26.2%) | $78,194 |
| 4-Person Families | 711 (16.7%) | $73,083 |
| 5-Person Families | 123 (2.9%) | $107,852 |
| 6-Person Families | 154 (3.6%) | $55,240 |
| 7+ Person Families | 9 (0.2%) | $0 |
| Total | 4,264 (100.0%) | $59,840 |
Family Income by Number of Earners in Bertie County
The median family income in Bertie County is $59,840, with families comprising 3+ earners (374) having the highest median family income of $112,738, while families with no earners (1,188) have the lowest median family income of $33,786, accounting for 8.8% and 27.9% of families, respectively.
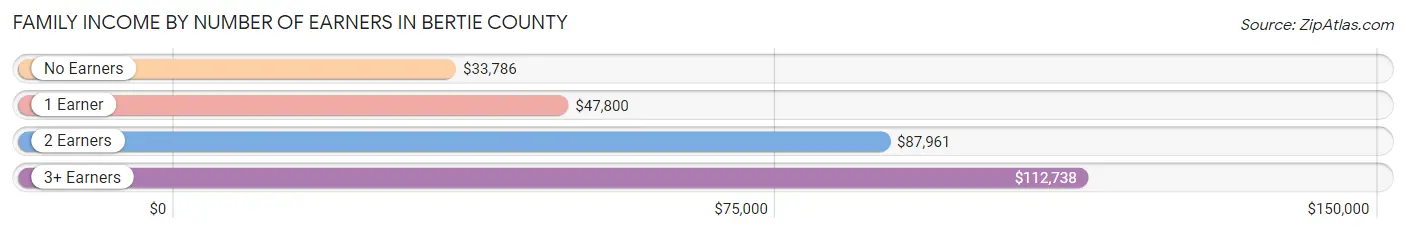
| Number of Earners | # Families | Median Income |
| No Earners | 1,188 (27.9%) | $33,786 |
| 1 Earner | 1,360 (31.9%) | $47,800 |
| 2 Earners | 1,342 (31.5%) | $87,961 |
| 3+ Earners | 374 (8.8%) | $112,738 |
| Total | 4,264 (100.0%) | $59,840 |
Household Income in Bertie County
Household Income Brackets in Bertie County
With 1,180 households falling in the category, the $15,000 to $24,999 income range is the most frequent in Bertie County, accounting for 16.9% of all households. In contrast, only 223 households (3.2%) fall into the $150,000 to $199,999 income bracket, making it the least populous group.
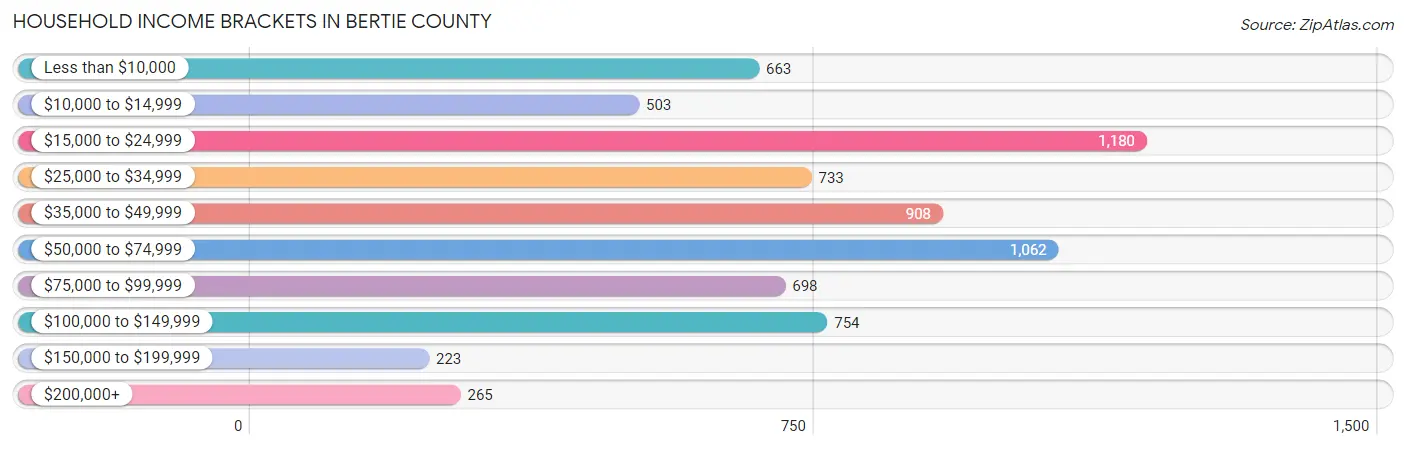
| Income Bracket | # Households | % Households |
| Less than $10,000 | 663 | 9.5% |
| $10,000 to $14,999 | 503 | 7.2% |
| $15,000 to $24,999 | 1,180 | 16.9% |
| $25,000 to $34,999 | 733 | 10.5% |
| $35,000 to $49,999 | 908 | 13.0% |
| $50,000 to $74,999 | 1,062 | 15.2% |
| $75,000 to $99,999 | 698 | 10.0% |
| $100,000 to $149,999 | 754 | 10.8% |
| $150,000 to $199,999 | 223 | 3.2% |
| $200,000+ | 265 | 3.8% |
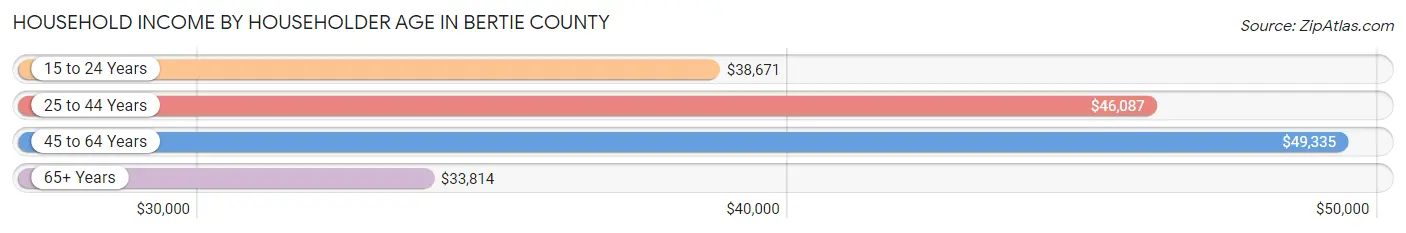
Household Income by Householder Age in Bertie County
The median household income in Bertie County is $41,652, with the highest median household income of $49,335 found in the 45 to 64 years age bracket for the primary householder. A total of 2,619 households (37.5%) fall into this category. Meanwhile, the 65+ years age bracket for the primary householder has the lowest median household income of $33,814, with 2,888 households (41.3%) in this group.
| Income Bracket | # Households | Median Income |
| 15 to 24 Years | 97 (1.4%) | $38,671 |
| 25 to 44 Years | 1,380 (19.8%) | $46,087 |
| 45 to 64 Years | 2,619 (37.5%) | $49,335 |
| 65+ Years | 2,888 (41.3%) | $33,814 |
| Total | 6,984 (100.0%) | $41,652 |
Poverty in Bertie County
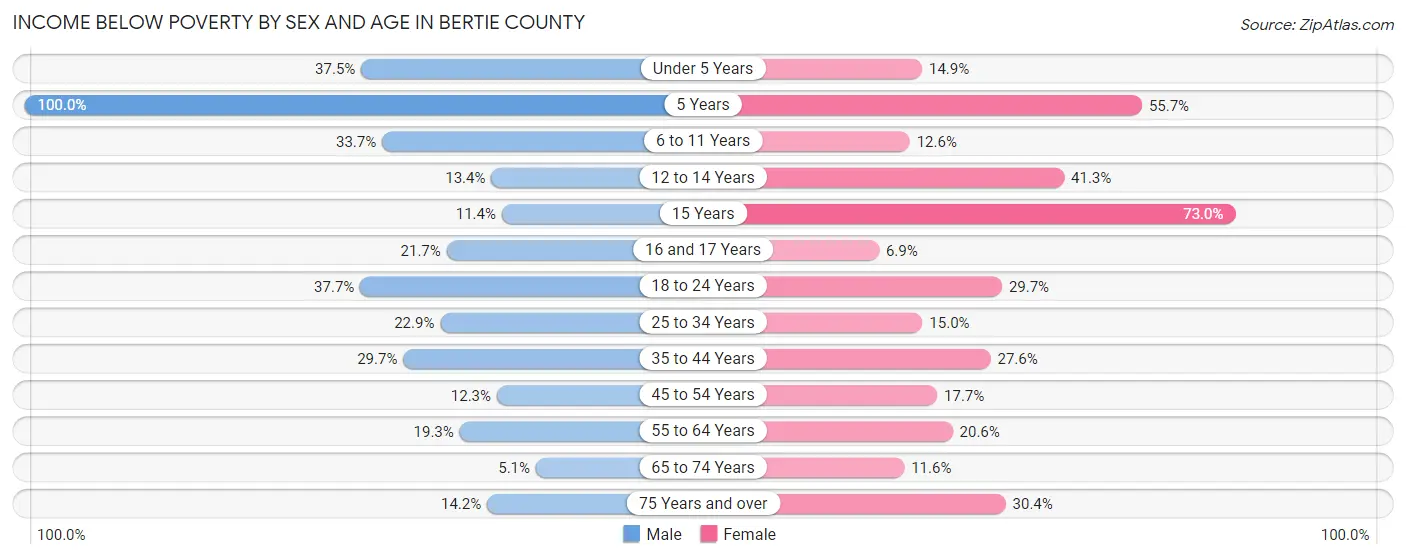
Income Below Poverty by Sex and Age in Bertie County
With 21.3% poverty level for males and 21.5% for females among the residents of Bertie County, 5 year old males and 15 year old females are the most vulnerable to poverty, with 56 males (100.0%) and 65 females (73.0%) in their respective age groups living below the poverty level.
| Age Bracket | Male | Female |
| Under 5 Years | 143 (37.5%) | 56 (14.9%) |
| 5 Years | 56 (100.0%) | 39 (55.7%) |
| 6 to 11 Years | 175 (33.7%) | 56 (12.6%) |
| 12 to 14 Years | 42 (13.4%) | 111 (41.3%) |
| 15 Years | 8 (11.4%) | 65 (73.0%) |
| 16 and 17 Years | 57 (21.7%) | 10 (6.9%) |
| 18 to 24 Years | 252 (37.7%) | 173 (29.7%) |
| 25 to 34 Years | 244 (22.9%) | 120 (15.0%) |
| 35 to 44 Years | 219 (29.7%) | 251 (27.6%) |
| 45 to 54 Years | 114 (12.3%) | 178 (17.7%) |
| 55 to 64 Years | 223 (19.3%) | 294 (20.6%) |
| 65 to 74 Years | 54 (5.1%) | 152 (11.6%) |
| 75 Years and over | 93 (14.2%) | 315 (30.4%) |
| Total | 1,680 (21.3%) | 1,820 (21.5%) |
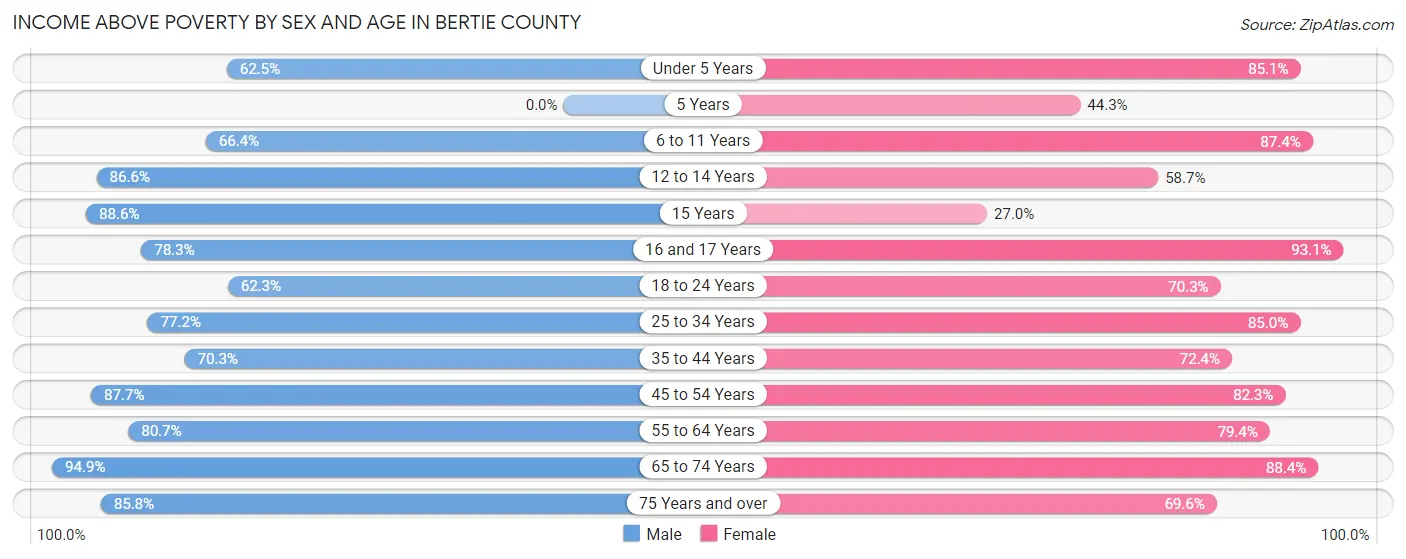
Income Above Poverty by Sex and Age in Bertie County
According to the poverty statistics in Bertie County, males aged 65 to 74 years and females aged 16 and 17 years are the age groups that are most secure financially, with 94.9% of males and 93.1% of females in these age groups living above the poverty line.
| Age Bracket | Male | Female |
| Under 5 Years | 238 (62.5%) | 320 (85.1%) |
| 5 Years | 0 (0.0%) | 31 (44.3%) |
| 6 to 11 Years | 345 (66.3%) | 388 (87.4%) |
| 12 to 14 Years | 272 (86.6%) | 158 (58.7%) |
| 15 Years | 62 (88.6%) | 24 (27.0%) |
| 16 and 17 Years | 206 (78.3%) | 135 (93.1%) |
| 18 to 24 Years | 416 (62.3%) | 409 (70.3%) |
| 25 to 34 Years | 824 (77.1%) | 682 (85.0%) |
| 35 to 44 Years | 518 (70.3%) | 658 (72.4%) |
| 45 to 54 Years | 810 (87.7%) | 828 (82.3%) |
| 55 to 64 Years | 935 (80.7%) | 1,135 (79.4%) |
| 65 to 74 Years | 1,005 (94.9%) | 1,160 (88.4%) |
| 75 Years and over | 564 (85.8%) | 721 (69.6%) |
| Total | 6,195 (78.7%) | 6,649 (78.5%) |
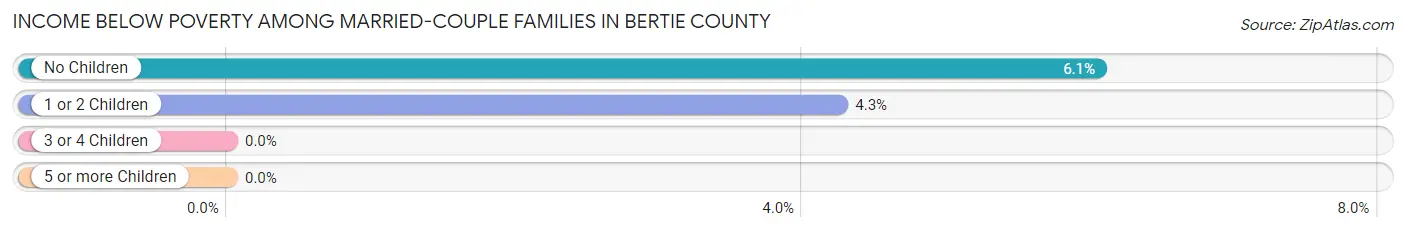
Income Below Poverty Among Married-Couple Families in Bertie County
The poverty statistics for married-couple families in Bertie County show that 5.5% or 156 of the total 2,835 families live below the poverty line. Families with no children have the highest poverty rate of 6.0%, comprising of 123 families. On the other hand, families with 3 or 4 children have the lowest poverty rate of 0.0%, which includes 0 families.
| Children | Above Poverty | Below Poverty |
| No Children | 1,910 (94.0%) | 123 (6.0%) |
| 1 or 2 Children | 744 (95.8%) | 33 (4.3%) |
| 3 or 4 Children | 25 (100.0%) | 0 (0.0%) |
| 5 or more Children | 0 (0.0%) | 0 (0.0%) |
| Total | 2,679 (94.5%) | 156 (5.5%) |
Income Below Poverty Among Single-Parent Households in Bertie County
According to the poverty data in Bertie County, 41.6% or 111 single-father households and 33.5% or 389 single-mother households are living below the poverty line. Among single-father households, those with 3 or 4 children have the highest poverty rate, with 72 households (100.0%) experiencing poverty. Likewise, among single-mother households, those with 3 or 4 children have the highest poverty rate, with 34 households (52.3%) falling below the poverty line.
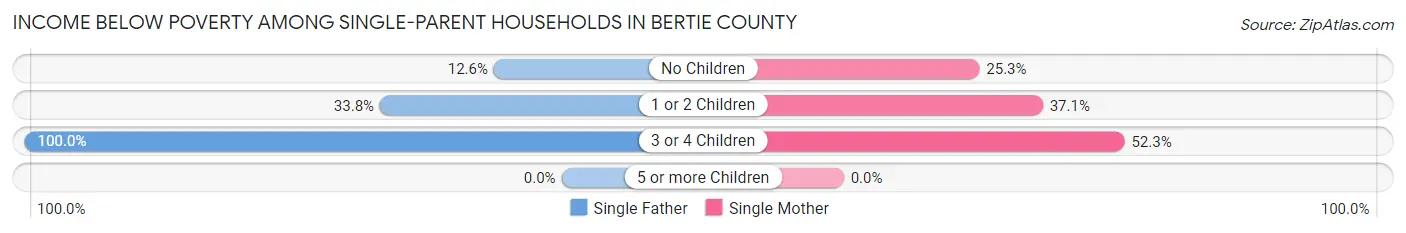
| Children | Single Father | Single Mother |
| No Children | 16 (12.6%) | 111 (25.3%) |
| 1 or 2 Children | 23 (33.8%) | 244 (37.1%) |
| 3 or 4 Children | 72 (100.0%) | 34 (52.3%) |
| 5 or more Children | 0 (0.0%) | 0 (0.0%) |
| Total | 111 (41.6%) | 389 (33.5%) |
Income Below Poverty Among Married-Couple vs Single-Parent Households in Bertie County
The poverty data for Bertie County shows that 156 of the married-couple family households (5.5%) and 500 of the single-parent households (35.0%) are living below the poverty level. Within the married-couple family households, those with no children have the highest poverty rate, with 123 households (6.0%) falling below the poverty line. Among the single-parent households, those with 3 or 4 children have the highest poverty rate, with 106 household (77.4%) living below poverty.
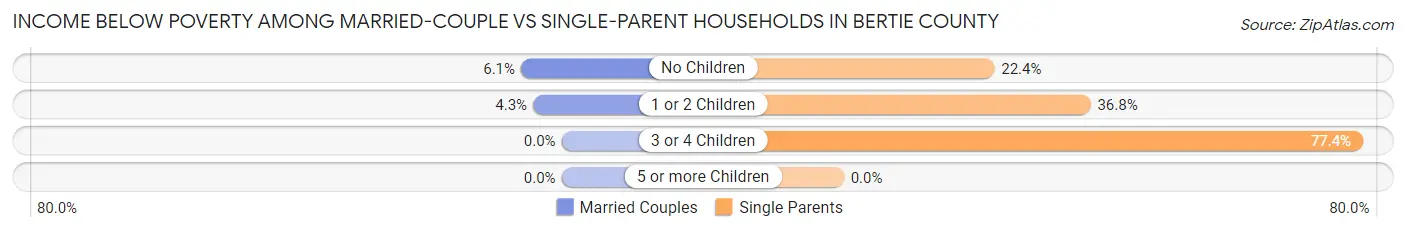
| Children | Married-Couple Families | Single-Parent Households |
| No Children | 123 (6.0%) | 127 (22.4%) |
| 1 or 2 Children | 33 (4.3%) | 267 (36.8%) |
| 3 or 4 Children | 0 (0.0%) | 106 (77.4%) |
| 5 or more Children | 0 (0.0%) | 0 (0.0%) |
| Total | 156 (5.5%) | 500 (35.0%) |
Race in Bertie County
The most populous races in Bertie County are Black / African American (10,987 | 61.7%), White / Caucasian (6,188 | 34.7%), and Two or more Races (403 | 2.3%).
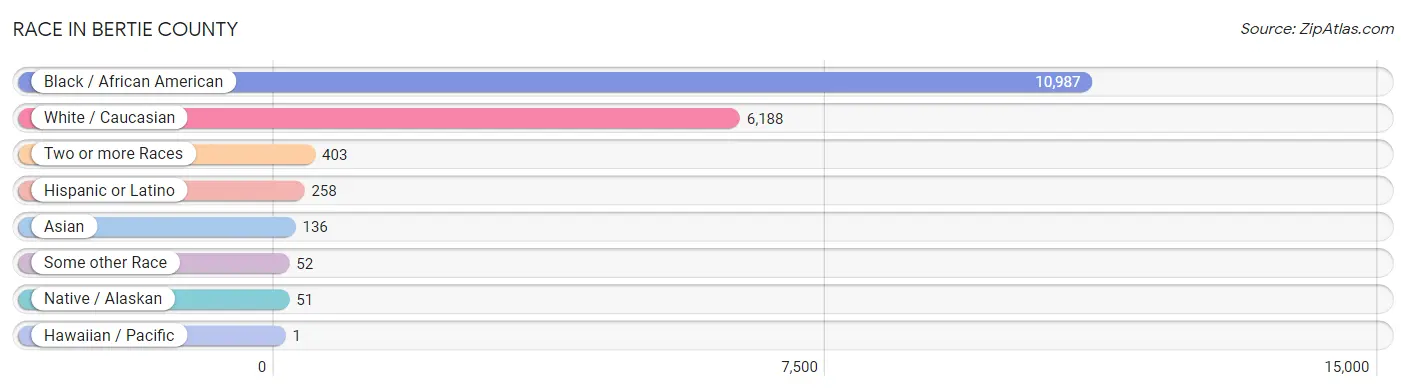
| Race | # Population | % Population |
| Asian | 136 | 0.8% |
| Black / African American | 10,987 | 61.7% |
| Hawaiian / Pacific | 1 | 0.0% |
| Hispanic or Latino | 258 | 1.5% |
| Native / Alaskan | 51 | 0.3% |
| White / Caucasian | 6,188 | 34.7% |
| Two or more Races | 403 | 2.3% |
| Some other Race | 52 | 0.3% |
| Total | 17,818 | 100.0% |
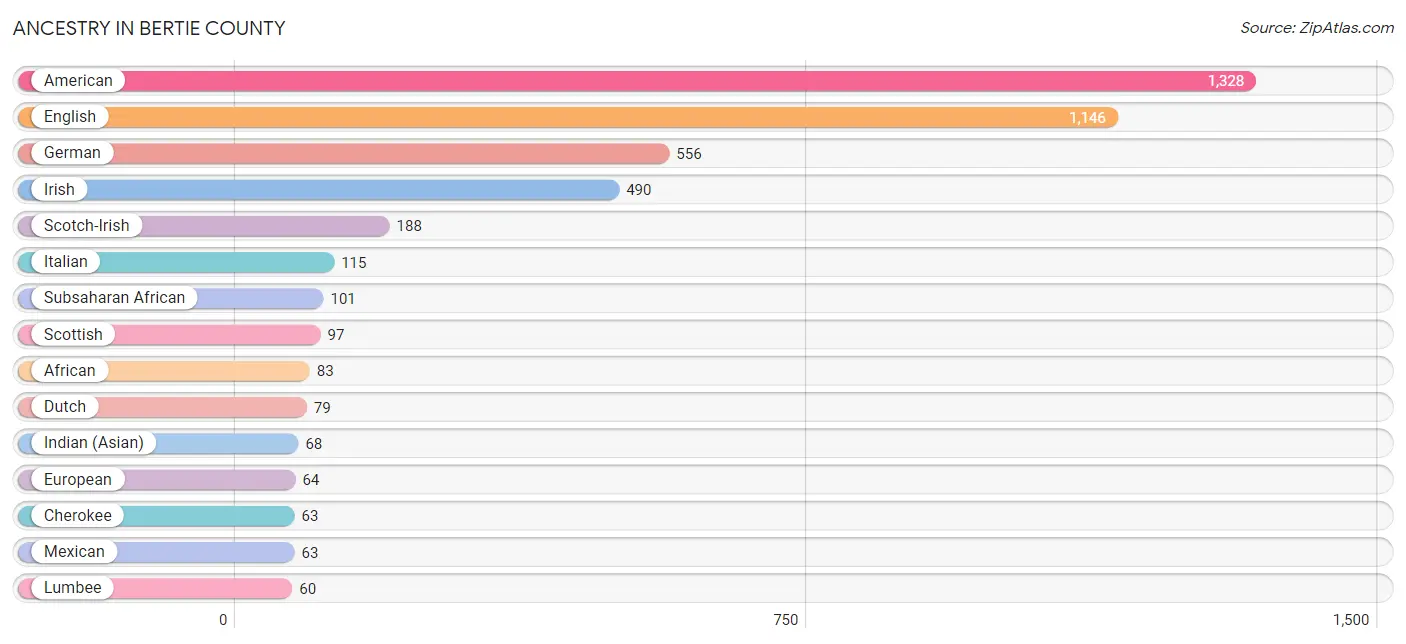
Ancestry in Bertie County
The most populous ancestries reported in Bertie County are American (1,328 | 7.4%), English (1,146 | 6.4%), German (556 | 3.1%), Irish (490 | 2.8%), and Scotch-Irish (188 | 1.1%), together accounting for 20.8% of all Bertie County residents.
| Ancestry | # Population | % Population |
| African | 83 | 0.5% |
| American | 1,328 | 7.4% |
| Arab | 10 | 0.1% |
| British | 8 | 0.0% |
| Burmese | 1 | 0.0% |
| Cajun | 9 | 0.1% |
| Canadian | 6 | 0.0% |
| Central American | 17 | 0.1% |
| Central American Indian | 8 | 0.0% |
| Cherokee | 63 | 0.4% |
| Colombian | 37 | 0.2% |
| Creek | 1 | 0.0% |
| Cuban | 56 | 0.3% |
| Dominican | 44 | 0.3% |
| Dutch | 79 | 0.4% |
| Eastern European | 4 | 0.0% |
| English | 1,146 | 6.4% |
| European | 64 | 0.4% |
| French | 43 | 0.2% |
| French Canadian | 9 | 0.1% |
| German | 556 | 3.1% |
| Haitian | 10 | 0.1% |
| Hungarian | 12 | 0.1% |
| Indian (Asian) | 68 | 0.4% |
| Iranian | 5 | 0.0% |
| Irish | 490 | 2.8% |
| Iroquois | 1 | 0.0% |
| Italian | 115 | 0.6% |
| Jamaican | 27 | 0.2% |
| Korean | 43 | 0.2% |
| Liberian | 8 | 0.0% |
| Lumbee | 60 | 0.3% |
| Mexican | 63 | 0.4% |
| Moroccan | 10 | 0.1% |
| Native Hawaiian | 1 | 0.0% |
| Nigerian | 10 | 0.1% |
| Norwegian | 7 | 0.0% |
| Panamanian | 9 | 0.1% |
| Polish | 6 | 0.0% |
| Puerto Rican | 41 | 0.2% |
| Romanian | 7 | 0.0% |
| Russian | 17 | 0.1% |
| Salvadoran | 8 | 0.0% |
| Scandinavian | 8 | 0.0% |
| Scotch-Irish | 188 | 1.1% |
| Scottish | 97 | 0.5% |
| South American | 37 | 0.2% |
| Subsaharan African | 101 | 0.6% |
| Swedish | 4 | 0.0% |
| Swiss | 5 | 0.0% |
| Thai | 36 | 0.2% |
| Welsh | 52 | 0.3% | View All 52 Rows |
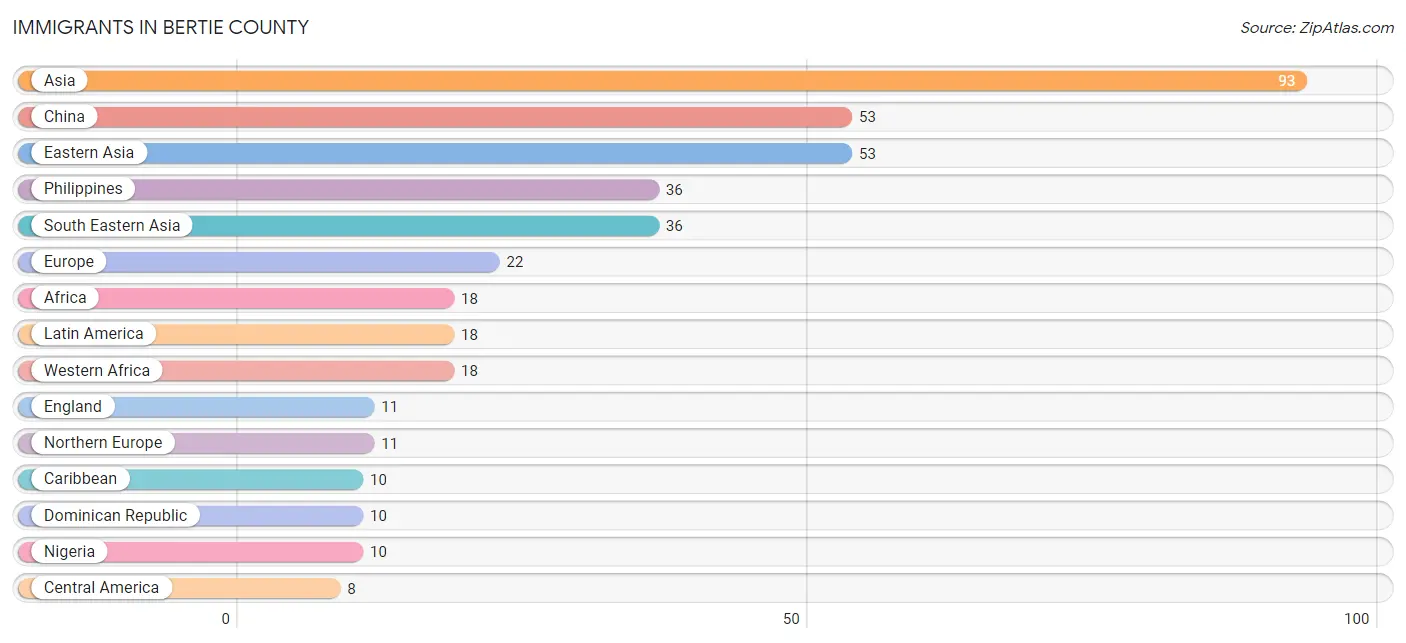
Immigrants in Bertie County
The most numerous immigrant groups reported in Bertie County came from Asia (93 | 0.5%), China (53 | 0.3%), Eastern Asia (53 | 0.3%), Philippines (36 | 0.2%), and South Eastern Asia (36 | 0.2%), together accounting for 1.5% of all Bertie County residents.
| Immigration Origin | # Population | % Population |
| Africa | 18 | 0.1% |
| Asia | 93 | 0.5% |
| Canada | 5 | 0.0% |
| Caribbean | 10 | 0.1% |
| Central America | 8 | 0.0% |
| China | 53 | 0.3% |
| Dominican Republic | 10 | 0.1% |
| Eastern Asia | 53 | 0.3% |
| El Salvador | 8 | 0.0% |
| England | 11 | 0.1% |
| Europe | 22 | 0.1% |
| India | 3 | 0.0% |
| Italy | 5 | 0.0% |
| Latin America | 18 | 0.1% |
| Liberia | 8 | 0.0% |
| Netherlands | 6 | 0.0% |
| Nigeria | 10 | 0.1% |
| Northern Europe | 11 | 0.1% |
| Philippines | 36 | 0.2% |
| South Central Asia | 3 | 0.0% |
| South Eastern Asia | 36 | 0.2% |
| Southern Europe | 5 | 0.0% |
| Turkey | 1 | 0.0% |
| Western Africa | 18 | 0.1% |
| Western Asia | 1 | 0.0% |
| Western Europe | 6 | 0.0% | View All 26 Rows |
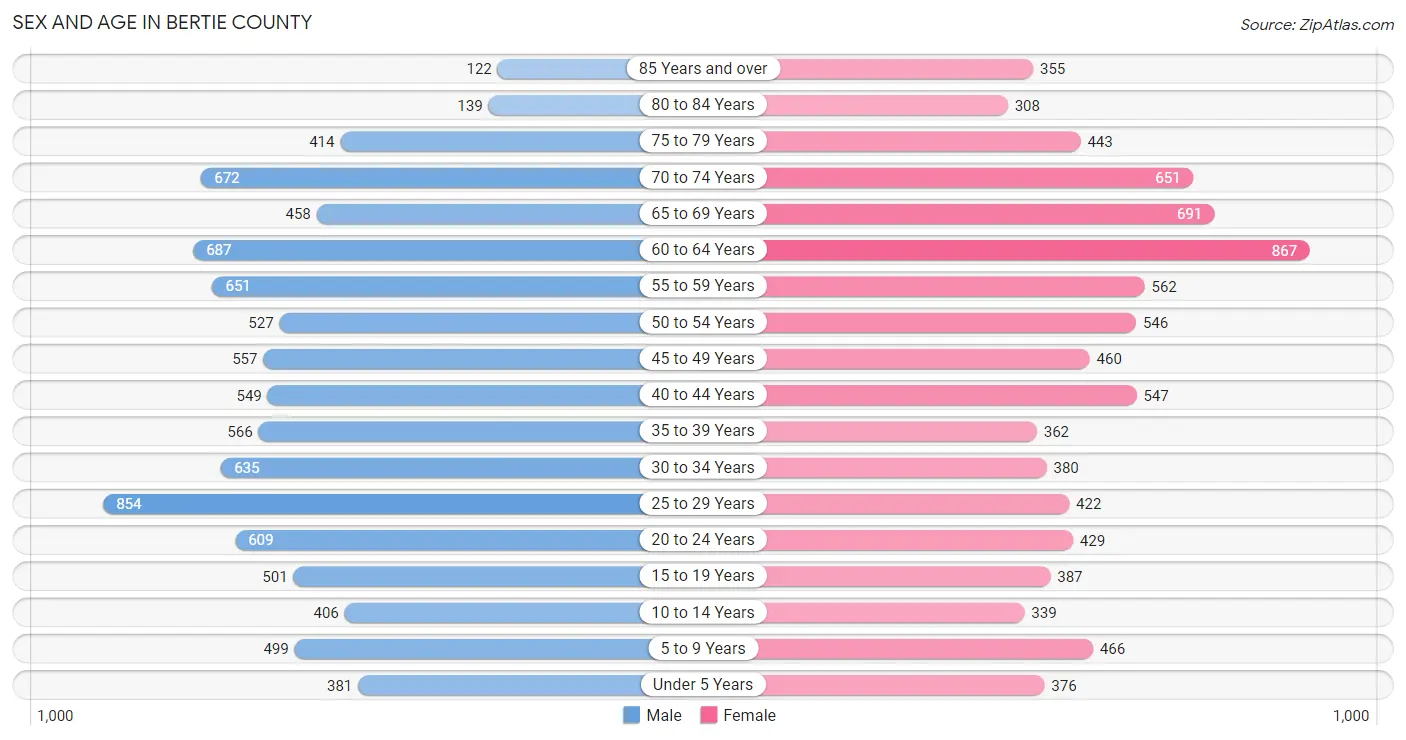
Sex and Age in Bertie County
Sex and Age in Bertie County
The most populous age groups in Bertie County are 25 to 29 Years (854 | 9.3%) for men and 60 to 64 Years (867 | 10.1%) for women.
| Age Bracket | Male | Female |
| Under 5 Years | 381 (4.1%) | 376 (4.4%) |
| 5 to 9 Years | 499 (5.4%) | 466 (5.4%) |
| 10 to 14 Years | 406 (4.4%) | 339 (4.0%) |
| 15 to 19 Years | 501 (5.4%) | 387 (4.5%) |
| 20 to 24 Years | 609 (6.6%) | 429 (5.0%) |
| 25 to 29 Years | 854 (9.3%) | 422 (4.9%) |
| 30 to 34 Years | 635 (6.9%) | 380 (4.4%) |
| 35 to 39 Years | 566 (6.1%) | 362 (4.2%) |
| 40 to 44 Years | 549 (5.9%) | 547 (6.4%) |
| 45 to 49 Years | 557 (6.0%) | 460 (5.3%) |
| 50 to 54 Years | 527 (5.7%) | 546 (6.4%) |
| 55 to 59 Years | 651 (7.1%) | 562 (6.5%) |
| 60 to 64 Years | 687 (7.4%) | 867 (10.1%) |
| 65 to 69 Years | 458 (5.0%) | 691 (8.0%) |
| 70 to 74 Years | 672 (7.3%) | 651 (7.6%) |
| 75 to 79 Years | 414 (4.5%) | 443 (5.2%) |
| 80 to 84 Years | 139 (1.5%) | 308 (3.6%) |
| 85 Years and over | 122 (1.3%) | 355 (4.1%) |
| Total | 9,227 (100.0%) | 8,591 (100.0%) |
Families and Households in Bertie County
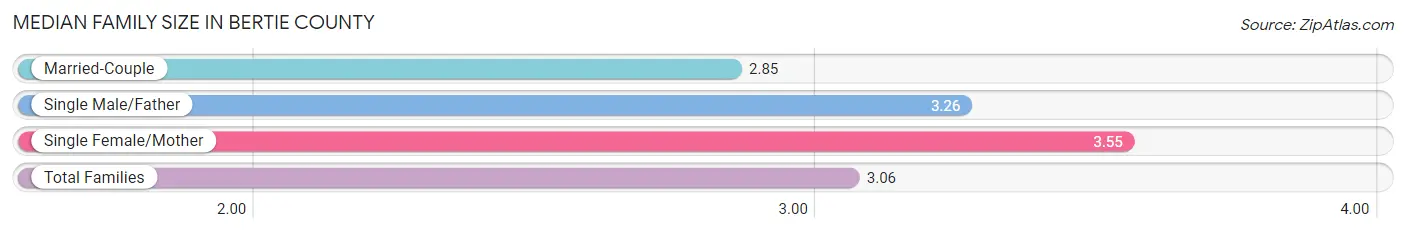
Median Family Size in Bertie County
The median family size in Bertie County is 3.06 persons per family, with single female/mother families (1,162 | 27.3%) accounting for the largest median family size of 3.55 persons per family. On the other hand, married-couple families (2,835 | 66.5%) represent the smallest median family size with 2.85 persons per family.
| Family Type | # Families | Family Size |
| Married-Couple | 2,835 (66.5%) | 2.85 |
| Single Male/Father | 267 (6.3%) | 3.26 |
| Single Female/Mother | 1,162 (27.3%) | 3.55 |
| Total Families | 4,264 (100.0%) | 3.06 |
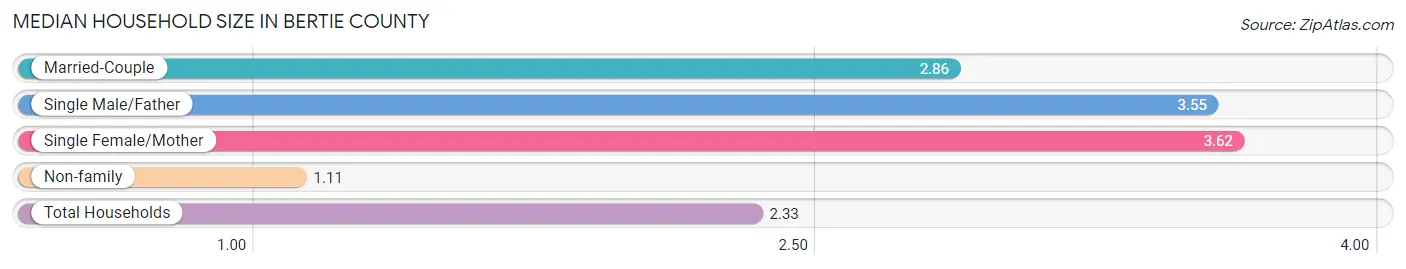
Median Household Size in Bertie County
The median household size in Bertie County is 2.33 persons per household, with single female/mother households (1,162 | 16.6%) accounting for the largest median household size of 3.62 persons per household. non-family households (2,720 | 39.0%) represent the smallest median household size with 1.11 persons per household.
| Household Type | # Households | Household Size |
| Married-Couple | 2,835 (40.6%) | 2.86 |
| Single Male/Father | 267 (3.8%) | 3.55 |
| Single Female/Mother | 1,162 (16.6%) | 3.62 |
| Non-family | 2,720 (39.0%) | 1.11 |
| Total Households | 6,984 (100.0%) | 2.33 |
Household Size by Marriage Status in Bertie County
Out of a total of 6,984 households in Bertie County, 4,264 (61.1%) are family households, while 2,720 (39.0%) are nonfamily households. The most numerous type of family households are 2-person households, comprising 2,065, and the most common type of nonfamily households are 1-person households, comprising 2,408.
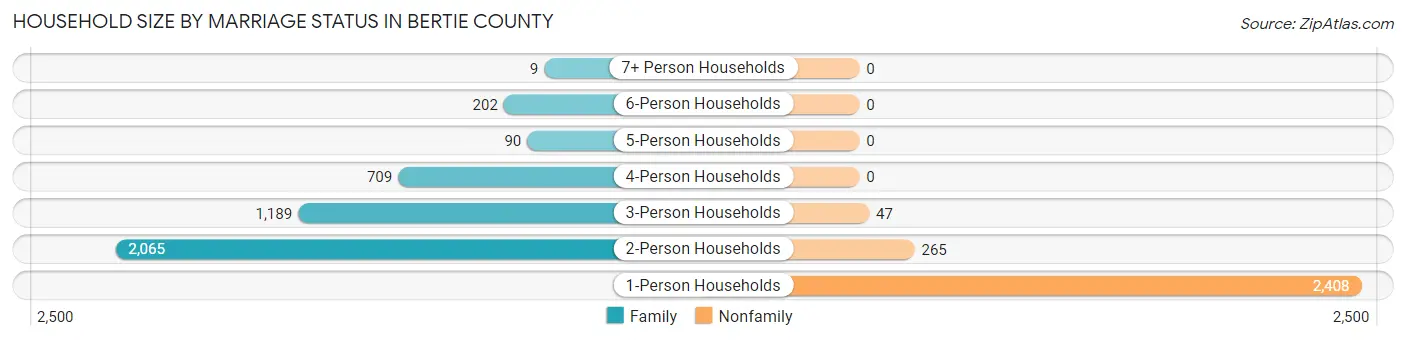
| Household Size | Family Households | Nonfamily Households |
| 1-Person Households | - | 2,408 (34.5%) |
| 2-Person Households | 2,065 (29.6%) | 265 (3.8%) |
| 3-Person Households | 1,189 (17.0%) | 47 (0.7%) |
| 4-Person Households | 709 (10.2%) | 0 (0.0%) |
| 5-Person Households | 90 (1.3%) | 0 (0.0%) |
| 6-Person Households | 202 (2.9%) | 0 (0.0%) |
| 7+ Person Households | 9 (0.1%) | 0 (0.0%) |
| Total | 4,264 (61.1%) | 2,720 (39.0%) |
Female Fertility in Bertie County
Fertility by Age in Bertie County
Average fertility rate in Bertie County is 89.0 births per 1,000 women. Women in the age bracket of 20 to 34 years have the highest fertility rate with 169.0 births per 1,000 women. Women in the age bracket of 20 to 34 years acount for 75.4% of all women with births.
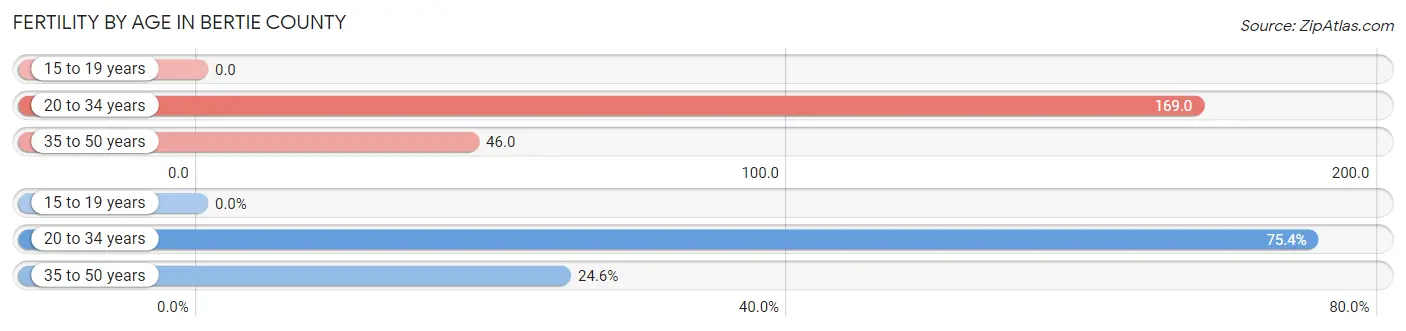
| Age Bracket | Women with Births | Births / 1,000 Women |
| 15 to 19 years | 0 (0.0%) | 0.0 |
| 20 to 34 years | 208 (75.4%) | 169.0 |
| 35 to 50 years | 68 (24.6%) | 46.0 |
| Total | 276 (100.0%) | 89.0 |
Fertility by Age by Marriage Status in Bertie County
46.4% of women with births (276) in Bertie County are married. The highest percentage of unmarried women with births falls into 35 to 50 years age bracket with 83.8% of them unmarried at the time of birth, while the lowest percentage of unmarried women with births belong to 20 to 34 years age bracket with 43.8% of them unmarried.
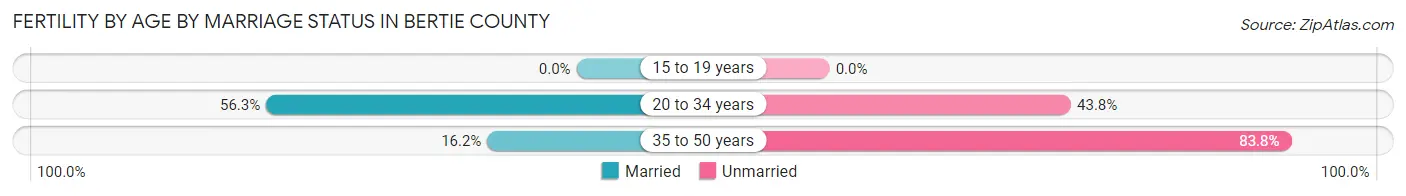
| Age Bracket | Married | Unmarried |
| 15 to 19 years | 0 (0.0%) | 0 (0.0%) |
| 20 to 34 years | 117 (56.2%) | 91 (43.8%) |
| 35 to 50 years | 11 (16.2%) | 57 (83.8%) |
| Total | 128 (46.4%) | 148 (53.6%) |
Fertility by Education in Bertie County
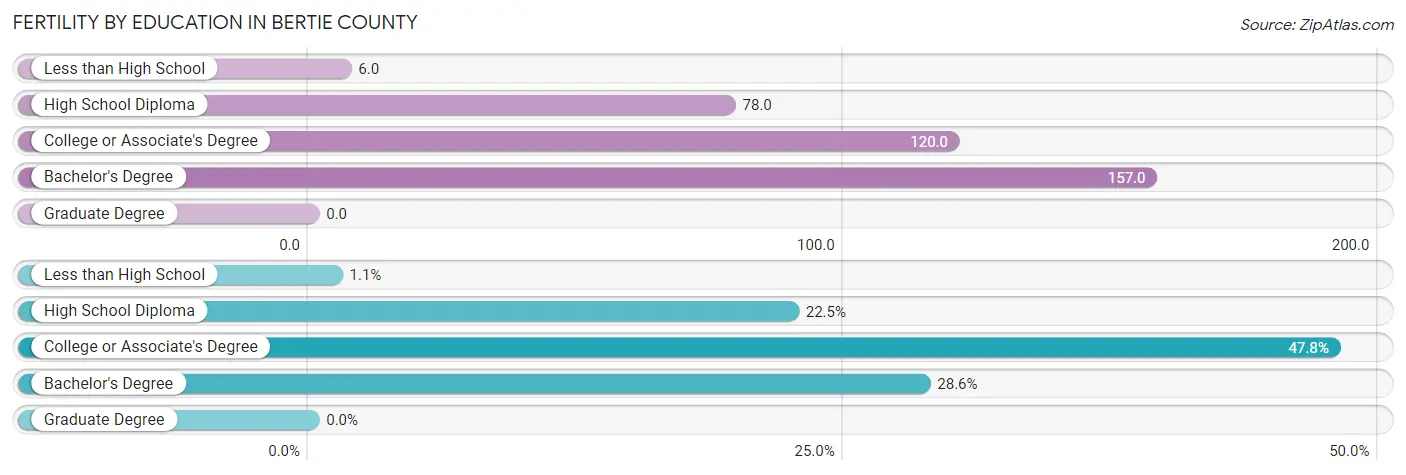
| Educational Attainment | Women with Births | Births / 1,000 Women |
| Less than High School | 3 (1.1%) | 6.0 |
| High School Diploma | 62 (22.5%) | 78.0 |
| College or Associate's Degree | 132 (47.8%) | 120.0 |
| Bachelor's Degree | 79 (28.6%) | 157.0 |
| Graduate Degree | 0 (0.0%) | 0.0 |
| Total | 276 (100.0%) | 89.0 |
Fertility by Education by Marriage Status in Bertie County
53.6% of women with births in Bertie County are unmarried. Women with the educational attainment of less than high school are most likely to be married with 100.0% of them married at childbirth, while women with the educational attainment of high school diploma are least likely to be married with 100.0% of them unmarried at childbirth.
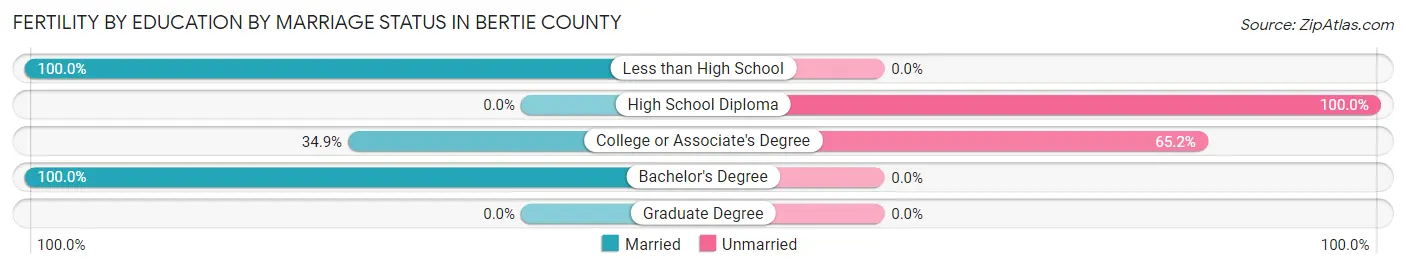
| Educational Attainment | Married | Unmarried |
| Less than High School | 3 (100.0%) | 0 (0.0%) |
| High School Diploma | 0 (0.0%) | 62 (100.0%) |
| College or Associate's Degree | 46 (34.8%) | 86 (65.1%) |
| Bachelor's Degree | 79 (100.0%) | 0 (0.0%) |
| Graduate Degree | 0 (0.0%) | 0 (0.0%) |
| Total | 128 (46.4%) | 148 (53.6%) |
Employment Characteristics in Bertie County
Employment by Class of Employer in Bertie County
Among the 6,177 employed individuals in Bertie County, private company employees (3,571 | 57.8%), state government employees (891 | 14.4%), and local government employees (527 | 8.5%) make up the most common classes of employment.
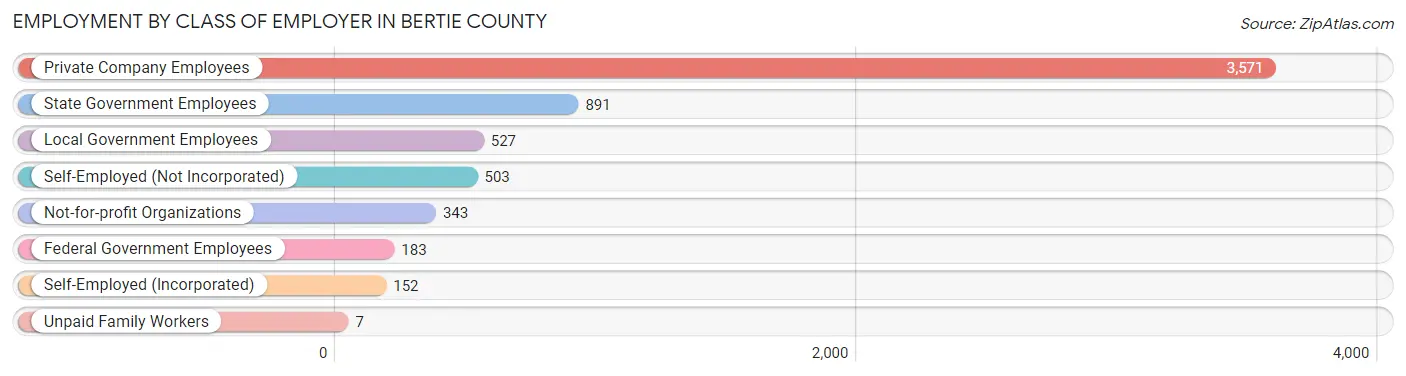
| Employer Class | # Employees | % Employees |
| Private Company Employees | 3,571 | 57.8% |
| Self-Employed (Incorporated) | 152 | 2.5% |
| Self-Employed (Not Incorporated) | 503 | 8.1% |
| Not-for-profit Organizations | 343 | 5.6% |
| Local Government Employees | 527 | 8.5% |
| State Government Employees | 891 | 14.4% |
| Federal Government Employees | 183 | 3.0% |
| Unpaid Family Workers | 7 | 0.1% |
| Total | 6,177 | 100.0% |
Employment Status by Age in Bertie County
According to the labor force statistics for Bertie County, out of the total population over 16 years of age (15,192), 44.4% or 6,745 individuals are in the labor force, with 6.4% or 432 of them unemployed. The age group with the highest labor force participation rate is 45 to 54 years, with 72.2% or 1,509 individuals in the labor force. Within the labor force, the 30 to 34 years age range has the highest percentage of unemployed individuals, with 23.1% or 137 of them being unemployed.
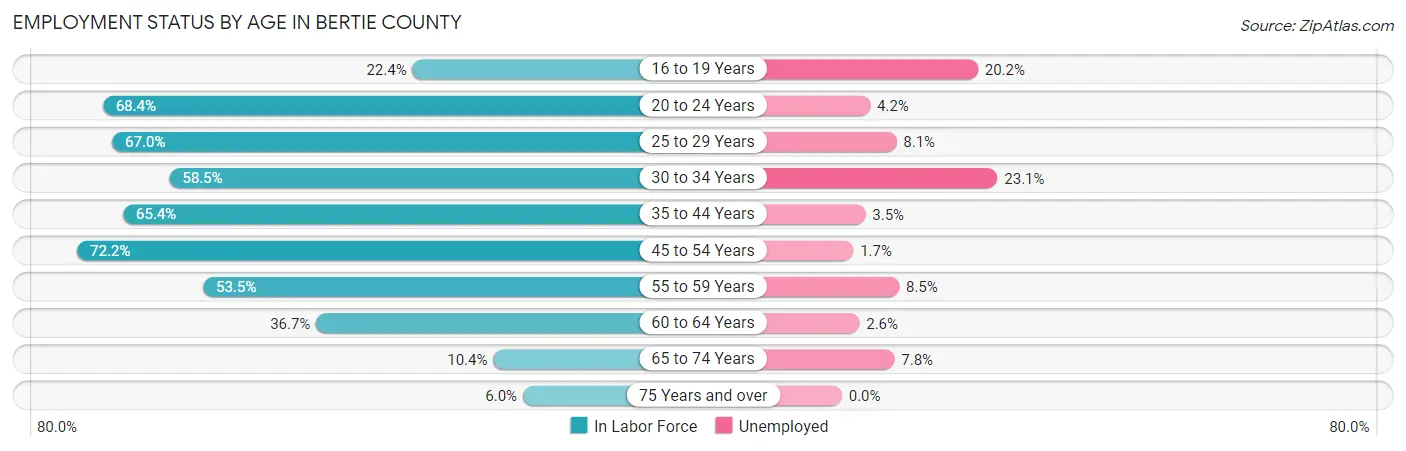
| Age Bracket | In Labor Force | Unemployed |
| 16 to 19 Years | 163 (22.4%) | 33 (20.2%) |
| 20 to 24 Years | 710 (68.4%) | 30 (4.2%) |
| 25 to 29 Years | 855 (67.0%) | 69 (8.1%) |
| 30 to 34 Years | 594 (58.5%) | 137 (23.1%) |
| 35 to 44 Years | 1,324 (65.4%) | 46 (3.5%) |
| 45 to 54 Years | 1,509 (72.2%) | 26 (1.7%) |
| 55 to 59 Years | 649 (53.5%) | 55 (8.5%) |
| 60 to 64 Years | 570 (36.7%) | 15 (2.6%) |
| 65 to 74 Years | 257 (10.4%) | 20 (7.8%) |
| 75 Years and over | 107 (6.0%) | 0 (0.0%) |
| Total | 6,745 (44.4%) | 432 (6.4%) |
Employment Status by Educational Attainment in Bertie County
According to labor force statistics for Bertie County, 60.0% of individuals (5,503) out of the total population between 25 and 64 years of age (9,172) are in the labor force, with 6.3% or 347 of them being unemployed. The group with the highest labor force participation rate are those with the educational attainment of bachelor's degree or higher, with 85.1% or 1,352 individuals in the labor force. Within the labor force, individuals with less than high school education have the highest percentage of unemployment, with 18.7% or 134 of them being unemployed.
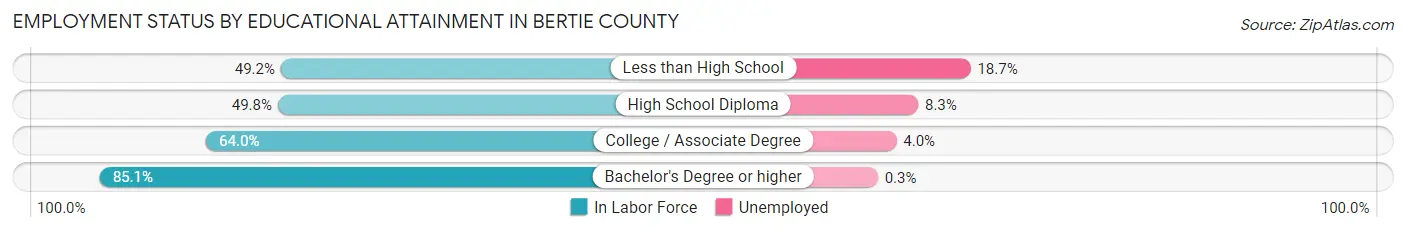
| Educational Attainment | In Labor Force | Unemployed |
| Less than High School | 716 (49.2%) | 272 (18.7%) |
| High School Diploma | 1,713 (49.8%) | 286 (8.3%) |
| College / Associate Degree | 1,720 (64.0%) | 108 (4.0%) |
| Bachelor's Degree or higher | 1,352 (85.1%) | 5 (0.3%) |
| Total | 5,503 (60.0%) | 578 (6.3%) |
Employment Occupations by Sex in Bertie County
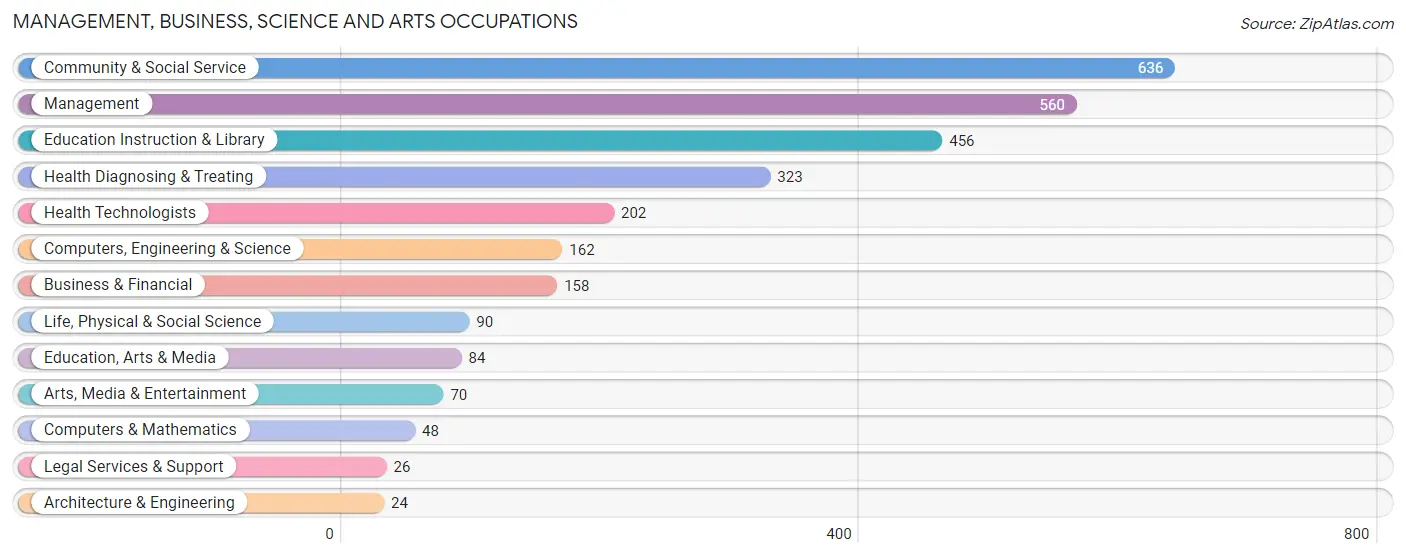
Management, Business, Science and Arts Occupations
The most common Management, Business, Science and Arts occupations in Bertie County are Community & Social Service (636 | 10.1%), Management (560 | 8.9%), Education Instruction & Library (456 | 7.2%), Health Diagnosing & Treating (323 | 5.1%), and Health Technologists (202 | 3.2%).
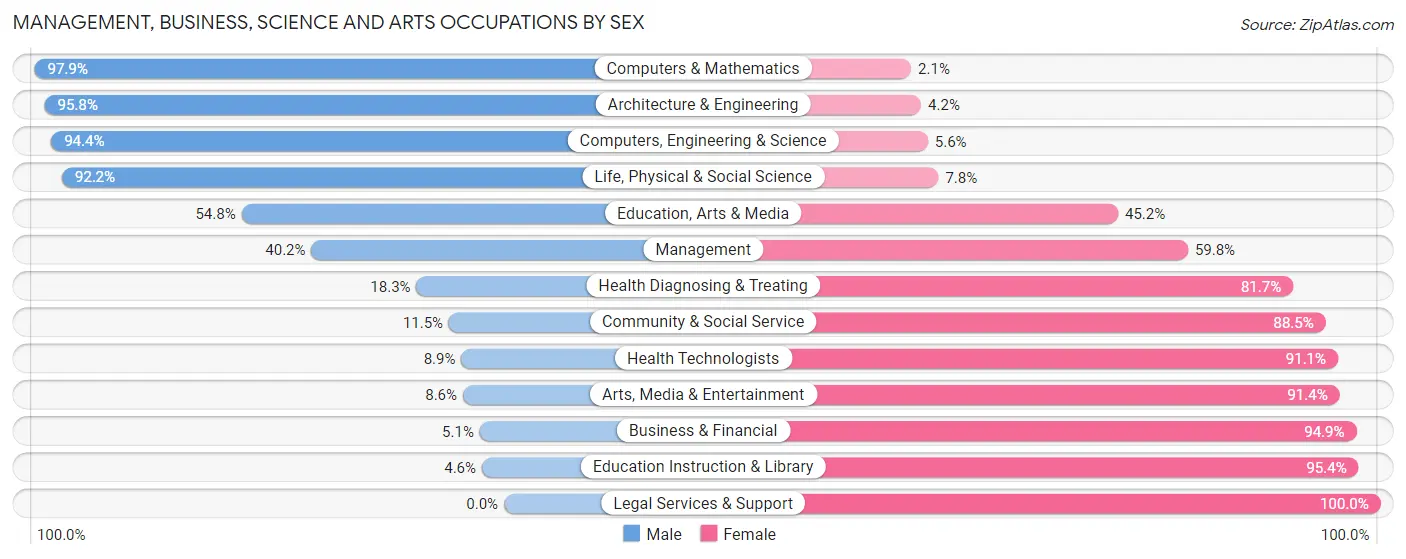
Management, Business, Science and Arts Occupations by Sex
Within the Management, Business, Science and Arts occupations in Bertie County, the most male-oriented occupations are Computers & Mathematics (97.9%), Architecture & Engineering (95.8%), and Computers, Engineering & Science (94.4%), while the most female-oriented occupations are Legal Services & Support (100.0%), Education Instruction & Library (95.4%), and Business & Financial (94.9%).
| Occupation | Male | Female |
| Management | 225 (40.2%) | 335 (59.8%) |
| Business & Financial | 8 (5.1%) | 150 (94.9%) |
| Computers, Engineering & Science | 153 (94.4%) | 9 (5.6%) |
| Computers & Mathematics | 47 (97.9%) | 1 (2.1%) |
| Architecture & Engineering | 23 (95.8%) | 1 (4.2%) |
| Life, Physical & Social Science | 83 (92.2%) | 7 (7.8%) |
| Community & Social Service | 73 (11.5%) | 563 (88.5%) |
| Education, Arts & Media | 46 (54.8%) | 38 (45.2%) |
| Legal Services & Support | 0 (0.0%) | 26 (100.0%) |
| Education Instruction & Library | 21 (4.6%) | 435 (95.4%) |
| Arts, Media & Entertainment | 6 (8.6%) | 64 (91.4%) |
| Health Diagnosing & Treating | 59 (18.3%) | 264 (81.7%) |
| Health Technologists | 18 (8.9%) | 184 (91.1%) |
| Total (Category) | 518 (28.2%) | 1,321 (71.8%) |
| Total (Overall) | 3,000 (47.6%) | 3,308 (52.4%) |
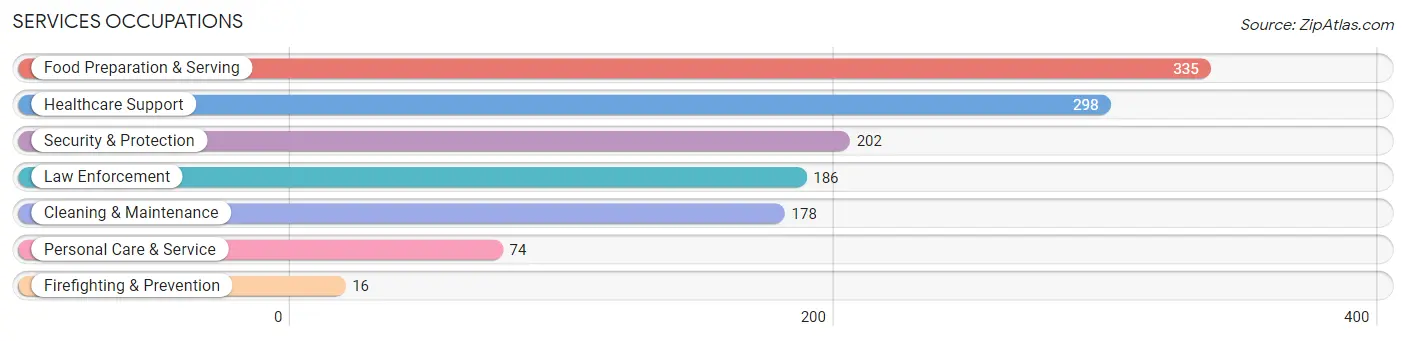
Services Occupations
The most common Services occupations in Bertie County are Food Preparation & Serving (335 | 5.3%), Healthcare Support (298 | 4.7%), Security & Protection (202 | 3.2%), Law Enforcement (186 | 2.9%), and Cleaning & Maintenance (178 | 2.8%).
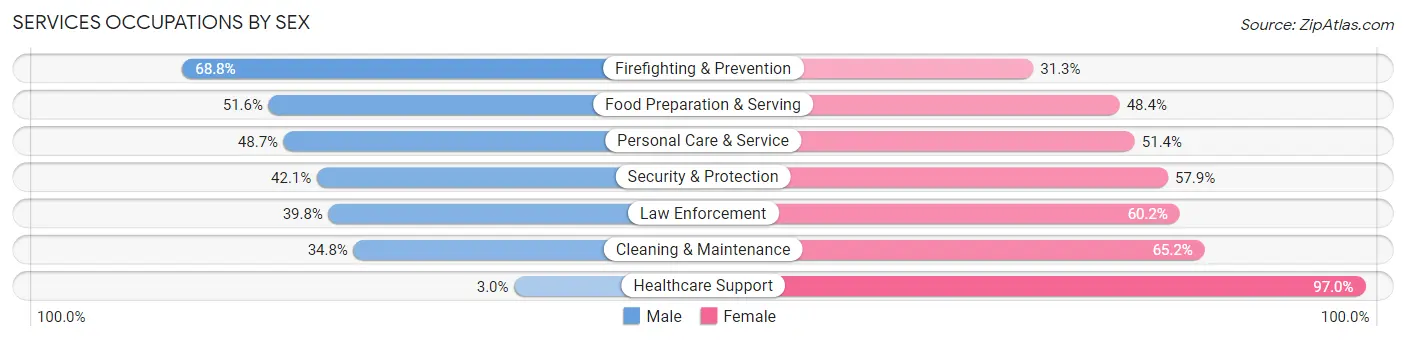
Services Occupations by Sex
Within the Services occupations in Bertie County, the most male-oriented occupations are Firefighting & Prevention (68.8%), Food Preparation & Serving (51.6%), and Personal Care & Service (48.6%), while the most female-oriented occupations are Healthcare Support (97.0%), Cleaning & Maintenance (65.2%), and Law Enforcement (60.2%).
| Occupation | Male | Female |
| Healthcare Support | 9 (3.0%) | 289 (97.0%) |
| Security & Protection | 85 (42.1%) | 117 (57.9%) |
| Firefighting & Prevention | 11 (68.8%) | 5 (31.2%) |
| Law Enforcement | 74 (39.8%) | 112 (60.2%) |
| Food Preparation & Serving | 173 (51.6%) | 162 (48.4%) |
| Cleaning & Maintenance | 62 (34.8%) | 116 (65.2%) |
| Personal Care & Service | 36 (48.6%) | 38 (51.3%) |
| Total (Category) | 365 (33.6%) | 722 (66.4%) |
| Total (Overall) | 3,000 (47.6%) | 3,308 (52.4%) |
Sales and Office Occupations
The most common Sales and Office occupations in Bertie County are Office & Administration (894 | 14.2%), and Sales & Related (300 | 4.8%).
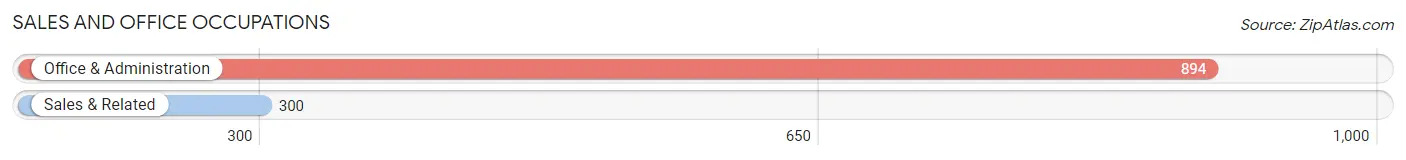
Sales and Office Occupations by Sex
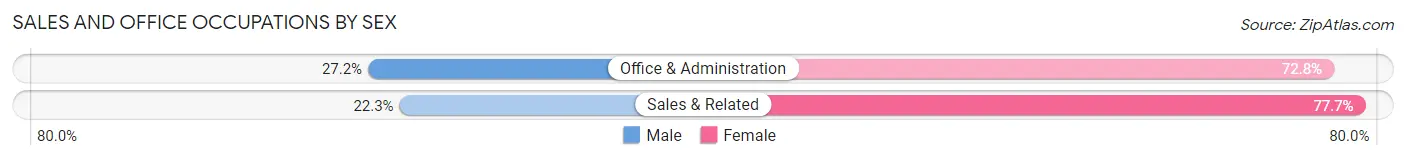
| Occupation | Male | Female |
| Sales & Related | 67 (22.3%) | 233 (77.7%) |
| Office & Administration | 243 (27.2%) | 651 (72.8%) |
| Total (Category) | 310 (26.0%) | 884 (74.0%) |
| Total (Overall) | 3,000 (47.6%) | 3,308 (52.4%) |
Natural Resources, Construction and Maintenance Occupations
The most common Natural Resources, Construction and Maintenance occupations in Bertie County are Construction & Extraction (324 | 5.1%), Farming, Fishing & Forestry (251 | 4.0%), and Installation, Maintenance & Repair (187 | 3.0%).
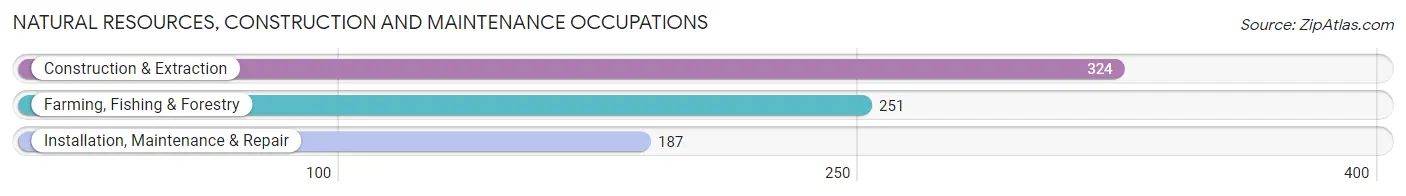
Natural Resources, Construction and Maintenance Occupations by Sex
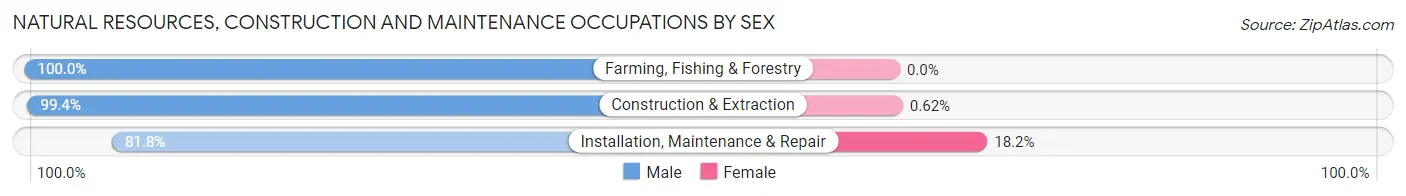
| Occupation | Male | Female |
| Farming, Fishing & Forestry | 251 (100.0%) | 0 (0.0%) |
| Construction & Extraction | 322 (99.4%) | 2 (0.6%) |
| Installation, Maintenance & Repair | 153 (81.8%) | 34 (18.2%) |
| Total (Category) | 726 (95.3%) | 36 (4.7%) |
| Total (Overall) | 3,000 (47.6%) | 3,308 (52.4%) |
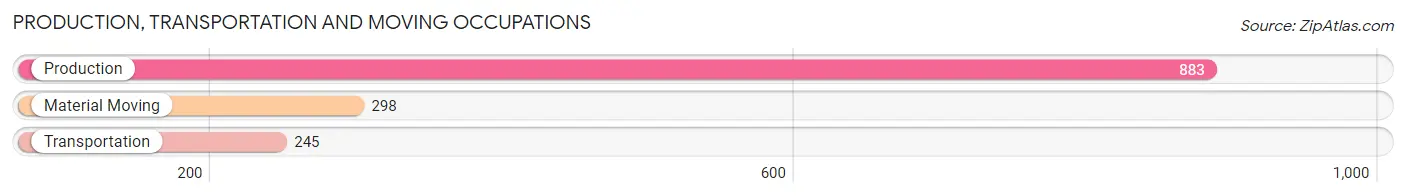
Production, Transportation and Moving Occupations
The most common Production, Transportation and Moving occupations in Bertie County are Production (883 | 14.0%), Material Moving (298 | 4.7%), and Transportation (245 | 3.9%).
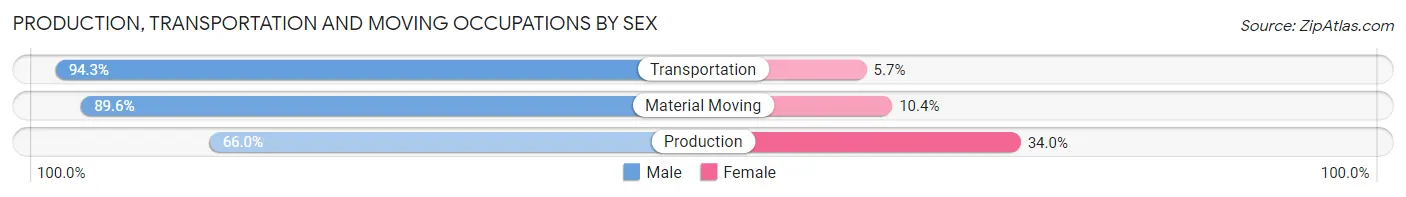
Production, Transportation and Moving Occupations by Sex
| Occupation | Male | Female |
| Production | 583 (66.0%) | 300 (34.0%) |
| Transportation | 231 (94.3%) | 14 (5.7%) |
| Material Moving | 267 (89.6%) | 31 (10.4%) |
| Total (Category) | 1,081 (75.8%) | 345 (24.2%) |
| Total (Overall) | 3,000 (47.6%) | 3,308 (52.4%) |
Employment Industries by Sex in Bertie County
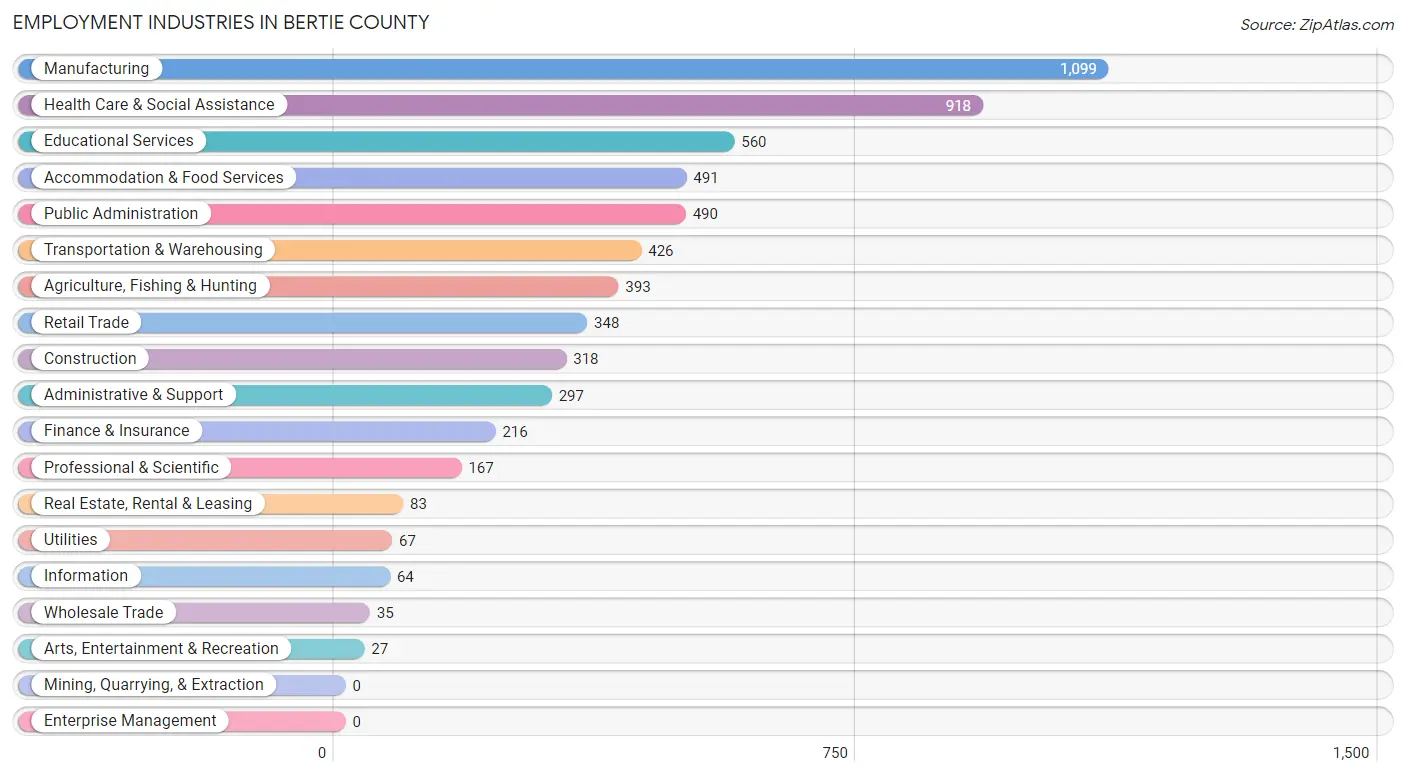
Employment Industries in Bertie County
The major employment industries in Bertie County include Manufacturing (1,099 | 17.4%), Health Care & Social Assistance (918 | 14.5%), Educational Services (560 | 8.9%), Accommodation & Food Services (491 | 7.8%), and Public Administration (490 | 7.8%).
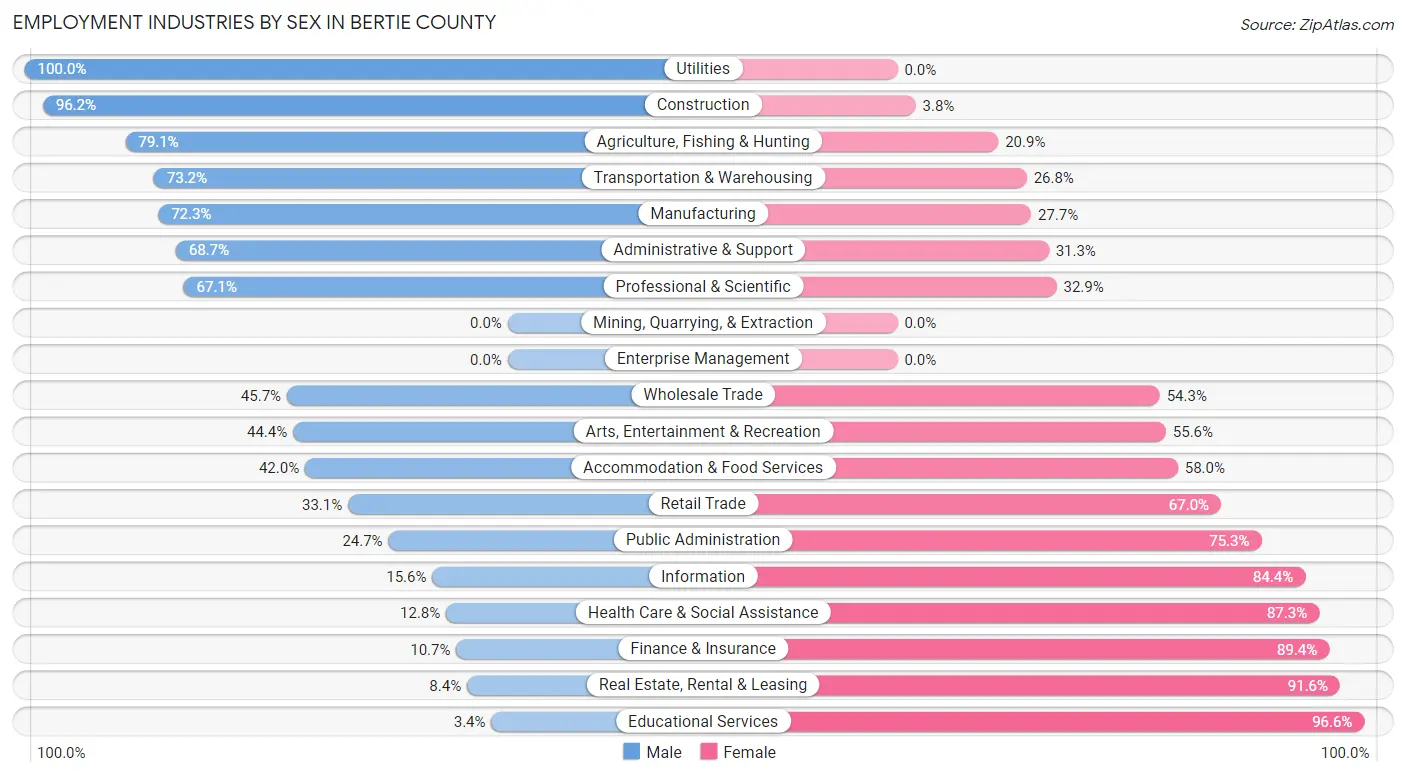
Employment Industries by Sex in Bertie County
The Bertie County industries that see more men than women are Utilities (100.0%), Construction (96.2%), and Agriculture, Fishing & Hunting (79.1%), whereas the industries that tend to have a higher number of women are Educational Services (96.6%), Real Estate, Rental & Leasing (91.6%), and Finance & Insurance (89.3%).
| Industry | Male | Female |
| Agriculture, Fishing & Hunting | 311 (79.1%) | 82 (20.9%) |
| Mining, Quarrying, & Extraction | 0 (0.0%) | 0 (0.0%) |
| Construction | 306 (96.2%) | 12 (3.8%) |
| Manufacturing | 795 (72.3%) | 304 (27.7%) |
| Wholesale Trade | 16 (45.7%) | 19 (54.3%) |
| Retail Trade | 115 (33.1%) | 233 (66.9%) |
| Transportation & Warehousing | 312 (73.2%) | 114 (26.8%) |
| Utilities | 67 (100.0%) | 0 (0.0%) |
| Information | 10 (15.6%) | 54 (84.4%) |
| Finance & Insurance | 23 (10.6%) | 193 (89.3%) |
| Real Estate, Rental & Leasing | 7 (8.4%) | 76 (91.6%) |
| Professional & Scientific | 112 (67.1%) | 55 (32.9%) |
| Enterprise Management | 0 (0.0%) | 0 (0.0%) |
| Administrative & Support | 204 (68.7%) | 93 (31.3%) |
| Educational Services | 19 (3.4%) | 541 (96.6%) |
| Health Care & Social Assistance | 117 (12.8%) | 801 (87.3%) |
| Arts, Entertainment & Recreation | 12 (44.4%) | 15 (55.6%) |
| Accommodation & Food Services | 206 (42.0%) | 285 (58.0%) |
| Public Administration | 121 (24.7%) | 369 (75.3%) |
| Total | 3,000 (47.6%) | 3,308 (52.4%) |
Education in Bertie County
School Enrollment in Bertie County
The most common levels of schooling among the 3,091 students in Bertie County are high school (821 | 26.6%), middle school (639 | 20.7%), and elementary school (605 | 19.6%).
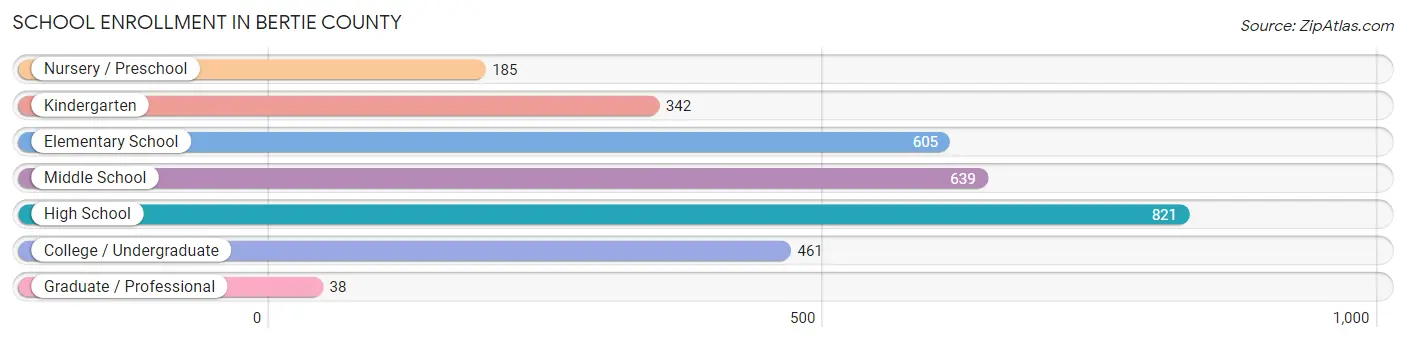
| School Level | # Students | % Students |
| Nursery / Preschool | 185 | 6.0% |
| Kindergarten | 342 | 11.1% |
| Elementary School | 605 | 19.6% |
| Middle School | 639 | 20.7% |
| High School | 821 | 26.6% |
| College / Undergraduate | 461 | 14.9% |
| Graduate / Professional | 38 | 1.2% |
| Total | 3,091 | 100.0% |
School Enrollment by Age by Funding Source in Bertie County
Out of a total of 3,091 students who are enrolled in schools in Bertie County, 634 (20.5%) attend a private institution, while the remaining 2,457 (79.5%) are enrolled in public schools. The age group of 35 years and over has the highest likelihood of being enrolled in private schools, with 88 (33.1% in the age bracket) enrolled. Conversely, the age group of 20 to 24 year olds has the lowest likelihood of being enrolled in a private school, with 181 (100.0% in the age bracket) attending a public institution.
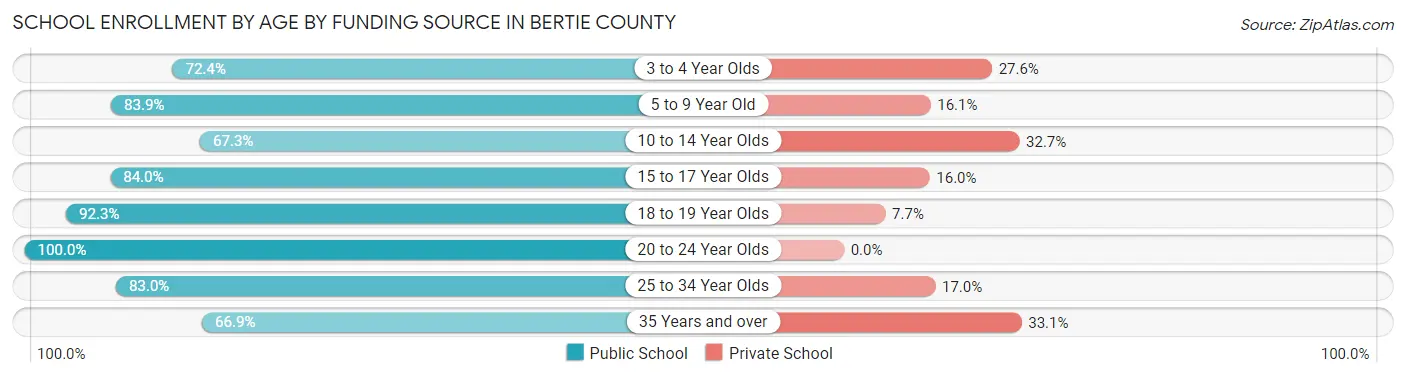
| Age Bracket | Public School | Private School |
| 3 to 4 Year Olds | 134 (72.4%) | 51 (27.6%) |
| 5 to 9 Year Old | 749 (83.9%) | 144 (16.1%) |
| 10 to 14 Year Olds | 482 (67.3%) | 234 (32.7%) |
| 15 to 17 Year Olds | 479 (84.0%) | 91 (16.0%) |
| 18 to 19 Year Olds | 215 (92.3%) | 18 (7.7%) |
| 20 to 24 Year Olds | 181 (100.0%) | 0 (0.0%) |
| 25 to 34 Year Olds | 39 (83.0%) | 8 (17.0%) |
| 35 Years and over | 178 (66.9%) | 88 (33.1%) |
| Total | 2,457 (79.5%) | 634 (20.5%) |
Educational Attainment by Field of Study in Bertie County
Education (519 | 22.7%), business (361 | 15.8%), computers & mathematics (288 | 12.6%), arts & humanities (281 | 12.3%), and science & technology (211 | 9.2%) are the most common fields of study among 2,284 individuals in Bertie County who have obtained a bachelor's degree or higher.
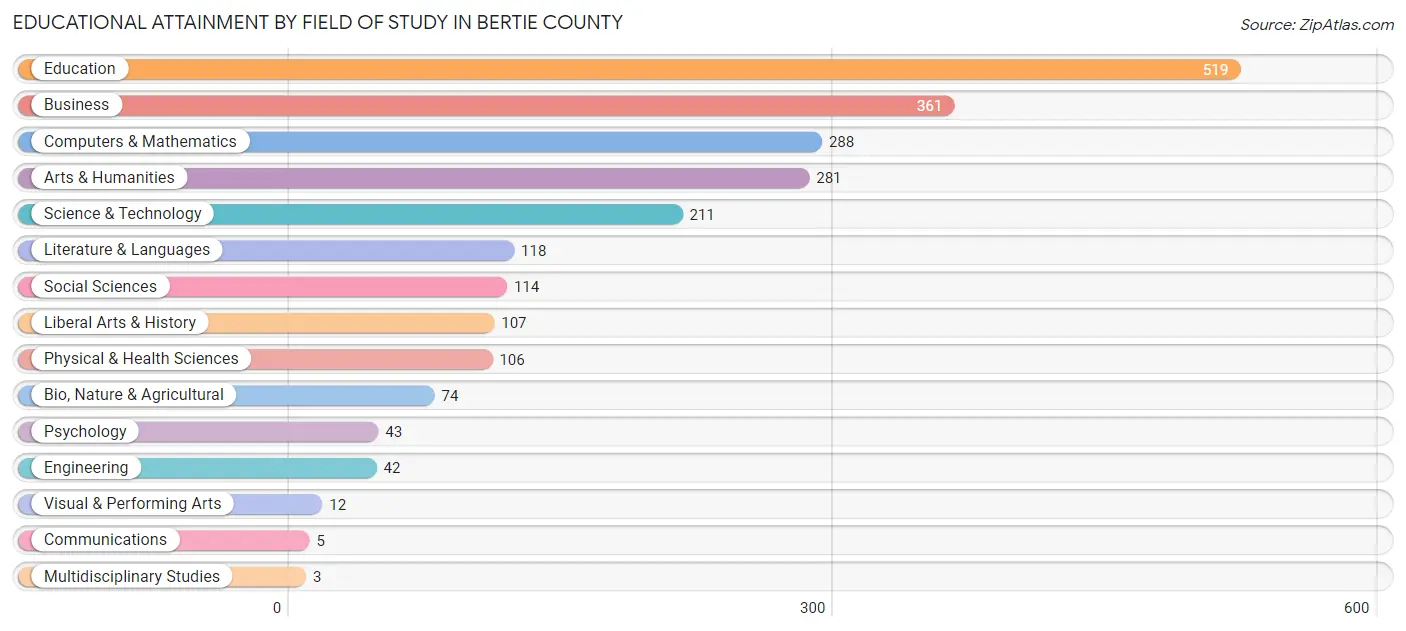
| Field of Study | # Graduates | % Graduates |
| Computers & Mathematics | 288 | 12.6% |
| Bio, Nature & Agricultural | 74 | 3.2% |
| Physical & Health Sciences | 106 | 4.6% |
| Psychology | 43 | 1.9% |
| Social Sciences | 114 | 5.0% |
| Engineering | 42 | 1.8% |
| Multidisciplinary Studies | 3 | 0.1% |
| Science & Technology | 211 | 9.2% |
| Business | 361 | 15.8% |
| Education | 519 | 22.7% |
| Literature & Languages | 118 | 5.2% |
| Liberal Arts & History | 107 | 4.7% |
| Visual & Performing Arts | 12 | 0.5% |
| Communications | 5 | 0.2% |
| Arts & Humanities | 281 | 12.3% |
| Total | 2,284 | 100.0% |
Transportation & Commute in Bertie County
Vehicle Availability by Sex in Bertie County
The most prevalent vehicle ownership categories in Bertie County are males with 3 vehicles (753, accounting for 25.7%) and females with 3 vehicles (779, making up 23.2%).
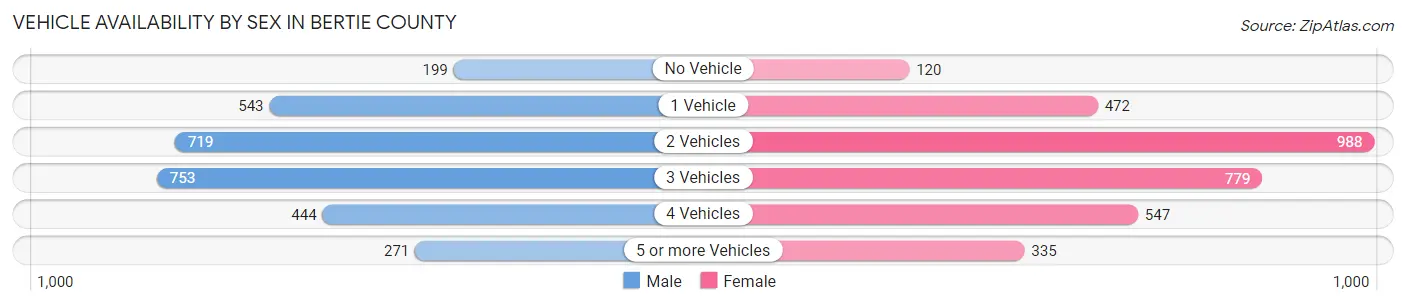
| Vehicles Available | Male | Female |
| No Vehicle | 199 (6.8%) | 120 (3.7%) |
| 1 Vehicle | 543 (18.5%) | 472 (14.6%) |
| 2 Vehicles | 719 (24.5%) | 988 (30.5%) |
| 3 Vehicles | 753 (25.7%) | 779 (24.0%) |
| 4 Vehicles | 444 (15.2%) | 547 (16.9%) |
| 5 or more Vehicles | 271 (9.2%) | 335 (10.3%) |
| Total | 2,929 (100.0%) | 3,241 (100.0%) |
Commute Time in Bertie County
The most frequently occuring commute durations in Bertie County are 15 to 19 minutes (909 commuters, 15.1%), 20 to 24 minutes (874 commuters, 14.5%), and 5 to 9 minutes (868 commuters, 14.4%).
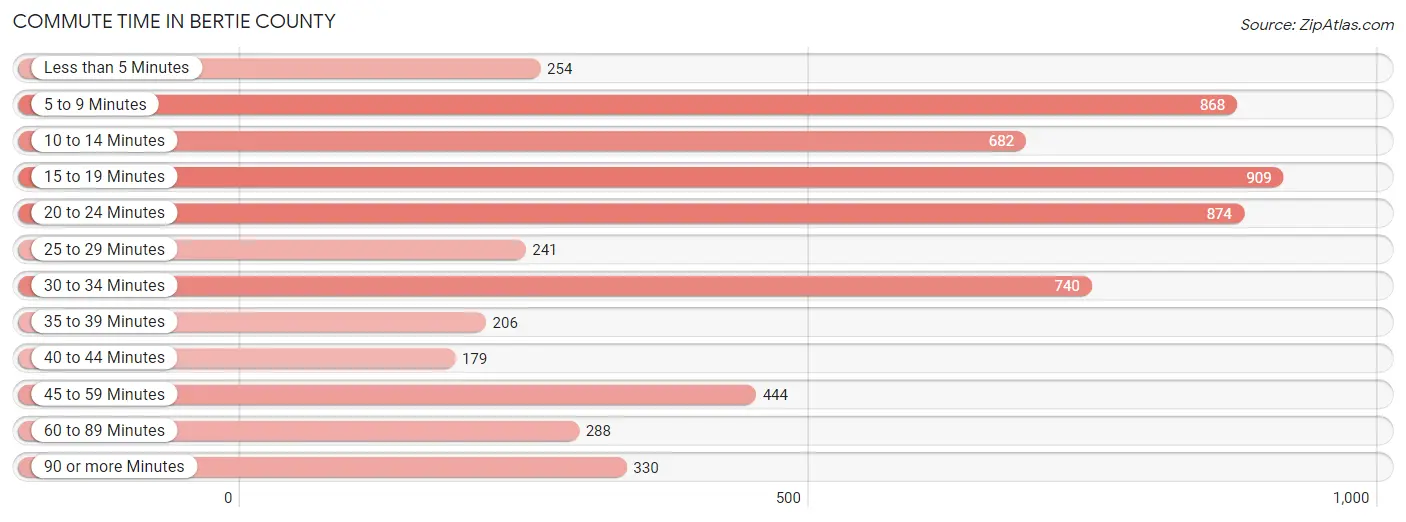
| Commute Time | # Commuters | % Commuters |
| Less than 5 Minutes | 254 | 4.2% |
| 5 to 9 Minutes | 868 | 14.4% |
| 10 to 14 Minutes | 682 | 11.3% |
| 15 to 19 Minutes | 909 | 15.1% |
| 20 to 24 Minutes | 874 | 14.5% |
| 25 to 29 Minutes | 241 | 4.0% |
| 30 to 34 Minutes | 740 | 12.3% |
| 35 to 39 Minutes | 206 | 3.4% |
| 40 to 44 Minutes | 179 | 3.0% |
| 45 to 59 Minutes | 444 | 7.4% |
| 60 to 89 Minutes | 288 | 4.8% |
| 90 or more Minutes | 330 | 5.5% |
Commute Time by Sex in Bertie County
The most common commute times in Bertie County are 15 to 19 minutes (439 commuters, 15.4%) for males and 20 to 24 minutes (490 commuters, 15.5%) for females.
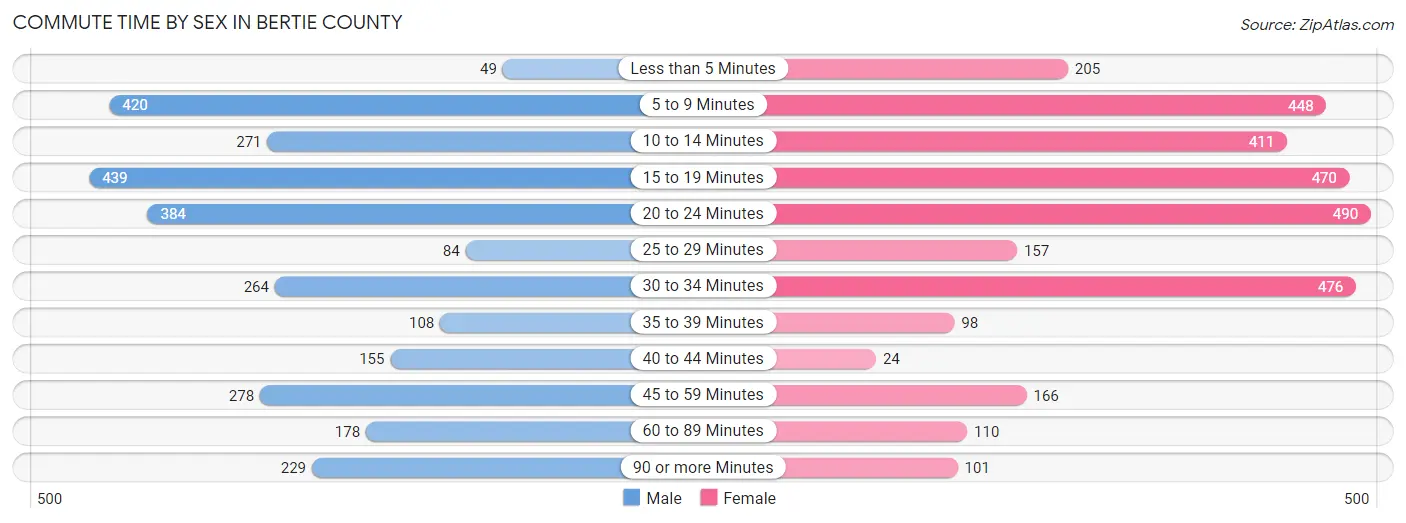
| Commute Time | Male | Female |
| Less than 5 Minutes | 49 (1.7%) | 205 (6.5%) |
| 5 to 9 Minutes | 420 (14.7%) | 448 (14.2%) |
| 10 to 14 Minutes | 271 (9.5%) | 411 (13.0%) |
| 15 to 19 Minutes | 439 (15.4%) | 470 (14.9%) |
| 20 to 24 Minutes | 384 (13.4%) | 490 (15.5%) |
| 25 to 29 Minutes | 84 (2.9%) | 157 (5.0%) |
| 30 to 34 Minutes | 264 (9.2%) | 476 (15.1%) |
| 35 to 39 Minutes | 108 (3.8%) | 98 (3.1%) |
| 40 to 44 Minutes | 155 (5.4%) | 24 (0.8%) |
| 45 to 59 Minutes | 278 (9.7%) | 166 (5.3%) |
| 60 to 89 Minutes | 178 (6.2%) | 110 (3.5%) |
| 90 or more Minutes | 229 (8.0%) | 101 (3.2%) |
Time of Departure to Work by Sex in Bertie County
The most frequent times of departure to work in Bertie County are 7:00 AM to 7:29 AM (491, 17.2%) for males and 7:30 AM to 7:59 AM (631, 20.0%) for females.
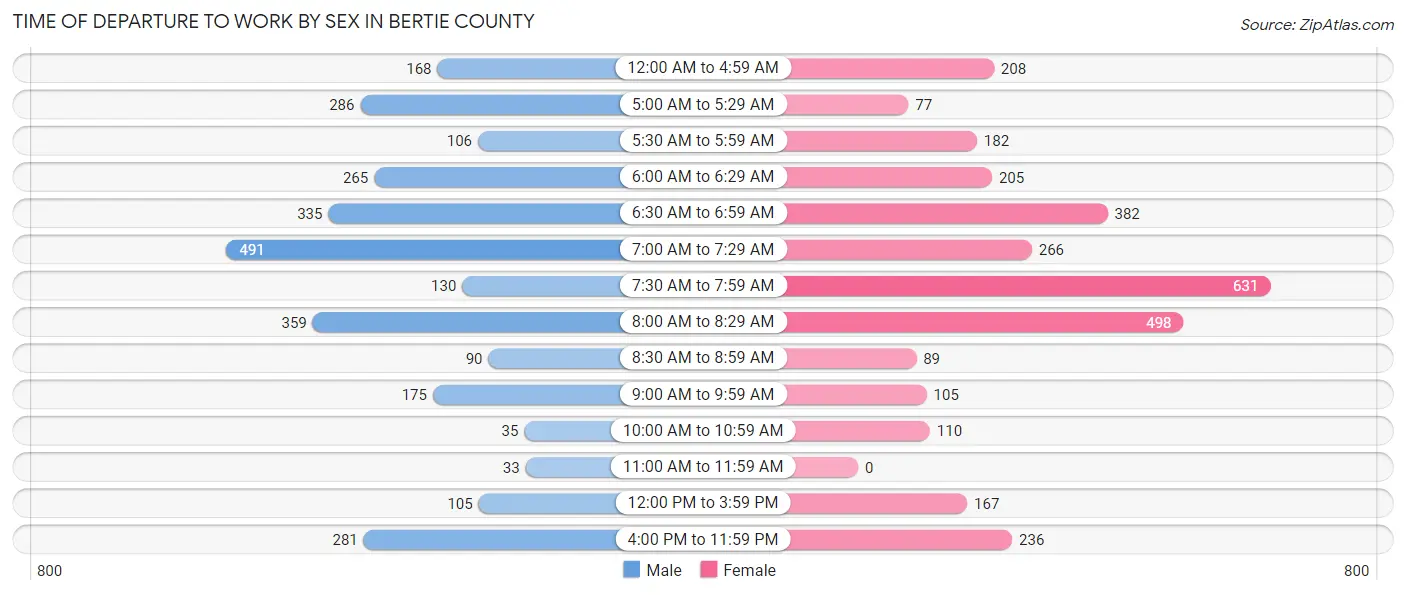
| Time of Departure | Male | Female |
| 12:00 AM to 4:59 AM | 168 (5.9%) | 208 (6.6%) |
| 5:00 AM to 5:29 AM | 286 (10.0%) | 77 (2.4%) |
| 5:30 AM to 5:59 AM | 106 (3.7%) | 182 (5.8%) |
| 6:00 AM to 6:29 AM | 265 (9.3%) | 205 (6.5%) |
| 6:30 AM to 6:59 AM | 335 (11.7%) | 382 (12.1%) |
| 7:00 AM to 7:29 AM | 491 (17.2%) | 266 (8.4%) |
| 7:30 AM to 7:59 AM | 130 (4.5%) | 631 (20.0%) |
| 8:00 AM to 8:29 AM | 359 (12.6%) | 498 (15.8%) |
| 8:30 AM to 8:59 AM | 90 (3.2%) | 89 (2.8%) |
| 9:00 AM to 9:59 AM | 175 (6.1%) | 105 (3.3%) |
| 10:00 AM to 10:59 AM | 35 (1.2%) | 110 (3.5%) |
| 11:00 AM to 11:59 AM | 33 (1.1%) | 0 (0.0%) |
| 12:00 PM to 3:59 PM | 105 (3.7%) | 167 (5.3%) |
| 4:00 PM to 11:59 PM | 281 (9.8%) | 236 (7.5%) |
| Total | 2,859 (100.0%) | 3,156 (100.0%) |
Housing Occupancy in Bertie County
Occupancy by Ownership in Bertie County
Of the total 6,984 dwellings in Bertie County, owner-occupied units account for 5,233 (74.9%), while renter-occupied units make up 1,751 (25.1%).
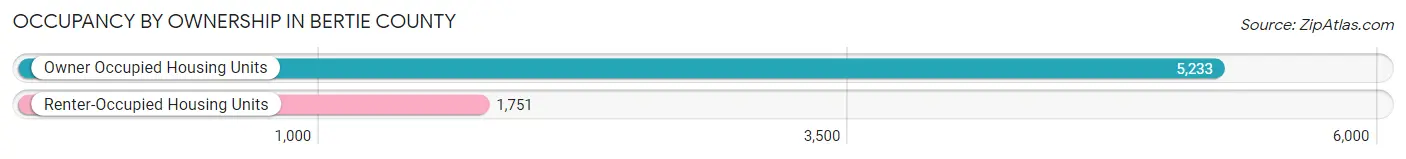
| Occupancy | # Housing Units | % Housing Units |
| Owner Occupied Housing Units | 5,233 | 74.9% |
| Renter-Occupied Housing Units | 1,751 | 25.1% |
| Total Occupied Housing Units | 6,984 | 100.0% |
Occupancy by Household Size in Bertie County
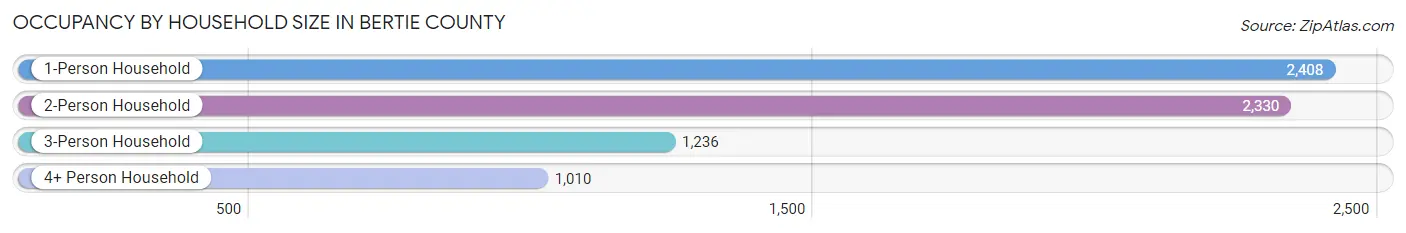
| Household Size | # Housing Units | % Housing Units |
| 1-Person Household | 2,408 | 34.5% |
| 2-Person Household | 2,330 | 33.4% |
| 3-Person Household | 1,236 | 17.7% |
| 4+ Person Household | 1,010 | 14.5% |
| Total Housing Units | 6,984 | 100.0% |
Occupancy by Ownership by Household Size in Bertie County
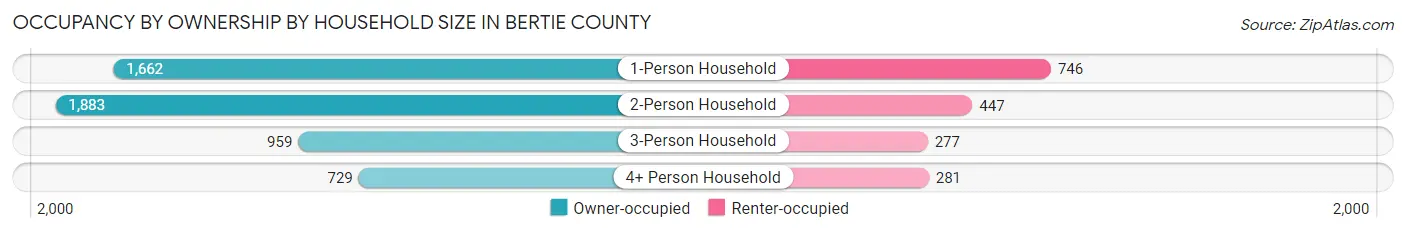
| Household Size | Owner-occupied | Renter-occupied |
| 1-Person Household | 1,662 (69.0%) | 746 (31.0%) |
| 2-Person Household | 1,883 (80.8%) | 447 (19.2%) |
| 3-Person Household | 959 (77.6%) | 277 (22.4%) |
| 4+ Person Household | 729 (72.2%) | 281 (27.8%) |
| Total Housing Units | 5,233 (74.9%) | 1,751 (25.1%) |
Occupancy by Educational Attainment in Bertie County
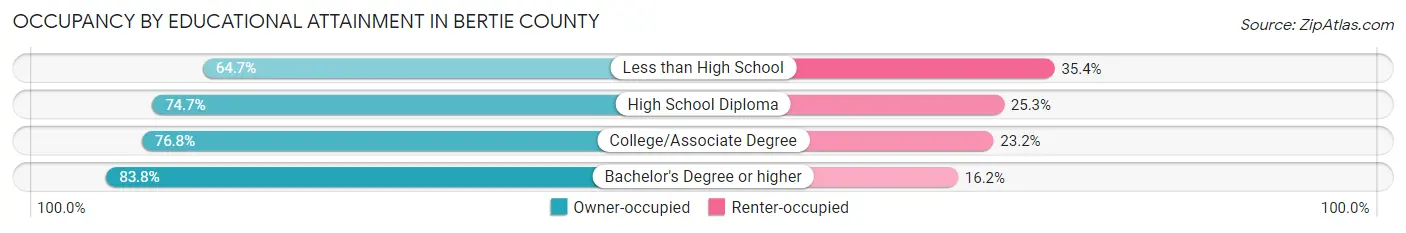
| Household Size | Owner-occupied | Renter-occupied |
| Less than High School | 865 (64.6%) | 473 (35.3%) |
| High School Diploma | 1,685 (74.7%) | 571 (25.3%) |
| College/Associate Degree | 1,721 (76.8%) | 521 (23.2%) |
| Bachelor's Degree or higher | 962 (83.8%) | 186 (16.2%) |
Occupancy by Age of Householder in Bertie County
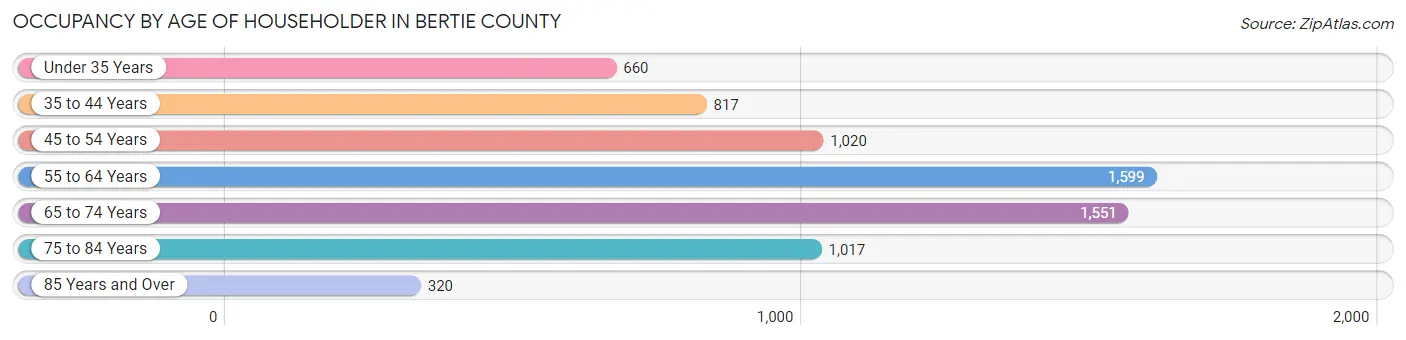
| Age Bracket | # Households | % Households |
| Under 35 Years | 660 | 9.5% |
| 35 to 44 Years | 817 | 11.7% |
| 45 to 54 Years | 1,020 | 14.6% |
| 55 to 64 Years | 1,599 | 22.9% |
| 65 to 74 Years | 1,551 | 22.2% |
| 75 to 84 Years | 1,017 | 14.6% |
| 85 Years and Over | 320 | 4.6% |
| Total | 6,984 | 100.0% |
Housing Finances in Bertie County
Median Income by Occupancy in Bertie County
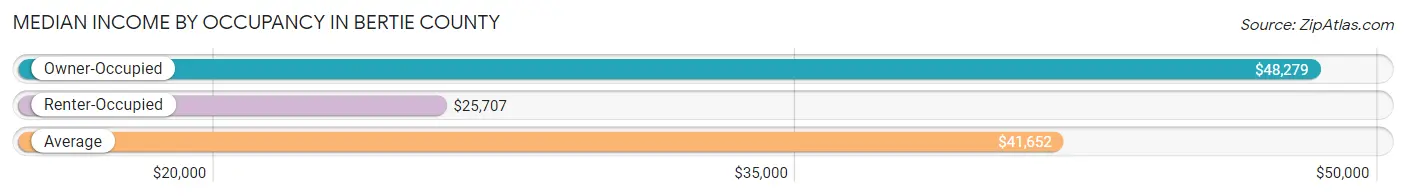
| Occupancy Type | # Households | Median Income |
| Owner-Occupied | 5,233 (74.9%) | $48,279 |
| Renter-Occupied | 1,751 (25.1%) | $25,707 |
| Average | 6,984 (100.0%) | $41,652 |
Occupancy by Householder Income Bracket in Bertie County
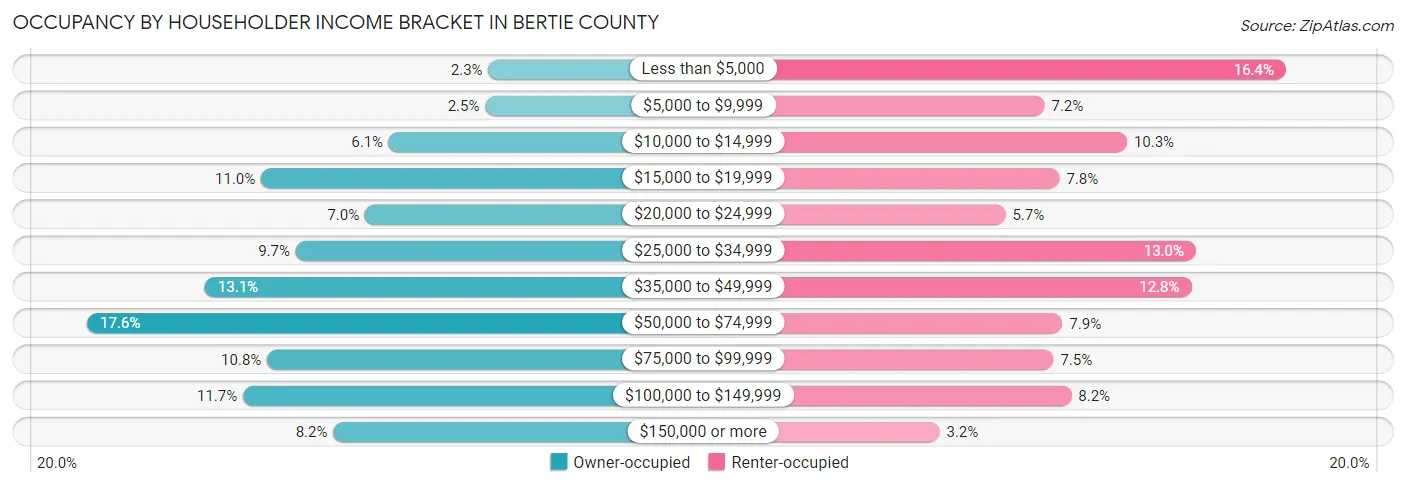
| Income Bracket | Owner-occupied | Renter-occupied |
| Less than $5,000 | 122 (2.3%) | 287 (16.4%) |
| $5,000 to $9,999 | 128 (2.5%) | 126 (7.2%) |
| $10,000 to $14,999 | 320 (6.1%) | 181 (10.3%) |
| $15,000 to $19,999 | 575 (11.0%) | 136 (7.8%) |
| $20,000 to $24,999 | 368 (7.0%) | 100 (5.7%) |
| $25,000 to $34,999 | 506 (9.7%) | 227 (13.0%) |
| $35,000 to $49,999 | 687 (13.1%) | 224 (12.8%) |
| $50,000 to $74,999 | 922 (17.6%) | 138 (7.9%) |
| $75,000 to $99,999 | 563 (10.8%) | 132 (7.5%) |
| $100,000 to $149,999 | 611 (11.7%) | 144 (8.2%) |
| $150,000 or more | 431 (8.2%) | 56 (3.2%) |
| Total | 5,233 (100.0%) | 1,751 (100.0%) |
Monthly Housing Cost Tiers in Bertie County
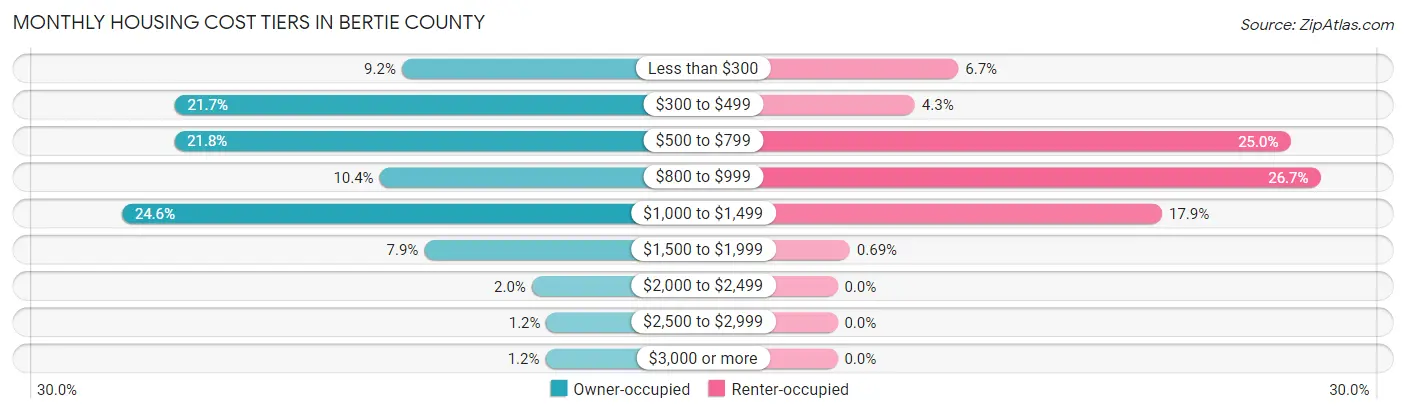
| Monthly Cost | Owner-occupied | Renter-occupied |
| Less than $300 | 480 (9.2%) | 117 (6.7%) |
| $300 to $499 | 1,136 (21.7%) | 75 (4.3%) |
| $500 to $799 | 1,138 (21.7%) | 438 (25.0%) |
| $800 to $999 | 544 (10.4%) | 467 (26.7%) |
| $1,000 to $1,499 | 1,289 (24.6%) | 314 (17.9%) |
| $1,500 to $1,999 | 415 (7.9%) | 12 (0.7%) |
| $2,000 to $2,499 | 104 (2.0%) | 0 (0.0%) |
| $2,500 to $2,999 | 62 (1.2%) | 0 (0.0%) |
| $3,000 or more | 65 (1.2%) | 0 (0.0%) |
| Total | 5,233 (100.0%) | 1,751 (100.0%) |
Physical Housing Characteristics in Bertie County
Housing Structures in Bertie County
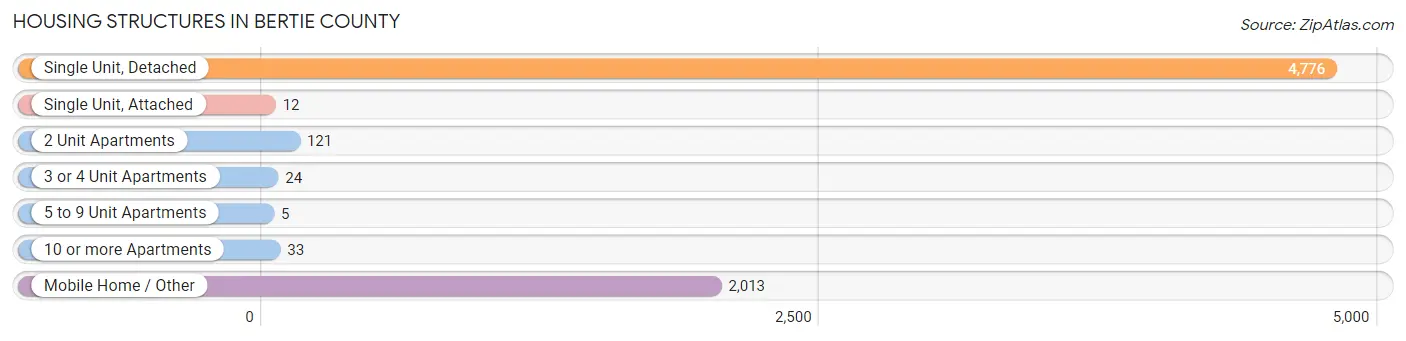
| Structure Type | # Housing Units | % Housing Units |
| Single Unit, Detached | 4,776 | 68.4% |
| Single Unit, Attached | 12 | 0.2% |
| 2 Unit Apartments | 121 | 1.7% |
| 3 or 4 Unit Apartments | 24 | 0.3% |
| 5 to 9 Unit Apartments | 5 | 0.1% |
| 10 or more Apartments | 33 | 0.5% |
| Mobile Home / Other | 2,013 | 28.8% |
| Total | 6,984 | 100.0% |
Housing Structures by Occupancy in Bertie County
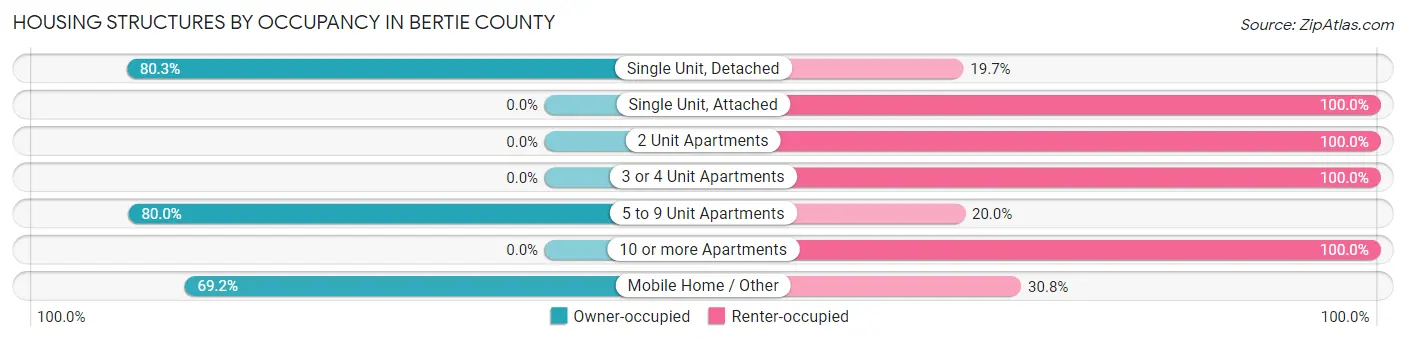
| Structure Type | Owner-occupied | Renter-occupied |
| Single Unit, Detached | 3,836 (80.3%) | 940 (19.7%) |
| Single Unit, Attached | 0 (0.0%) | 12 (100.0%) |
| 2 Unit Apartments | 0 (0.0%) | 121 (100.0%) |
| 3 or 4 Unit Apartments | 0 (0.0%) | 24 (100.0%) |
| 5 to 9 Unit Apartments | 4 (80.0%) | 1 (20.0%) |
| 10 or more Apartments | 0 (0.0%) | 33 (100.0%) |
| Mobile Home / Other | 1,393 (69.2%) | 620 (30.8%) |
| Total | 5,233 (74.9%) | 1,751 (25.1%) |
Housing Structures by Number of Rooms in Bertie County
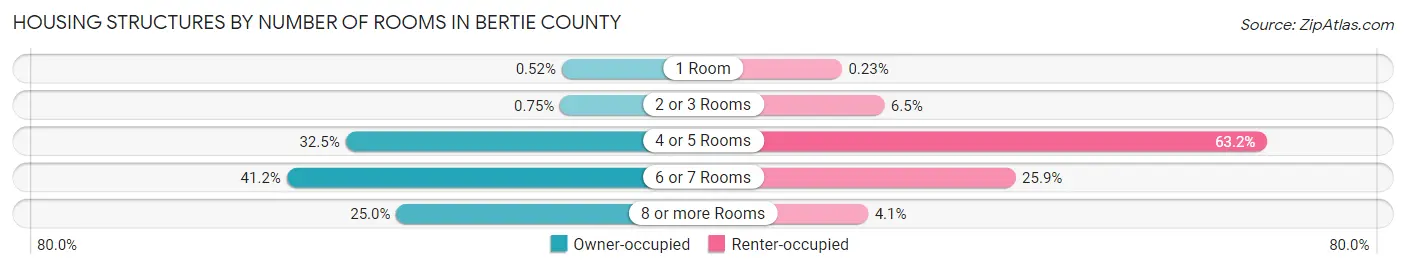
| Number of Rooms | Owner-occupied | Renter-occupied |
| 1 Room | 27 (0.5%) | 4 (0.2%) |
| 2 or 3 Rooms | 39 (0.7%) | 114 (6.5%) |
| 4 or 5 Rooms | 1,702 (32.5%) | 1,107 (63.2%) |
| 6 or 7 Rooms | 2,157 (41.2%) | 454 (25.9%) |
| 8 or more Rooms | 1,308 (25.0%) | 72 (4.1%) |
| Total | 5,233 (100.0%) | 1,751 (100.0%) |
Housing Structure by Heating Type in Bertie County
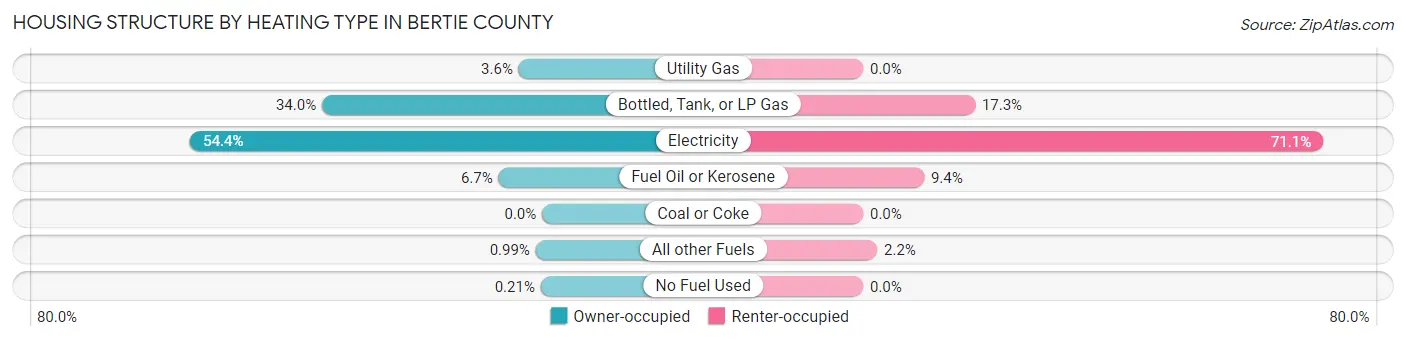
| Heating Type | Owner-occupied | Renter-occupied |
| Utility Gas | 189 (3.6%) | 0 (0.0%) |
| Bottled, Tank, or LP Gas | 1,781 (34.0%) | 303 (17.3%) |
| Electricity | 2,848 (54.4%) | 1,245 (71.1%) |
| Fuel Oil or Kerosene | 352 (6.7%) | 165 (9.4%) |
| Coal or Coke | 0 (0.0%) | 0 (0.0%) |
| All other Fuels | 52 (1.0%) | 38 (2.2%) |
| No Fuel Used | 11 (0.2%) | 0 (0.0%) |
| Total | 5,233 (100.0%) | 1,751 (100.0%) |
Household Vehicle Usage in Bertie County
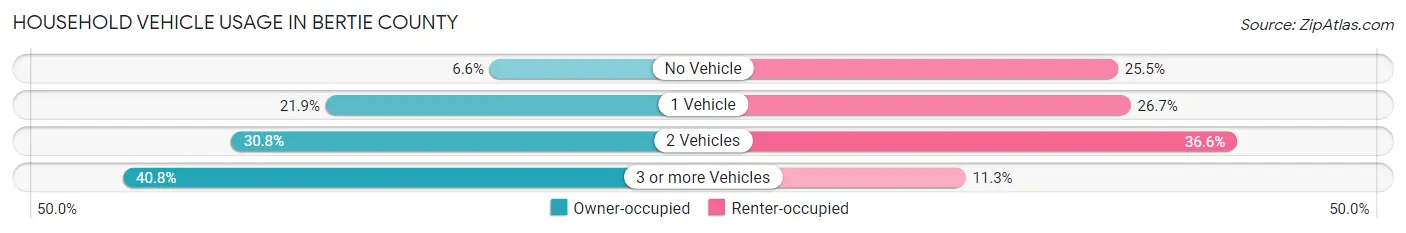
| Vehicles per Household | Owner-occupied | Renter-occupied |
| No Vehicle | 344 (6.6%) | 446 (25.5%) |
| 1 Vehicle | 1,145 (21.9%) | 467 (26.7%) |
| 2 Vehicles | 1,609 (30.7%) | 641 (36.6%) |
| 3 or more Vehicles | 2,135 (40.8%) | 197 (11.3%) |
| Total | 5,233 (100.0%) | 1,751 (100.0%) |
Real Estate & Mortgages in Bertie County
Real Estate and Mortgage Overview in Bertie County
| Characteristic | Without Mortgage | With Mortgage |
| Housing Units | 2,768 | 2,465 |
| Median Property Value | $70,300 | $109,900 |
| Median Household Income | $37,411 | $274 |
| Monthly Housing Costs | $454 | $65 |
| Real Estate Taxes | $554 | $82 |
Property Value by Mortgage Status in Bertie County
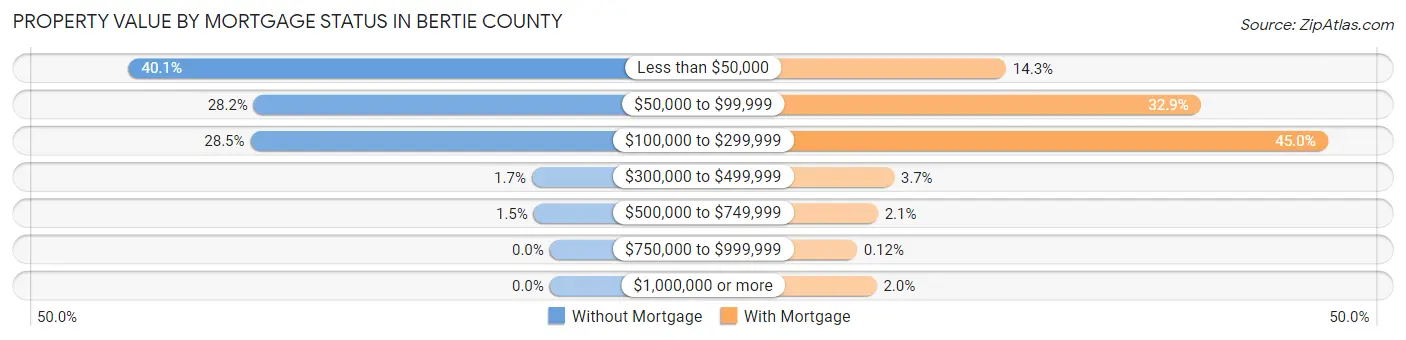
| Property Value | Without Mortgage | With Mortgage |
| Less than $50,000 | 1,110 (40.1%) | 353 (14.3%) |
| $50,000 to $99,999 | 780 (28.2%) | 810 (32.9%) |
| $100,000 to $299,999 | 789 (28.5%) | 1,108 (45.0%) |
| $300,000 to $499,999 | 47 (1.7%) | 90 (3.6%) |
| $500,000 to $749,999 | 42 (1.5%) | 52 (2.1%) |
| $750,000 to $999,999 | 0 (0.0%) | 3 (0.1%) |
| $1,000,000 or more | 0 (0.0%) | 49 (2.0%) |
| Total | 2,768 (100.0%) | 2,465 (100.0%) |
Household Income by Mortgage Status in Bertie County
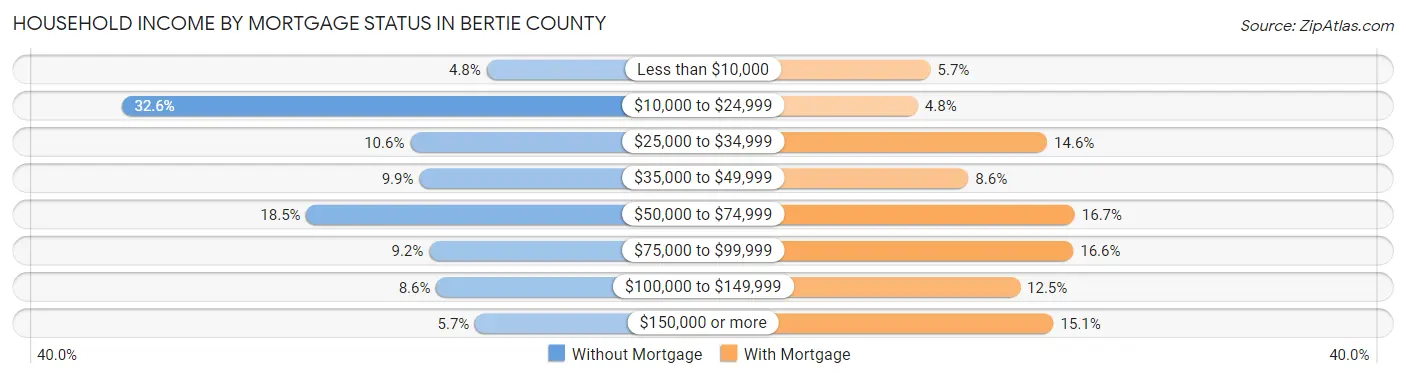
| Household Income | Without Mortgage | With Mortgage |
| Less than $10,000 | 133 (4.8%) | 141 (5.7%) |
| $10,000 to $24,999 | 903 (32.6%) | 117 (4.8%) |
| $25,000 to $34,999 | 294 (10.6%) | 360 (14.6%) |
| $35,000 to $49,999 | 275 (9.9%) | 212 (8.6%) |
| $50,000 to $74,999 | 513 (18.5%) | 412 (16.7%) |
| $75,000 to $99,999 | 254 (9.2%) | 409 (16.6%) |
| $100,000 to $149,999 | 239 (8.6%) | 309 (12.5%) |
| $150,000 or more | 157 (5.7%) | 372 (15.1%) |
| Total | 2,768 (100.0%) | 2,465 (100.0%) |
Property Value to Household Income Ratio in Bertie County
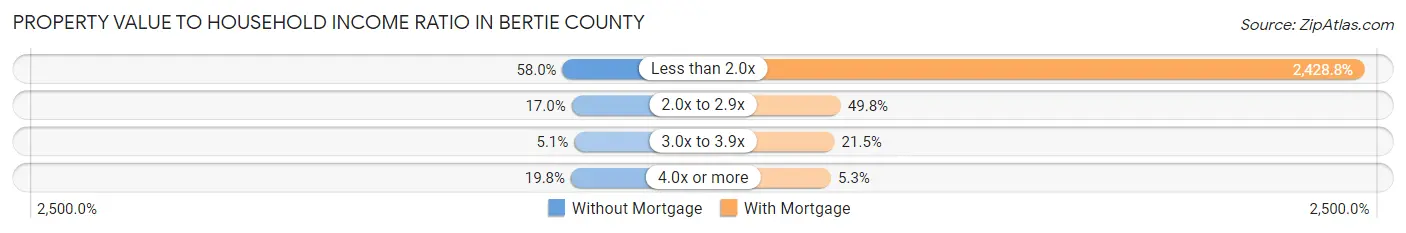
| Value-to-Income Ratio | Without Mortgage | With Mortgage |
| Less than 2.0x | 1,604 (58.0%) | 59,871 (2,428.8%) |
| 2.0x to 2.9x | 470 (17.0%) | 1,228 (49.8%) |
| 3.0x to 3.9x | 141 (5.1%) | 530 (21.5%) |
| 4.0x or more | 549 (19.8%) | 131 (5.3%) |
| Total | 2,768 (100.0%) | 2,465 (100.0%) |
Real Estate Taxes by Mortgage Status in Bertie County
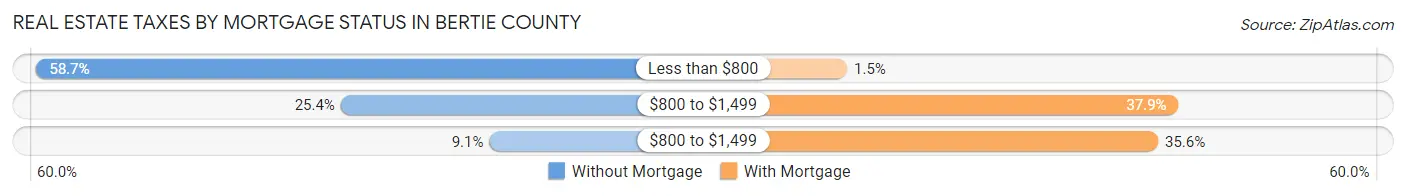
| Property Taxes | Without Mortgage | With Mortgage |
| Less than $800 | 1,625 (58.7%) | 38 (1.5%) |
| $800 to $1,499 | 702 (25.4%) | 933 (37.9%) |
| $800 to $1,499 | 251 (9.1%) | 878 (35.6%) |
| Total | 2,768 (100.0%) | 2,465 (100.0%) |
Health & Disability in Bertie County
Health Insurance Coverage by Age in Bertie County
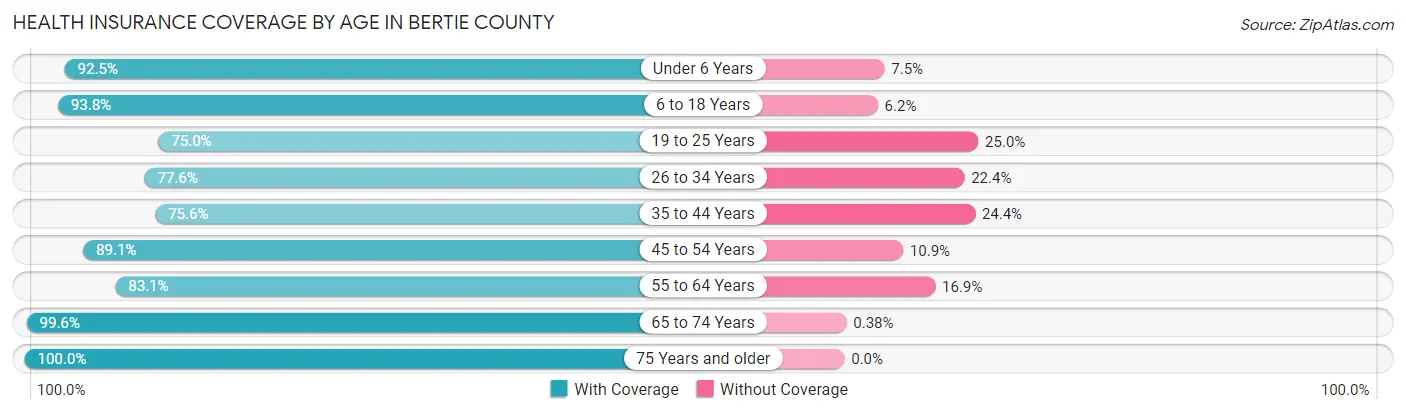
| Age Bracket | With Coverage | Without Coverage |
| Under 6 Years | 817 (92.5%) | 66 (7.5%) |
| 6 to 18 Years | 2,200 (93.8%) | 146 (6.2%) |
| 19 to 25 Years | 920 (75.0%) | 306 (25.0%) |
| 26 to 34 Years | 1,319 (77.6%) | 380 (22.4%) |
| 35 to 44 Years | 1,245 (75.6%) | 401 (24.4%) |
| 45 to 54 Years | 1,719 (89.1%) | 211 (10.9%) |
| 55 to 64 Years | 2,149 (83.1%) | 438 (16.9%) |
| 65 to 74 Years | 2,362 (99.6%) | 9 (0.4%) |
| 75 Years and older | 1,693 (100.0%) | 0 (0.0%) |
| Total | 14,424 (88.0%) | 1,957 (11.9%) |
Health Insurance Coverage by Citizenship Status in Bertie County
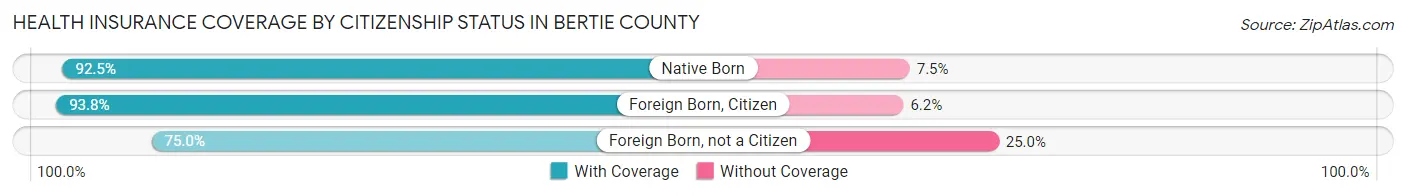
| Citizenship Status | With Coverage | Without Coverage |
| Native Born | 817 (92.5%) | 66 (7.5%) |
| Foreign Born, Citizen | 2,200 (93.8%) | 146 (6.2%) |
| Foreign Born, not a Citizen | 920 (75.0%) | 306 (25.0%) |
Health Insurance Coverage by Household Income in Bertie County
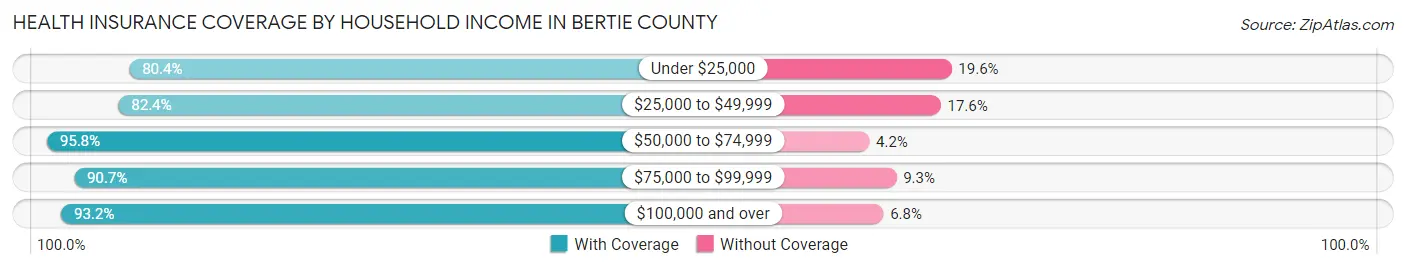
| Household Income | With Coverage | Without Coverage |
| Under $25,000 | 2,904 (80.4%) | 708 (19.6%) |
| $25,000 to $49,999 | 3,185 (82.4%) | 679 (17.6%) |
| $50,000 to $74,999 | 2,958 (95.8%) | 129 (4.2%) |
| $75,000 to $99,999 | 1,656 (90.7%) | 169 (9.3%) |
| $100,000 and over | 3,641 (93.2%) | 267 (6.8%) |
Public vs Private Health Insurance Coverage by Age in Bertie County
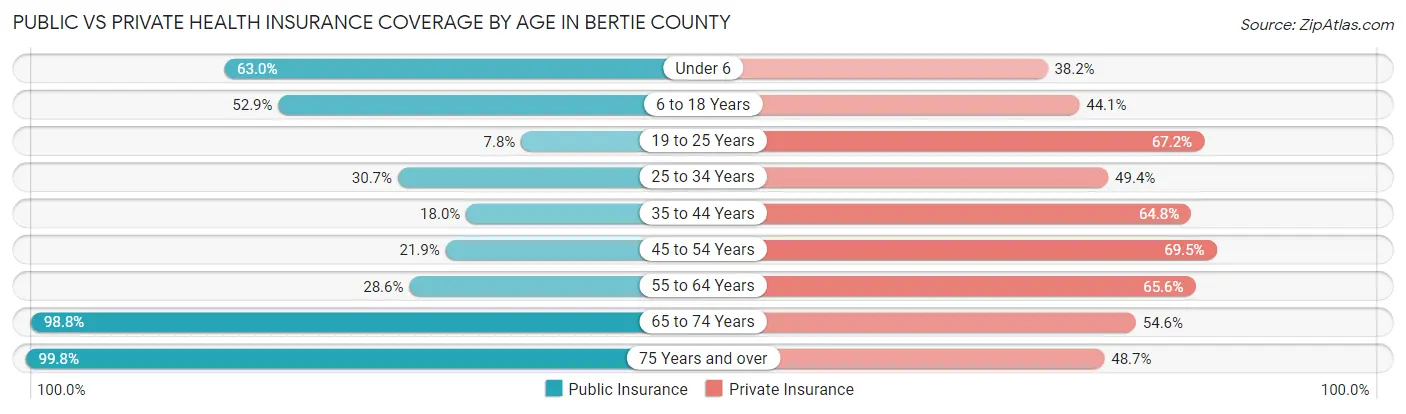
| Age Bracket | Public Insurance | Private Insurance |
| Under 6 | 556 (63.0%) | 337 (38.2%) |
| 6 to 18 Years | 1,241 (52.9%) | 1,034 (44.1%) |
| 19 to 25 Years | 96 (7.8%) | 824 (67.2%) |
| 25 to 34 Years | 522 (30.7%) | 840 (49.4%) |
| 35 to 44 Years | 297 (18.0%) | 1,067 (64.8%) |
| 45 to 54 Years | 422 (21.9%) | 1,342 (69.5%) |
| 55 to 64 Years | 740 (28.6%) | 1,697 (65.6%) |
| 65 to 74 Years | 2,343 (98.8%) | 1,294 (54.6%) |
| 75 Years and over | 1,690 (99.8%) | 825 (48.7%) |
| Total | 7,907 (48.3%) | 9,260 (56.5%) |
Disability Status by Sex by Age in Bertie County
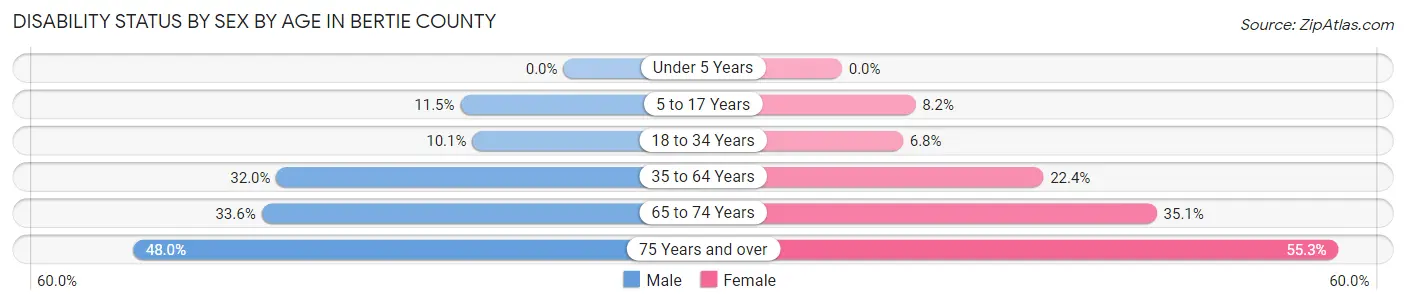
| Age Bracket | Male | Female |
| Under 5 Years | 0 (0.0%) | 0 (0.0%) |
| 5 to 17 Years | 142 (11.5%) | 85 (8.2%) |
| 18 to 34 Years | 176 (10.1%) | 94 (6.8%) |
| 35 to 64 Years | 901 (32.0%) | 750 (22.4%) |
| 65 to 74 Years | 356 (33.6%) | 460 (35.1%) |
| 75 Years and over | 315 (47.9%) | 573 (55.3%) |
Disability Class by Sex by Age in Bertie County
Disability Class: Hearing Difficulty
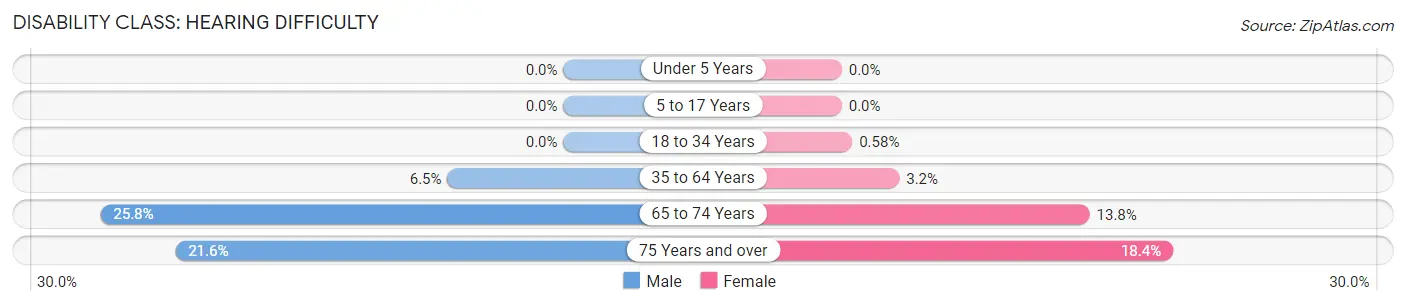
| Age Bracket | Male | Female |
| Under 5 Years | 0 (0.0%) | 0 (0.0%) |
| 5 to 17 Years | 0 (0.0%) | 0 (0.0%) |
| 18 to 34 Years | 0 (0.0%) | 8 (0.6%) |
| 35 to 64 Years | 182 (6.5%) | 107 (3.2%) |
| 65 to 74 Years | 273 (25.8%) | 181 (13.8%) |
| 75 Years and over | 142 (21.6%) | 191 (18.4%) |
Disability Class: Vision Difficulty
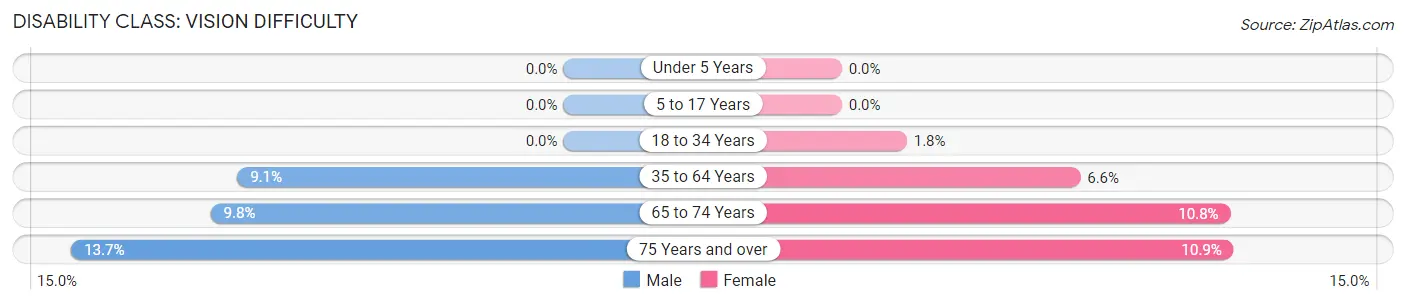
| Age Bracket | Male | Female |
| Under 5 Years | 0 (0.0%) | 0 (0.0%) |
| 5 to 17 Years | 0 (0.0%) | 0 (0.0%) |
| 18 to 34 Years | 0 (0.0%) | 25 (1.8%) |
| 35 to 64 Years | 256 (9.1%) | 222 (6.6%) |
| 65 to 74 Years | 104 (9.8%) | 142 (10.8%) |
| 75 Years and over | 90 (13.7%) | 113 (10.9%) |
Disability Class: Cognitive Difficulty
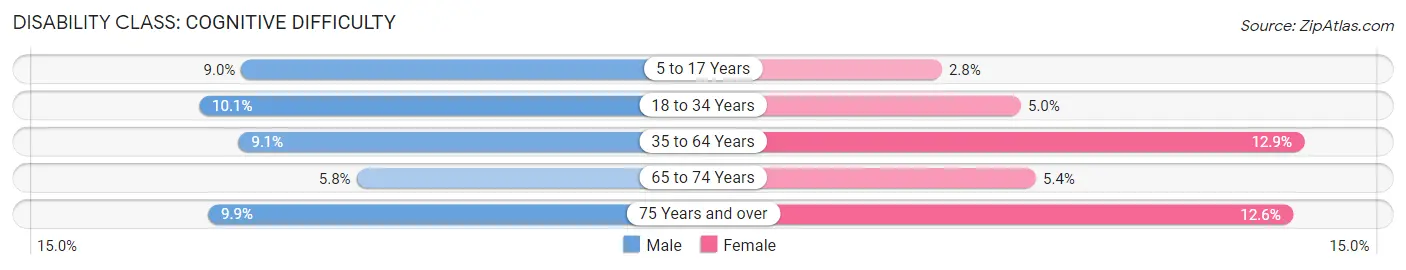
| Age Bracket | Male | Female |
| 5 to 17 Years | 111 (9.0%) | 29 (2.8%) |
| 18 to 34 Years | 176 (10.1%) | 69 (5.0%) |
| 35 to 64 Years | 255 (9.0%) | 430 (12.9%) |
| 65 to 74 Years | 61 (5.8%) | 71 (5.4%) |
| 75 Years and over | 65 (9.9%) | 130 (12.6%) |
Disability Class: Ambulatory Difficulty
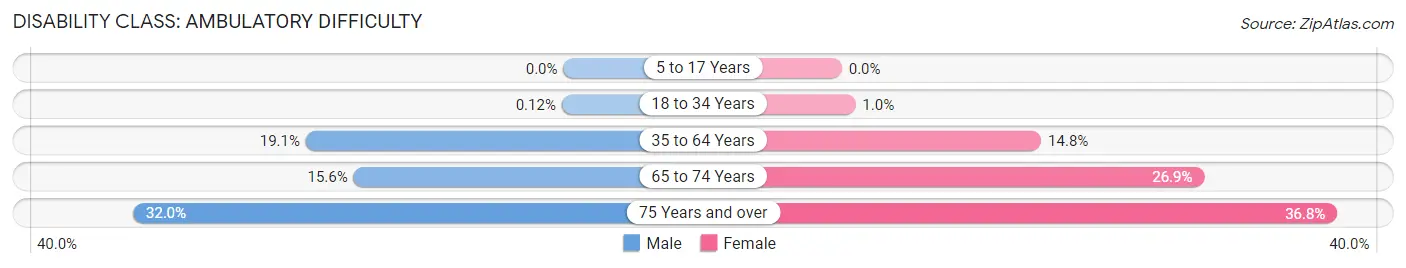
| Age Bracket | Male | Female |
| 5 to 17 Years | 0 (0.0%) | 0 (0.0%) |
| 18 to 34 Years | 2 (0.1%) | 14 (1.0%) |
| 35 to 64 Years | 539 (19.1%) | 495 (14.8%) |
| 65 to 74 Years | 165 (15.6%) | 353 (26.9%) |
| 75 Years and over | 210 (32.0%) | 381 (36.8%) |
Disability Class: Self-Care Difficulty
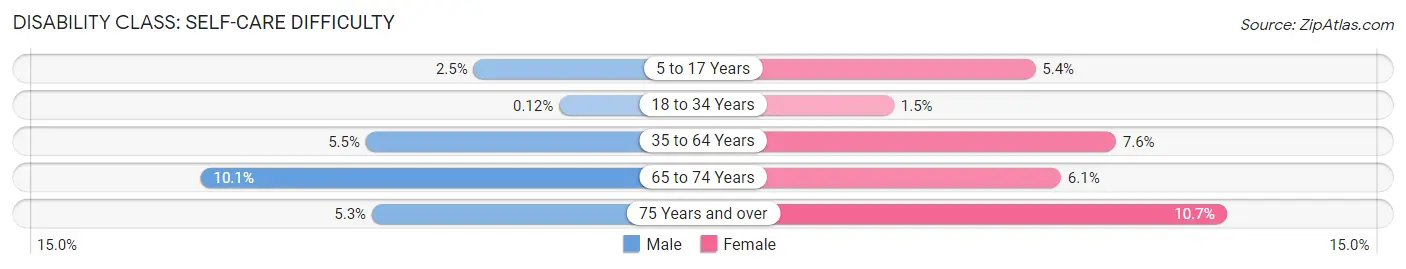
| Age Bracket | Male | Female |
| 5 to 17 Years | 31 (2.5%) | 56 (5.4%) |
| 18 to 34 Years | 2 (0.1%) | 20 (1.5%) |
| 35 to 64 Years | 155 (5.5%) | 255 (7.6%) |
| 65 to 74 Years | 107 (10.1%) | 80 (6.1%) |
| 75 Years and over | 35 (5.3%) | 111 (10.7%) |
Technology Access in Bertie County
Computing Device Access in Bertie County
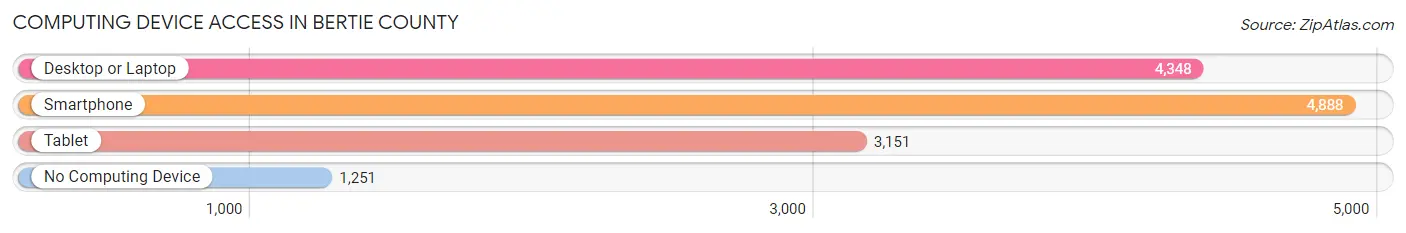
| Device Type | # Households | % Households |
| Desktop or Laptop | 4,348 | 62.3% |
| Smartphone | 4,888 | 70.0% |
| Tablet | 3,151 | 45.1% |
| No Computing Device | 1,251 | 17.9% |
| Total | 6,984 | 100.0% |
Internet Access in Bertie County
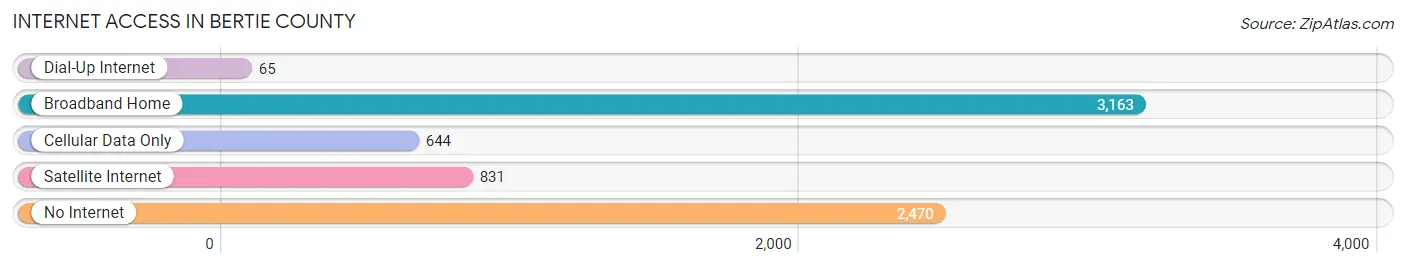
| Internet Type | # Households | % Households |
| Dial-Up Internet | 65 | 0.9% |
| Broadband Home | 3,163 | 45.3% |
| Cellular Data Only | 644 | 9.2% |
| Satellite Internet | 831 | 11.9% |
| No Internet | 2,470 | 35.4% |
| Total | 6,984 | 100.0% |
Bertie County Summary
Bertie County is located in the northeastern part of North Carolina, and is bordered by the Chowan River to the east, the Roanoke River to the west, and the Albemarle Sound to the north. The county seat is Windsor, and the county is part of the Roanoke-Chowan Statistical Area. As of the 2010 census, the population of Bertie County was 21,282.
Geography
Bertie County is located in the northeastern part of North Carolina, and is bordered by the Chowan River to the east, the Roanoke River to the west, and the Albemarle Sound to the north. The county is approximately 545 square miles in size, and is divided into four townships: Askewville, Colerain, Powellsville, and Windsor. The county is mostly flat, with some rolling hills in the western part of the county. The terrain is mostly sandy loam, with some clay and sandy soils. The county is drained by the Chowan River, which flows through the eastern part of the county, and the Roanoke River, which flows through the western part of the county.
History
Bertie County was formed in 1722 from the remnants of Chowan County. The county was named after James Bertie, the Earl of Abingdon. The county was originally inhabited by the Tuscarora Indians, who were later displaced by European settlers. The county was an important center of trade and commerce in the colonial era, and was home to several prominent families, including the Blounts, the Byrds, and the Corbetts.
During the American Revolution, Bertie County was the site of several battles, including the Battle of Elizabethtown and the Battle of Fort Anderson. After the war, the county experienced a period of economic growth, with the development of the lumber and naval stores industries. The county also became an important center of education, with the establishment of several schools, including the Bertie Academy and the Windsor Academy.
Economy
Bertie County’s economy is largely based on agriculture, with the county’s main crops being corn, soybeans, cotton, and tobacco. The county is also home to several manufacturing companies, including a furniture factory, a paper mill, and a textile mill. The county is also home to several tourist attractions, including the Roanoke River Lighthouse, the Bertie County Historical Museum, and the Roanoke River National Wildlife Refuge.
Demographics
As of the 2010 census, the population of Bertie County was 21,282. The population is predominantly African American, with the majority of the population (77.3%) being African American. The median household income in the county is $30,945, and the median age is 38.7 years. The county has a poverty rate of 28.3%, and the unemployment rate is 8.2%.
Conclusion
Bertie County is a rural county located in the northeastern part of North Carolina. The county is largely agricultural, with the main crops being corn, soybeans, cotton, and tobacco. The county is also home to several manufacturing companies, and is an important center of education. The population of the county is predominantly African American, and the median household income is $30,945. The county has a poverty rate of 28.3%, and the unemployment rate is 8.2%.
Common Questions
What is Per Capita Income in Bertie County?
Per Capita income in Bertie County is $27,311.
What is the Median Family Income in Bertie County?
Median Family Income in Bertie County is $59,840.
What is the Median Household income in Bertie County?
Median Household Income in Bertie County is $41,652.
What is Income or Wage Gap in Bertie County?
Income or Wage Gap in Bertie County is 12.4%.
Women in Bertie County earn 87.6 cents for every dollar earned by a man.
What is Family Income Deficit in Bertie County?
Family Income Deficit in Bertie County is $7,123.
Families that are below poverty line in Bertie County earn $7,123 less on average than the poverty threshold level.
What is Inequality or Gini Index in Bertie County?
Inequality or Gini Index in Bertie County is 0.54.
What is the Total Population of Bertie County?
Total Population of Bertie County is 17,818.
What is the Total Male Population of Bertie County?
Total Male Population of Bertie County is 9,227.
What is the Total Female Population of Bertie County?
Total Female Population of Bertie County is 8,591.
What is the Ratio of Males per 100 Females in Bertie County?
There are 107.40 Males per 100 Females in Bertie County.
What is the Ratio of Females per 100 Males in Bertie County?
There are 93.11 Females per 100 Males in Bertie County.
What is the Median Population Age in Bertie County?
Median Population Age in Bertie County is 45.9 Years.
What is the Average Family Size in Bertie County
Average Family Size in Bertie County is 3.1 People.
What is the Average Household Size in Bertie County
Average Household Size in Bertie County is 2.3 People.
How Large is the Labor Force in Bertie County?
There are 6,745 People in the Labor Forcein in Bertie County.
What is the Percentage of People in the Labor Force in Bertie County?
44.4% of People are in the Labor Force in Bertie County.
What is the Unemployment Rate in Bertie County?
Unemployment Rate in Bertie County is 6.4%.