Ashe County, NC Map & Demographics
Ashe County Overview
$29,683
PER CAPITA INCOME
$62,380
AVG FAMILY INCOME
$49,176
AVG HOUSEHOLD INCOME
17.9%
WAGE / INCOME GAP [ % ]
82.1¢/ $1
WAGE / INCOME GAP [ $ ]
$8,997
FAMILY INCOME DEFICIT
0.44
INEQUALITY / GINI INDEX
26,759
TOTAL POPULATION
13,254
MALE POPULATION
13,505
FEMALE POPULATION
98.14
MALES / 100 FEMALES
101.89
FEMALES / 100 MALES
49.6
MEDIAN AGE
2.7
AVG FAMILY SIZE
2.2
AVG HOUSEHOLD SIZE
12,362
LABOR FORCE [ PEOPLE ]
54.0%
PERCENT IN LABOR FORCE
5.1%
UNEMPLOYMENT RATE
Ashe County Area Codes
Income in Ashe County
Income Overview in Ashe County
Per Capita Income in Ashe County is $29,683, while median incomes of families and households are $62,380 and $49,176 respectively.
| Characteristic | Number | Measure |
| Per Capita Income | 26,759 | $29,683 |
| Median Family Income | 8,018 | $62,380 |
| Mean Family Income | 8,018 | $76,837 |
| Median Household Income | 11,823 | $49,176 |
| Mean Household Income | 11,823 | $64,973 |
| Income Deficit | 8,018 | $8,997 |
| Wage / Income Gap (%) | 26,759 | 17.93% |
| Wage / Income Gap ($) | 26,759 | 82.07¢ per $1 |
| Gini / Inequality Index | 26,759 | 0.44 |
Earnings by Sex in Ashe County
Average Earnings in Ashe County are $32,838, $35,609 for men and $29,225 for women, a difference of 17.9%.
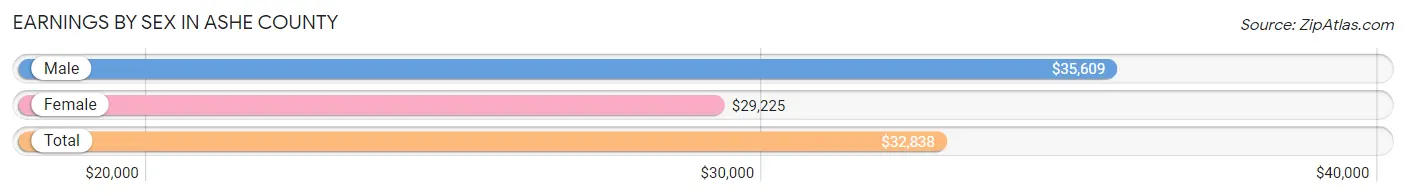
| Sex | Number | Average Earnings |
| Male | 7,086 (54.0%) | $35,609 |
| Female | 6,041 (46.0%) | $29,225 |
| Total | 13,127 (100.0%) | $32,838 |
Earnings by Sex by Income Bracket in Ashe County
The most common earnings brackets in Ashe County are $30,000 to $34,999 for men (745 | 10.5%) and $30,000 to $34,999 for women (668 | 11.1%).
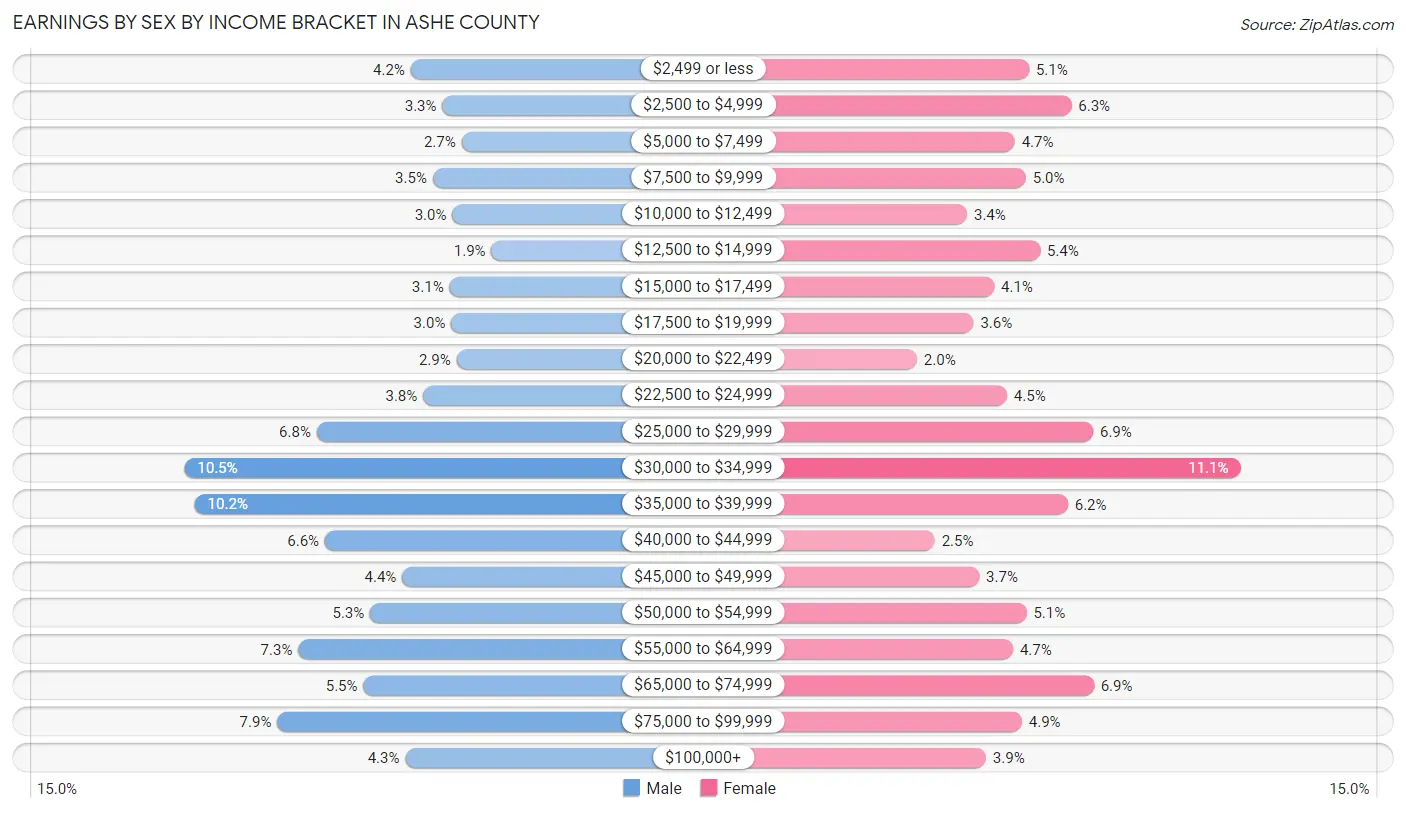
| Income | Male | Female |
| $2,499 or less | 294 (4.2%) | 309 (5.1%) |
| $2,500 to $4,999 | 231 (3.3%) | 381 (6.3%) |
| $5,000 to $7,499 | 193 (2.7%) | 285 (4.7%) |
| $7,500 to $9,999 | 250 (3.5%) | 304 (5.0%) |
| $10,000 to $12,499 | 211 (3.0%) | 204 (3.4%) |
| $12,500 to $14,999 | 133 (1.9%) | 328 (5.4%) |
| $15,000 to $17,499 | 217 (3.1%) | 250 (4.1%) |
| $17,500 to $19,999 | 213 (3.0%) | 215 (3.6%) |
| $20,000 to $22,499 | 203 (2.9%) | 119 (2.0%) |
| $22,500 to $24,999 | 269 (3.8%) | 272 (4.5%) |
| $25,000 to $29,999 | 481 (6.8%) | 418 (6.9%) |
| $30,000 to $34,999 | 745 (10.5%) | 668 (11.1%) |
| $35,000 to $39,999 | 724 (10.2%) | 375 (6.2%) |
| $40,000 to $44,999 | 465 (6.6%) | 149 (2.5%) |
| $45,000 to $49,999 | 311 (4.4%) | 225 (3.7%) |
| $50,000 to $54,999 | 375 (5.3%) | 305 (5.1%) |
| $55,000 to $64,999 | 518 (7.3%) | 282 (4.7%) |
| $65,000 to $74,999 | 388 (5.5%) | 419 (6.9%) |
| $75,000 to $99,999 | 560 (7.9%) | 297 (4.9%) |
| $100,000+ | 305 (4.3%) | 236 (3.9%) |
| Total | 7,086 (100.0%) | 6,041 (100.0%) |
Earnings by Sex by Educational Attainment in Ashe County
Average earnings in Ashe County are $38,039 for men and $31,769 for women, a difference of 16.5%. Men with an educational attainment of graduate degree enjoy the highest average annual earnings of $66,313, while those with less than high school education earn the least with $31,917. Women with an educational attainment of graduate degree earn the most with the average annual earnings of $62,250, while those with high school diploma education have the smallest earnings of $22,361.
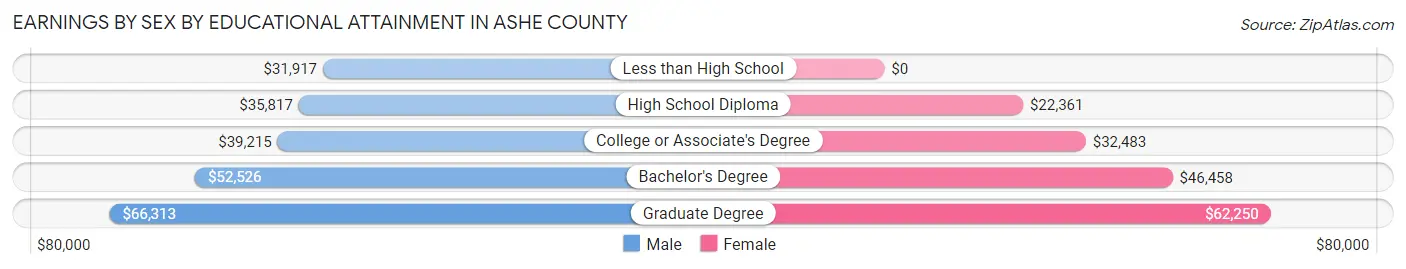
| Educational Attainment | Male Income | Female Income |
| Less than High School | $31,917 | $0 |
| High School Diploma | $35,817 | $22,361 |
| College or Associate's Degree | $39,215 | $32,483 |
| Bachelor's Degree | $52,526 | $46,458 |
| Graduate Degree | $66,313 | $62,250 |
| Total | $38,039 | $31,769 |
Family Income in Ashe County
Family Income Brackets in Ashe County
According to the Ashe County family income data, there are 1,836 families falling into the $50,000 to $74,999 income range, which is the most common income bracket and makes up 22.9% of all families. Conversely, the $10,000 to $14,999 income bracket is the least frequent group with only 96 families (1.2%) belonging to this category.
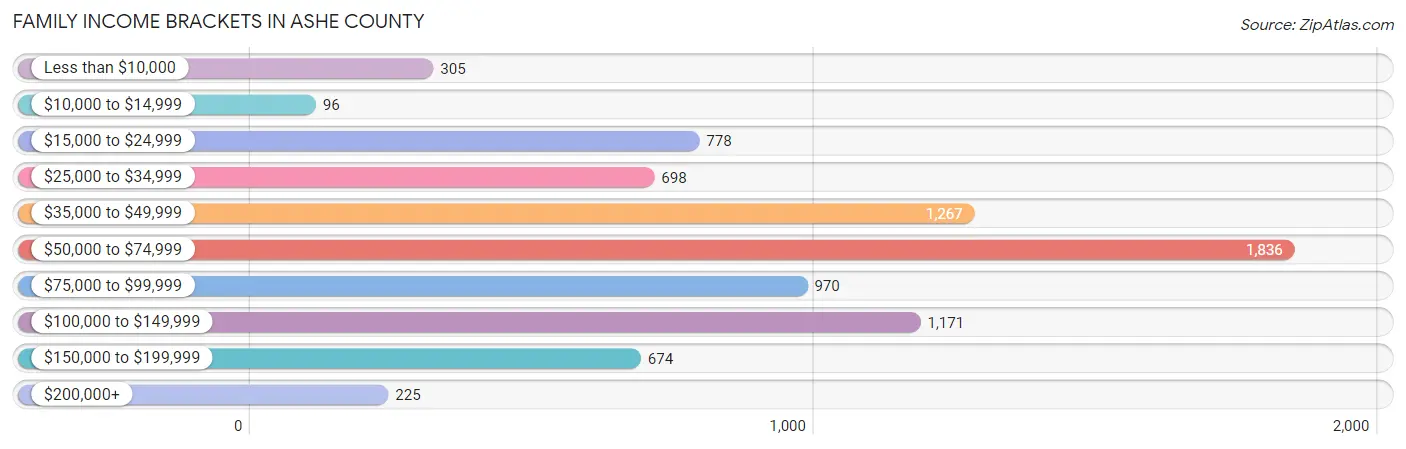
| Income Bracket | # Families | % Families |
| Less than $10,000 | 305 | 3.8% |
| $10,000 to $14,999 | 96 | 1.2% |
| $15,000 to $24,999 | 778 | 9.7% |
| $25,000 to $34,999 | 698 | 8.7% |
| $35,000 to $49,999 | 1,267 | 15.8% |
| $50,000 to $74,999 | 1,836 | 22.9% |
| $75,000 to $99,999 | 970 | 12.1% |
| $100,000 to $149,999 | 1,171 | 14.6% |
| $150,000 to $199,999 | 674 | 8.4% |
| $200,000+ | 225 | 2.8% |
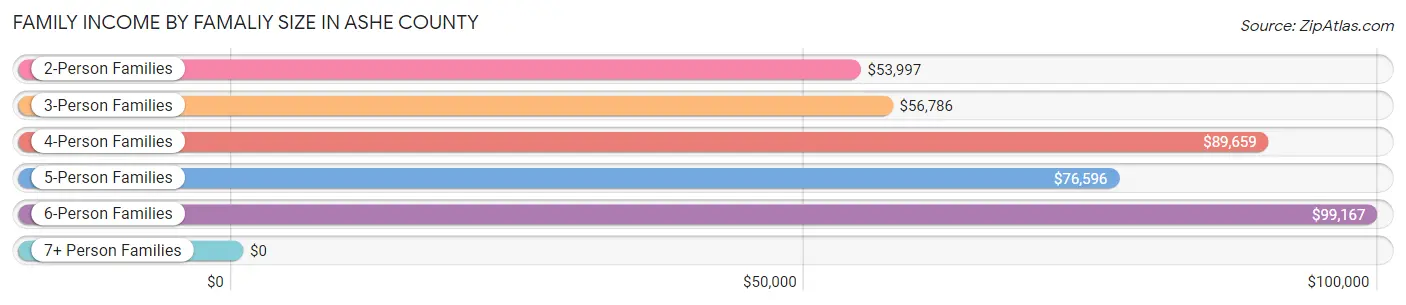
Family Income by Famaliy Size in Ashe County
6-person families (60 | 0.7%) account for the highest median family income in Ashe County with $99,167 per family, while 2-person families (5,073 | 63.3%) have the highest median income of $26,998 per family member.
| Income Bracket | # Families | Median Income |
| 2-Person Families | 5,073 (63.3%) | $53,997 |
| 3-Person Families | 1,274 (15.9%) | $56,786 |
| 4-Person Families | 1,038 (13.0%) | $89,659 |
| 5-Person Families | 500 (6.2%) | $76,596 |
| 6-Person Families | 60 (0.7%) | $99,167 |
| 7+ Person Families | 73 (0.9%) | $0 |
| Total | 8,018 (100.0%) | $62,380 |
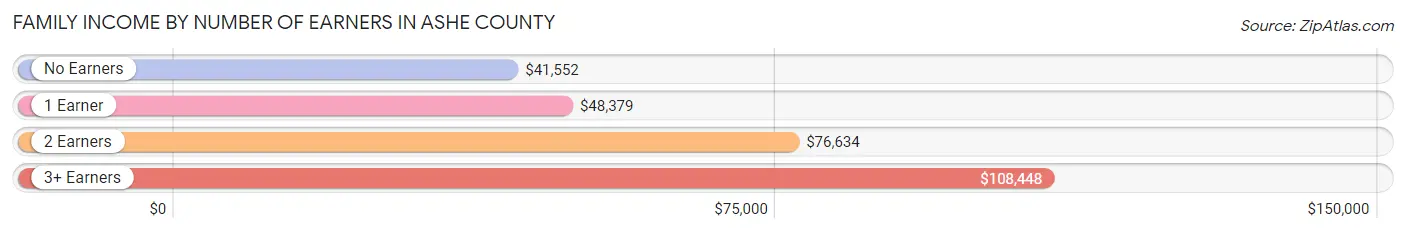
Family Income by Number of Earners in Ashe County
The median family income in Ashe County is $62,380, with families comprising 3+ earners (640) having the highest median family income of $108,448, while families with no earners (1,962) have the lowest median family income of $41,552, accounting for 8.0% and 24.5% of families, respectively.
| Number of Earners | # Families | Median Income |
| No Earners | 1,962 (24.5%) | $41,552 |
| 1 Earner | 2,463 (30.7%) | $48,379 |
| 2 Earners | 2,953 (36.8%) | $76,634 |
| 3+ Earners | 640 (8.0%) | $108,448 |
| Total | 8,018 (100.0%) | $62,380 |
Household Income in Ashe County
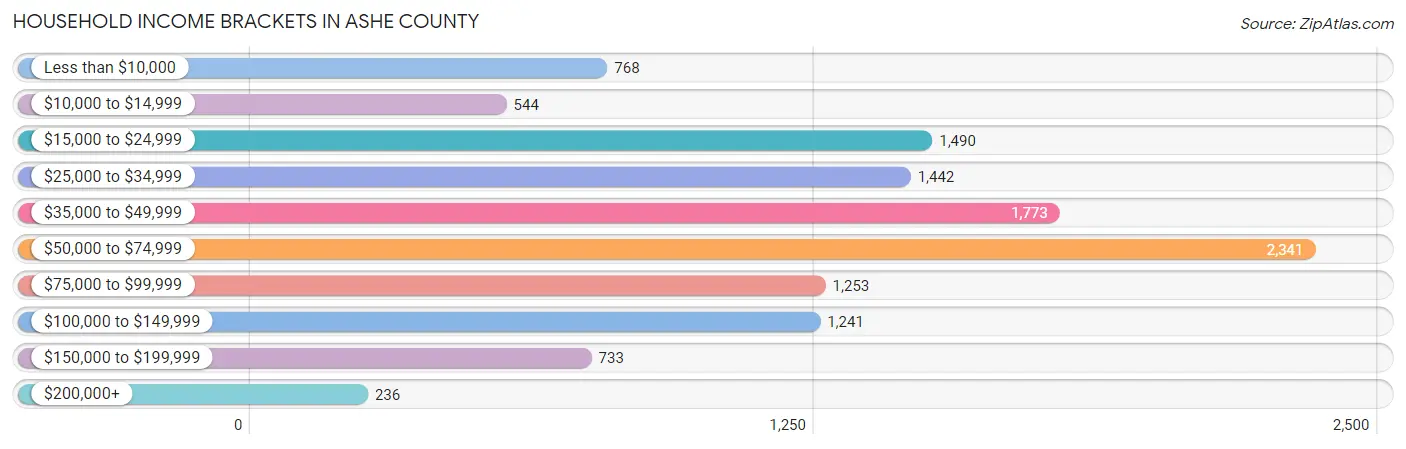
Household Income Brackets in Ashe County
With 2,341 households falling in the category, the $50,000 to $74,999 income range is the most frequent in Ashe County, accounting for 19.8% of all households. In contrast, only 236 households (2.0%) fall into the $200,000+ income bracket, making it the least populous group.
| Income Bracket | # Households | % Households |
| Less than $10,000 | 768 | 6.5% |
| $10,000 to $14,999 | 544 | 4.6% |
| $15,000 to $24,999 | 1,490 | 12.6% |
| $25,000 to $34,999 | 1,442 | 12.2% |
| $35,000 to $49,999 | 1,773 | 15.0% |
| $50,000 to $74,999 | 2,341 | 19.8% |
| $75,000 to $99,999 | 1,253 | 10.6% |
| $100,000 to $149,999 | 1,241 | 10.5% |
| $150,000 to $199,999 | 733 | 6.2% |
| $200,000+ | 236 | 2.0% |
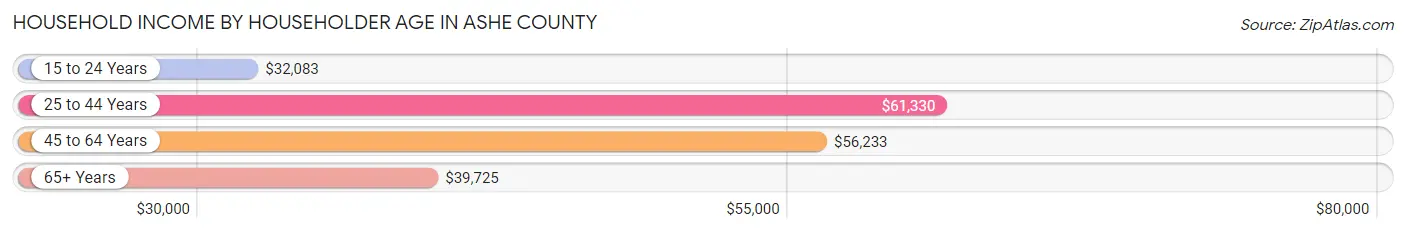
Household Income by Householder Age in Ashe County
The median household income in Ashe County is $49,176, with the highest median household income of $61,330 found in the 25 to 44 years age bracket for the primary householder. A total of 2,430 households (20.5%) fall into this category. Meanwhile, the 15 to 24 years age bracket for the primary householder has the lowest median household income of $32,083, with 317 households (2.7%) in this group.
| Income Bracket | # Households | Median Income |
| 15 to 24 Years | 317 (2.7%) | $32,083 |
| 25 to 44 Years | 2,430 (20.5%) | $61,330 |
| 45 to 64 Years | 4,665 (39.5%) | $56,233 |
| 65+ Years | 4,411 (37.3%) | $39,725 |
| Total | 11,823 (100.0%) | $49,176 |
Poverty in Ashe County
Income Below Poverty by Sex and Age in Ashe County
With 12.9% poverty level for males and 15.3% for females among the residents of Ashe County, 18 to 24 year old males and 5 year old females are the most vulnerable to poverty, with 271 males (30.3%) and 35 females (43.8%) in their respective age groups living below the poverty level.
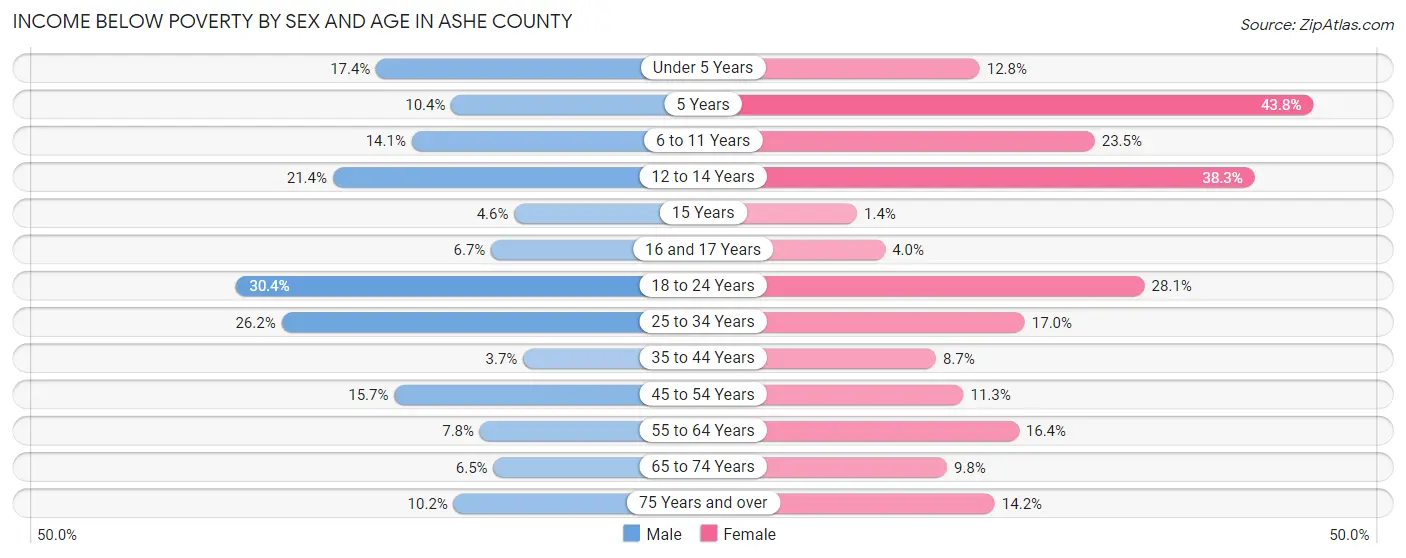
| Age Bracket | Male | Female |
| Under 5 Years | 103 (17.4%) | 57 (12.8%) |
| 5 Years | 13 (10.4%) | 35 (43.8%) |
| 6 to 11 Years | 124 (14.1%) | 143 (23.5%) |
| 12 to 14 Years | 52 (21.4%) | 226 (38.3%) |
| 15 Years | 6 (4.5%) | 2 (1.4%) |
| 16 and 17 Years | 24 (6.7%) | 12 (4.0%) |
| 18 to 24 Years | 271 (30.3%) | 226 (28.1%) |
| 25 to 34 Years | 355 (26.2%) | 237 (17.0%) |
| 35 to 44 Years | 56 (3.7%) | 123 (8.7%) |
| 45 to 54 Years | 275 (15.7%) | 183 (11.3%) |
| 55 to 64 Years | 163 (7.7%) | 362 (16.4%) |
| 65 to 74 Years | 130 (6.5%) | 208 (9.8%) |
| 75 Years and over | 122 (10.2%) | 226 (14.2%) |
| Total | 1,694 (12.9%) | 2,040 (15.3%) |
Income Above Poverty by Sex and Age in Ashe County
According to the poverty statistics in Ashe County, males aged 35 to 44 years and females aged 15 years are the age groups that are most secure financially, with 96.3% of males and 98.6% of females in these age groups living above the poverty line.
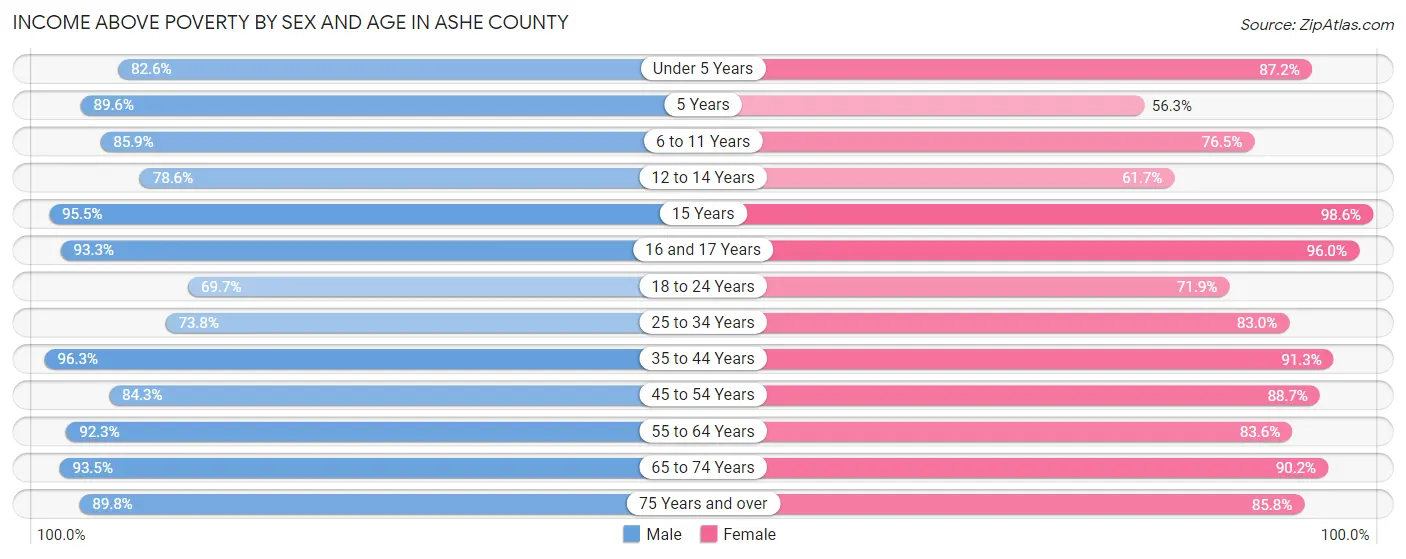
| Age Bracket | Male | Female |
| Under 5 Years | 490 (82.6%) | 388 (87.2%) |
| 5 Years | 112 (89.6%) | 45 (56.2%) |
| 6 to 11 Years | 757 (85.9%) | 466 (76.5%) |
| 12 to 14 Years | 191 (78.6%) | 364 (61.7%) |
| 15 Years | 126 (95.5%) | 139 (98.6%) |
| 16 and 17 Years | 334 (93.3%) | 286 (96.0%) |
| 18 to 24 Years | 622 (69.7%) | 578 (71.9%) |
| 25 to 34 Years | 1,002 (73.8%) | 1,158 (83.0%) |
| 35 to 44 Years | 1,445 (96.3%) | 1,284 (91.3%) |
| 45 to 54 Years | 1,478 (84.3%) | 1,436 (88.7%) |
| 55 to 64 Years | 1,941 (92.2%) | 1,841 (83.6%) |
| 65 to 74 Years | 1,872 (93.5%) | 1,920 (90.2%) |
| 75 Years and over | 1,077 (89.8%) | 1,364 (85.8%) |
| Total | 11,447 (87.1%) | 11,269 (84.7%) |
Income Below Poverty Among Married-Couple Families in Ashe County
The poverty statistics for married-couple families in Ashe County show that 5.0% or 319 of the total 6,401 families live below the poverty line. Families with 1 or 2 children have the highest poverty rate of 10.4%, comprising of 140 families. On the other hand, families with 3 or 4 children have the lowest poverty rate of 0.9%, which includes 4 families.
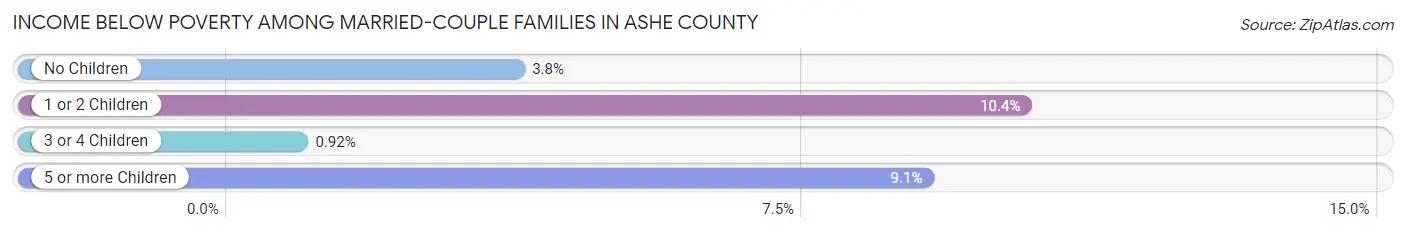
| Children | Above Poverty | Below Poverty |
| No Children | 4,413 (96.3%) | 172 (3.7%) |
| 1 or 2 Children | 1,210 (89.6%) | 140 (10.4%) |
| 3 or 4 Children | 429 (99.1%) | 4 (0.9%) |
| 5 or more Children | 30 (90.9%) | 3 (9.1%) |
| Total | 6,082 (95.0%) | 319 (5.0%) |
Income Below Poverty Among Single-Parent Households in Ashe County
According to the poverty data in Ashe County, 16.3% or 69 single-father households and 35.6% or 425 single-mother households are living below the poverty line. Among single-father households, those with 3 or 4 children have the highest poverty rate, with 27 households (100.0%) experiencing poverty. Likewise, among single-mother households, those with 1 or 2 children have the highest poverty rate, with 308 households (50.7%) falling below the poverty line.
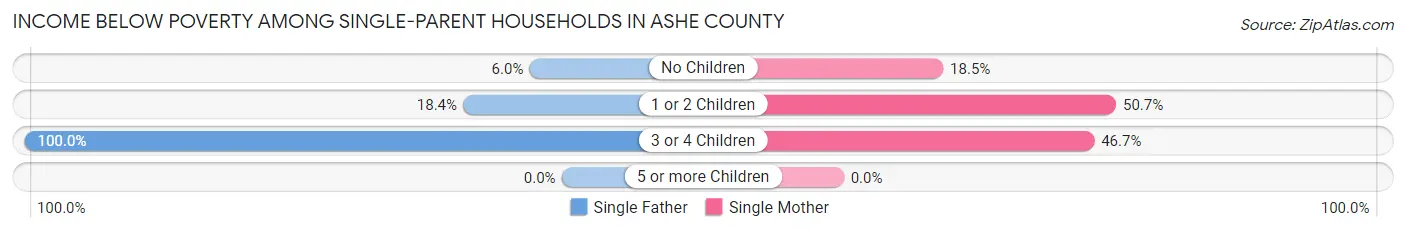
| Children | Single Father | Single Mother |
| No Children | 15 (6.0%) | 103 (18.5%) |
| 1 or 2 Children | 27 (18.4%) | 308 (50.7%) |
| 3 or 4 Children | 27 (100.0%) | 14 (46.7%) |
| 5 or more Children | 0 (0.0%) | 0 (0.0%) |
| Total | 69 (16.3%) | 425 (35.6%) |
Income Below Poverty Among Married-Couple vs Single-Parent Households in Ashe County
The poverty data for Ashe County shows that 319 of the married-couple family households (5.0%) and 494 of the single-parent households (30.5%) are living below the poverty level. Within the married-couple family households, those with 1 or 2 children have the highest poverty rate, with 140 households (10.4%) falling below the poverty line. Among the single-parent households, those with 3 or 4 children have the highest poverty rate, with 41 household (71.9%) living below poverty.
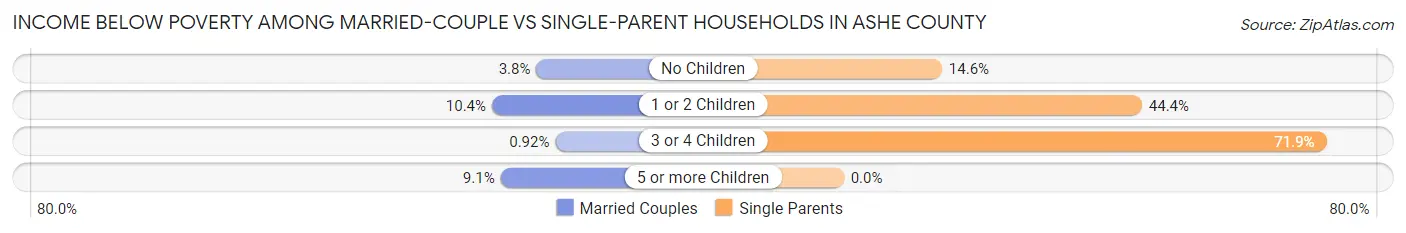
| Children | Married-Couple Families | Single-Parent Households |
| No Children | 172 (3.7%) | 118 (14.6%) |
| 1 or 2 Children | 140 (10.4%) | 335 (44.4%) |
| 3 or 4 Children | 4 (0.9%) | 41 (71.9%) |
| 5 or more Children | 3 (9.1%) | 0 (0.0%) |
| Total | 319 (5.0%) | 494 (30.5%) |
Race in Ashe County
The most populous races in Ashe County are White / Caucasian (25,585 | 95.6%), Hispanic or Latino (1,406 | 5.2%), and Two or more Races (642 | 2.4%).
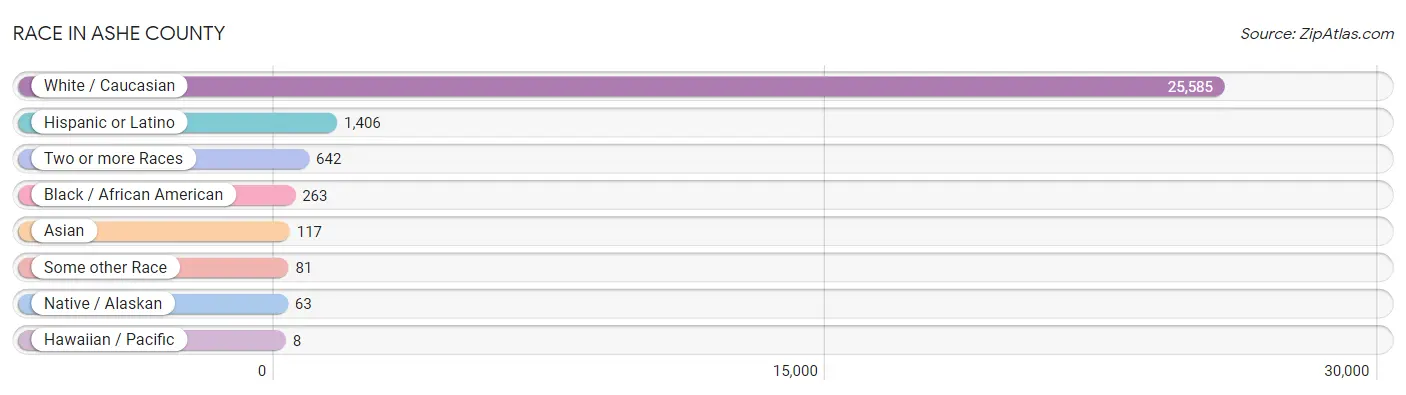
| Race | # Population | % Population |
| Asian | 117 | 0.4% |
| Black / African American | 263 | 1.0% |
| Hawaiian / Pacific | 8 | 0.0% |
| Hispanic or Latino | 1,406 | 5.2% |
| Native / Alaskan | 63 | 0.2% |
| White / Caucasian | 25,585 | 95.6% |
| Two or more Races | 642 | 2.4% |
| Some other Race | 81 | 0.3% |
| Total | 26,759 | 100.0% |
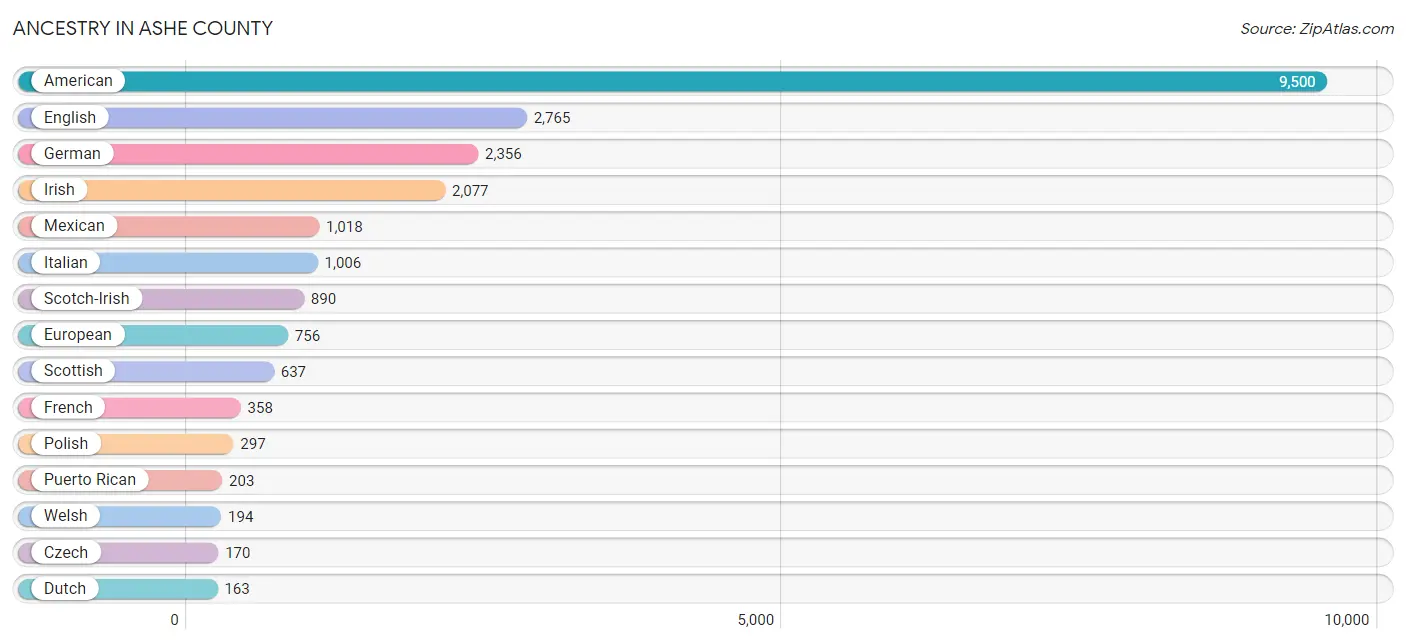
Ancestry in Ashe County
The most populous ancestries reported in Ashe County are American (9,500 | 35.5%), English (2,765 | 10.3%), German (2,356 | 8.8%), Irish (2,077 | 7.8%), and Mexican (1,018 | 3.8%), together accounting for 66.2% of all Ashe County residents.
| Ancestry | # Population | % Population |
| African | 37 | 0.1% |
| American | 9,500 | 35.5% |
| Austrian | 56 | 0.2% |
| Bahamian | 7 | 0.0% |
| Bhutanese | 22 | 0.1% |
| Blackfeet | 14 | 0.1% |
| Brazilian | 45 | 0.2% |
| British | 99 | 0.4% |
| Canadian | 29 | 0.1% |
| Central American | 45 | 0.2% |
| Cherokee | 42 | 0.2% |
| Chickasaw | 9 | 0.0% |
| Chilean | 23 | 0.1% |
| Choctaw | 10 | 0.0% |
| Colombian | 28 | 0.1% |
| Croatian | 10 | 0.0% |
| Cuban | 52 | 0.2% |
| Czech | 170 | 0.6% |
| Czechoslovakian | 38 | 0.1% |
| Danish | 21 | 0.1% |
| Dutch | 163 | 0.6% |
| Eastern European | 129 | 0.5% |
| Ecuadorian | 28 | 0.1% |
| English | 2,765 | 10.3% |
| European | 756 | 2.8% |
| Finnish | 19 | 0.1% |
| French | 358 | 1.3% |
| French Canadian | 56 | 0.2% |
| German | 2,356 | 8.8% |
| Greek | 8 | 0.0% |
| Guamanian / Chamorro | 8 | 0.0% |
| Guatemalan | 33 | 0.1% |
| Honduran | 12 | 0.0% |
| Hungarian | 20 | 0.1% |
| Indian (Asian) | 23 | 0.1% |
| Irish | 2,077 | 7.8% |
| Iroquois | 36 | 0.1% |
| Israeli | 51 | 0.2% |
| Italian | 1,006 | 3.8% |
| Korean | 26 | 0.1% |
| Lithuanian | 23 | 0.1% |
| Lumbee | 45 | 0.2% |
| Mexican | 1,018 | 3.8% |
| Northern European | 50 | 0.2% |
| Norwegian | 70 | 0.3% |
| Polish | 297 | 1.1% |
| Puerto Rican | 203 | 0.8% |
| Romanian | 19 | 0.1% |
| Russian | 51 | 0.2% |
| Scandinavian | 10 | 0.0% |
| Scotch-Irish | 890 | 3.3% |
| Scottish | 637 | 2.4% |
| Slovene | 8 | 0.0% |
| South American | 79 | 0.3% |
| Sri Lankan | 110 | 0.4% |
| Subsaharan African | 37 | 0.1% |
| Swedish | 85 | 0.3% |
| Swiss | 65 | 0.2% |
| Ukrainian | 10 | 0.0% |
| Welsh | 194 | 0.7% | View All 60 Rows |
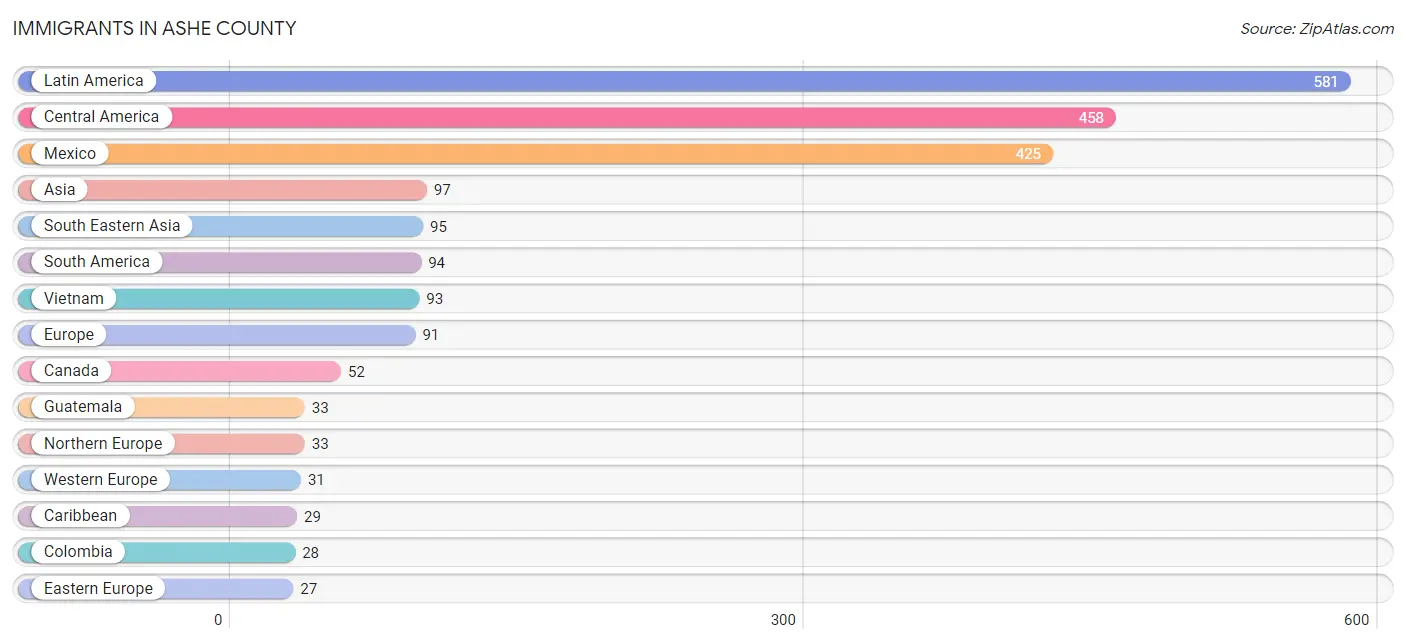
Immigrants in Ashe County
The most numerous immigrant groups reported in Ashe County came from Latin America (581 | 2.2%), Central America (458 | 1.7%), Mexico (425 | 1.6%), Asia (97 | 0.4%), and South Eastern Asia (95 | 0.4%), together accounting for 6.2% of all Ashe County residents.
| Immigration Origin | # Population | % Population |
| Asia | 97 | 0.4% |
| Bahamas | 7 | 0.0% |
| Brazil | 14 | 0.1% |
| Canada | 52 | 0.2% |
| Caribbean | 29 | 0.1% |
| Central America | 458 | 1.7% |
| Chile | 23 | 0.1% |
| Colombia | 28 | 0.1% |
| Cuba | 22 | 0.1% |
| Eastern Asia | 2 | 0.0% |
| Eastern Europe | 27 | 0.1% |
| Ecuador | 21 | 0.1% |
| England | 23 | 0.1% |
| Europe | 91 | 0.3% |
| France | 24 | 0.1% |
| Germany | 7 | 0.0% |
| Guatemala | 33 | 0.1% |
| Guyana | 8 | 0.0% |
| Japan | 2 | 0.0% |
| Latin America | 581 | 2.2% |
| Mexico | 425 | 1.6% |
| Northern Europe | 33 | 0.1% |
| Philippines | 2 | 0.0% |
| Romania | 17 | 0.1% |
| South America | 94 | 0.4% |
| South Eastern Asia | 95 | 0.4% |
| Ukraine | 10 | 0.0% |
| Vietnam | 93 | 0.4% |
| Western Europe | 31 | 0.1% | View All 29 Rows |
Sex and Age in Ashe County
Sex and Age in Ashe County
The most populous age groups in Ashe County are 60 to 64 Years (1,207 | 9.1%) for men and 60 to 64 Years (1,275 | 9.4%) for women.
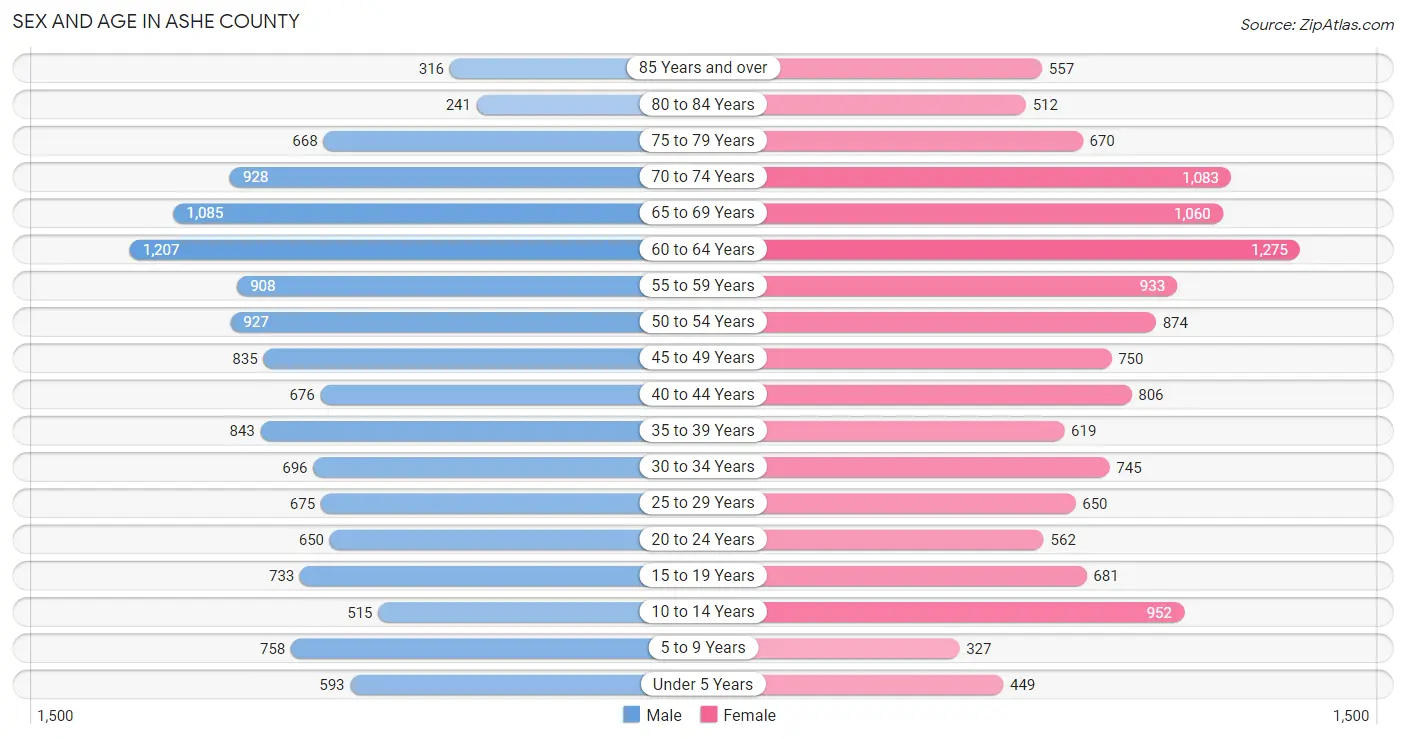
| Age Bracket | Male | Female |
| Under 5 Years | 593 (4.5%) | 449 (3.3%) |
| 5 to 9 Years | 758 (5.7%) | 327 (2.4%) |
| 10 to 14 Years | 515 (3.9%) | 952 (7.0%) |
| 15 to 19 Years | 733 (5.5%) | 681 (5.0%) |
| 20 to 24 Years | 650 (4.9%) | 562 (4.2%) |
| 25 to 29 Years | 675 (5.1%) | 650 (4.8%) |
| 30 to 34 Years | 696 (5.2%) | 745 (5.5%) |
| 35 to 39 Years | 843 (6.4%) | 619 (4.6%) |
| 40 to 44 Years | 676 (5.1%) | 806 (6.0%) |
| 45 to 49 Years | 835 (6.3%) | 750 (5.6%) |
| 50 to 54 Years | 927 (7.0%) | 874 (6.5%) |
| 55 to 59 Years | 908 (6.9%) | 933 (6.9%) |
| 60 to 64 Years | 1,207 (9.1%) | 1,275 (9.4%) |
| 65 to 69 Years | 1,085 (8.2%) | 1,060 (7.9%) |
| 70 to 74 Years | 928 (7.0%) | 1,083 (8.0%) |
| 75 to 79 Years | 668 (5.0%) | 670 (5.0%) |
| 80 to 84 Years | 241 (1.8%) | 512 (3.8%) |
| 85 Years and over | 316 (2.4%) | 557 (4.1%) |
| Total | 13,254 (100.0%) | 13,505 (100.0%) |
Families and Households in Ashe County
Median Family Size in Ashe County
The median family size in Ashe County is 2.69 persons per family, with married-couple families (6,401 | 79.8%) accounting for the largest median family size of 2.76 persons per family. On the other hand, single male/father families (424 | 5.3%) represent the smallest median family size with 2.32 persons per family.
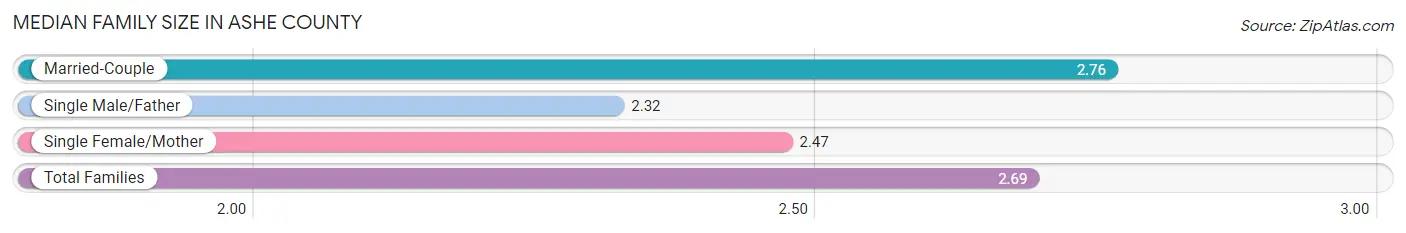
| Family Type | # Families | Family Size |
| Married-Couple | 6,401 (79.8%) | 2.76 |
| Single Male/Father | 424 (5.3%) | 2.32 |
| Single Female/Mother | 1,193 (14.9%) | 2.47 |
| Total Families | 8,018 (100.0%) | 2.69 |
Median Household Size in Ashe County
The median household size in Ashe County is 2.23 persons per household, with married-couple households (6,401 | 54.1%) accounting for the largest median household size of 2.76 persons per household. non-family households (3,805 | 32.2%) represent the smallest median household size with 1.17 persons per household.
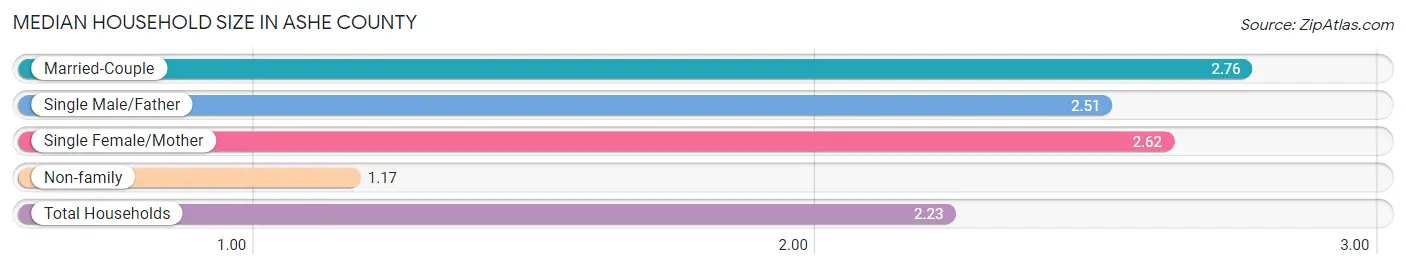
| Household Type | # Households | Household Size |
| Married-Couple | 6,401 (54.1%) | 2.76 |
| Single Male/Father | 424 (3.6%) | 2.51 |
| Single Female/Mother | 1,193 (10.1%) | 2.62 |
| Non-family | 3,805 (32.2%) | 1.17 |
| Total Households | 11,823 (100.0%) | 2.23 |
Household Size by Marriage Status in Ashe County
Out of a total of 11,823 households in Ashe County, 8,018 (67.8%) are family households, while 3,805 (32.2%) are nonfamily households. The most numerous type of family households are 2-person households, comprising 4,927, and the most common type of nonfamily households are 1-person households, comprising 3,369.
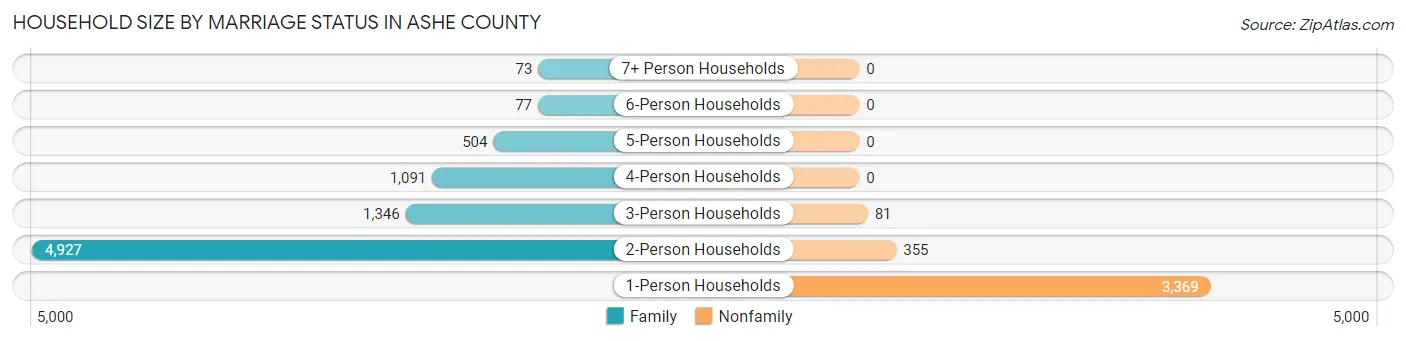
| Household Size | Family Households | Nonfamily Households |
| 1-Person Households | - | 3,369 (28.5%) |
| 2-Person Households | 4,927 (41.7%) | 355 (3.0%) |
| 3-Person Households | 1,346 (11.4%) | 81 (0.7%) |
| 4-Person Households | 1,091 (9.2%) | 0 (0.0%) |
| 5-Person Households | 504 (4.3%) | 0 (0.0%) |
| 6-Person Households | 77 (0.6%) | 0 (0.0%) |
| 7+ Person Households | 73 (0.6%) | 0 (0.0%) |
| Total | 8,018 (67.8%) | 3,805 (32.2%) |
Female Fertility in Ashe County
Fertility by Age in Ashe County
Average fertility rate in Ashe County is 54.0 births per 1,000 women. Women in the age bracket of 20 to 34 years have the highest fertility rate with 128.0 births per 1,000 women. Women in the age bracket of 20 to 34 years acount for 91.9% of all women with births.
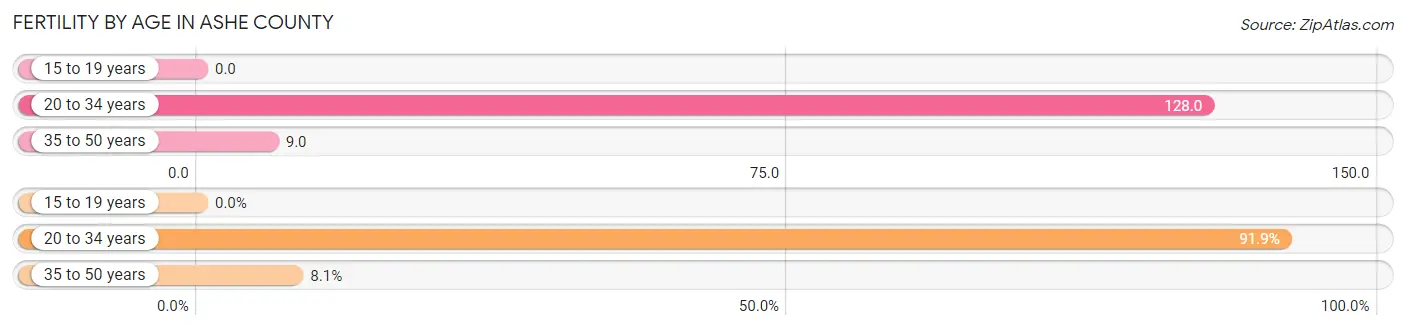
| Age Bracket | Women with Births | Births / 1,000 Women |
| 15 to 19 years | 0 (0.0%) | 0.0 |
| 20 to 34 years | 250 (91.9%) | 128.0 |
| 35 to 50 years | 22 (8.1%) | 9.0 |
| Total | 272 (100.0%) | 54.0 |
Fertility by Age by Marriage Status in Ashe County
70.2% of women with births (272) in Ashe County are married. The highest percentage of unmarried women with births falls into 20 to 34 years age bracket with 32.4% of them unmarried at the time of birth, while the lowest percentage of unmarried women with births belong to 35 to 50 years age bracket with 0.0% of them unmarried.
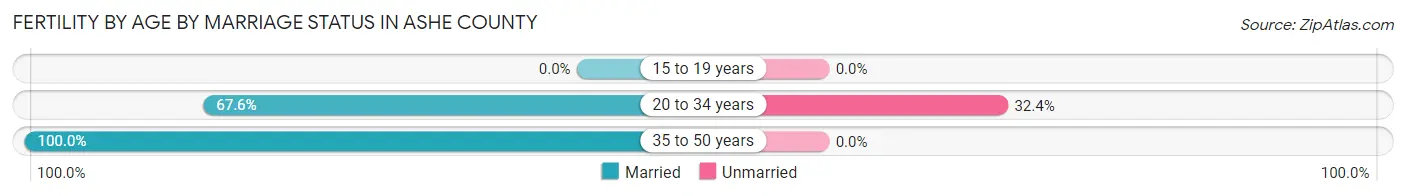
| Age Bracket | Married | Unmarried |
| 15 to 19 years | 0 (0.0%) | 0 (0.0%) |
| 20 to 34 years | 169 (67.6%) | 81 (32.4%) |
| 35 to 50 years | 22 (100.0%) | 0 (0.0%) |
| Total | 191 (70.2%) | 81 (29.8%) |
Fertility by Education in Ashe County
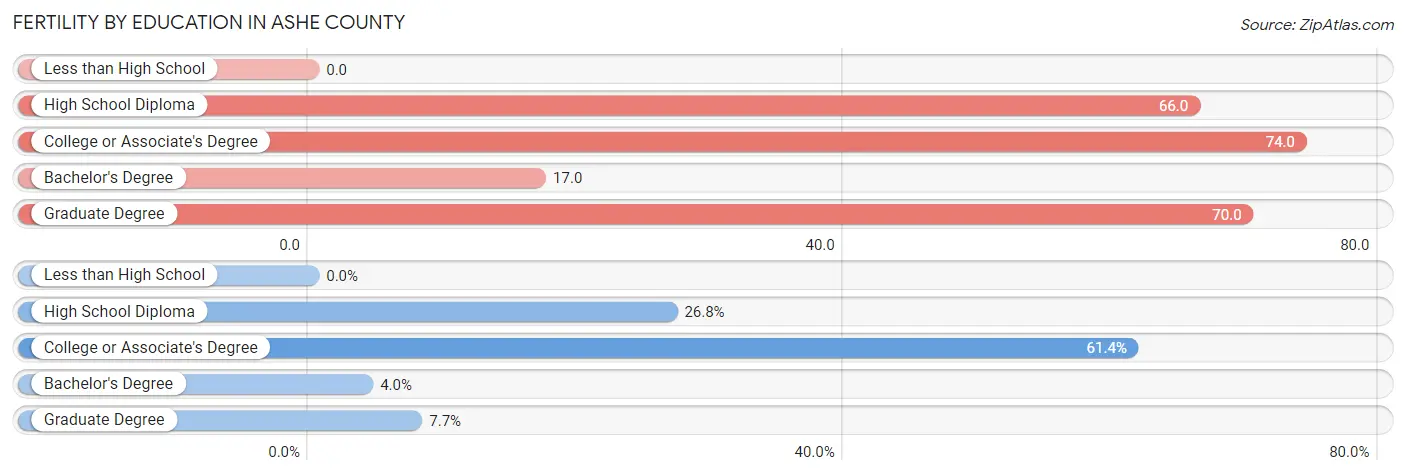
| Educational Attainment | Women with Births | Births / 1,000 Women |
| Less than High School | 0 (0.0%) | 0.0 |
| High School Diploma | 73 (26.8%) | 66.0 |
| College or Associate's Degree | 167 (61.4%) | 74.0 |
| Bachelor's Degree | 11 (4.0%) | 17.0 |
| Graduate Degree | 21 (7.7%) | 70.0 |
| Total | 272 (100.0%) | 54.0 |
Fertility by Education by Marriage Status in Ashe County
29.8% of women with births in Ashe County are unmarried. Women with the educational attainment of bachelor's degree are most likely to be married with 100.0% of them married at childbirth, while women with the educational attainment of high school diploma are least likely to be married with 100.0% of them unmarried at childbirth.
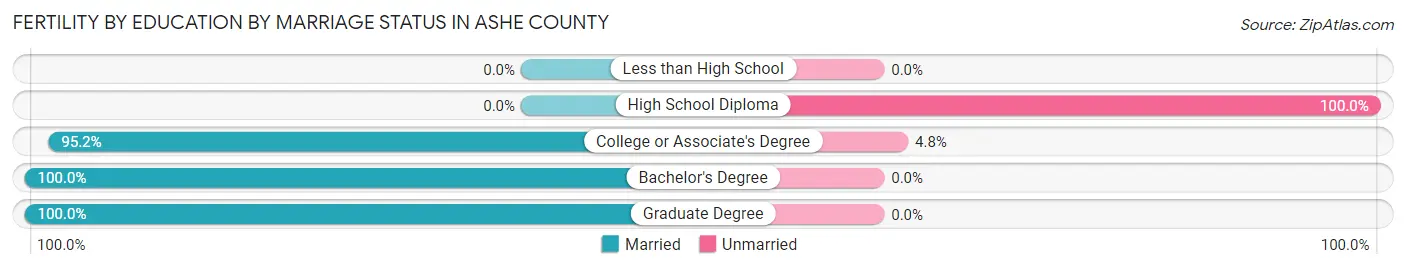
| Educational Attainment | Married | Unmarried |
| Less than High School | 0 (0.0%) | 0 (0.0%) |
| High School Diploma | 0 (0.0%) | 73 (100.0%) |
| College or Associate's Degree | 159 (95.2%) | 8 (4.8%) |
| Bachelor's Degree | 11 (100.0%) | 0 (0.0%) |
| Graduate Degree | 21 (100.0%) | 0 (0.0%) |
| Total | 191 (70.2%) | 81 (29.8%) |
Employment Characteristics in Ashe County
Employment by Class of Employer in Ashe County
Among the 11,435 employed individuals in Ashe County, private company employees (7,703 | 67.4%), self-employed (not incorporated) (1,011 | 8.8%), and not-for-profit organizations (815 | 7.1%) make up the most common classes of employment.
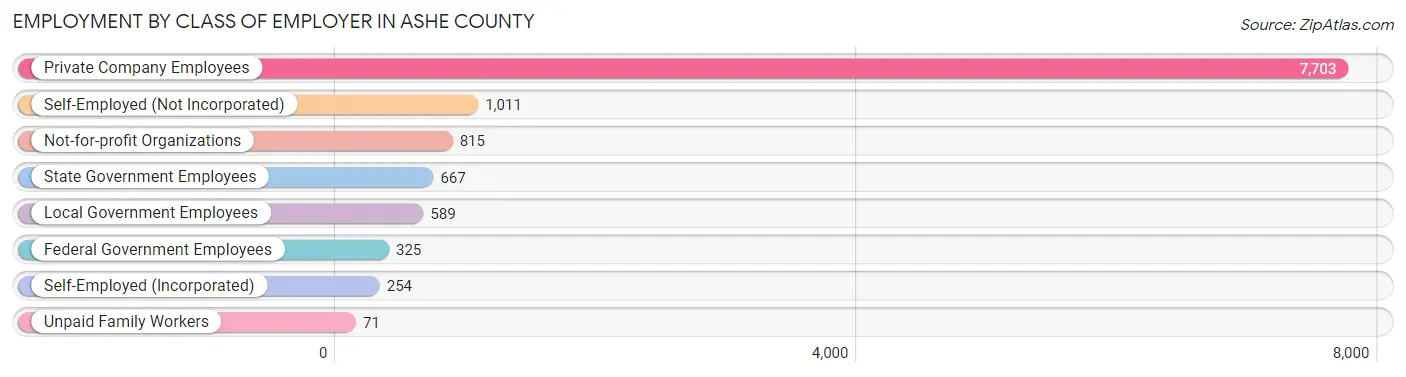
| Employer Class | # Employees | % Employees |
| Private Company Employees | 7,703 | 67.4% |
| Self-Employed (Incorporated) | 254 | 2.2% |
| Self-Employed (Not Incorporated) | 1,011 | 8.8% |
| Not-for-profit Organizations | 815 | 7.1% |
| Local Government Employees | 589 | 5.1% |
| State Government Employees | 667 | 5.8% |
| Federal Government Employees | 325 | 2.8% |
| Unpaid Family Workers | 71 | 0.6% |
| Total | 11,435 | 100.0% |
Employment Status by Age in Ashe County
According to the labor force statistics for Ashe County, out of the total population over 16 years of age (22,892), 54.0% or 12,362 individuals are in the labor force, with 5.1% or 630 of them unemployed. The age group with the highest labor force participation rate is 30 to 34 years, with 87.4% or 1,259 individuals in the labor force. Within the labor force, the 30 to 34 years age range has the highest percentage of unemployed individuals, with 14.6% or 184 of them being unemployed.
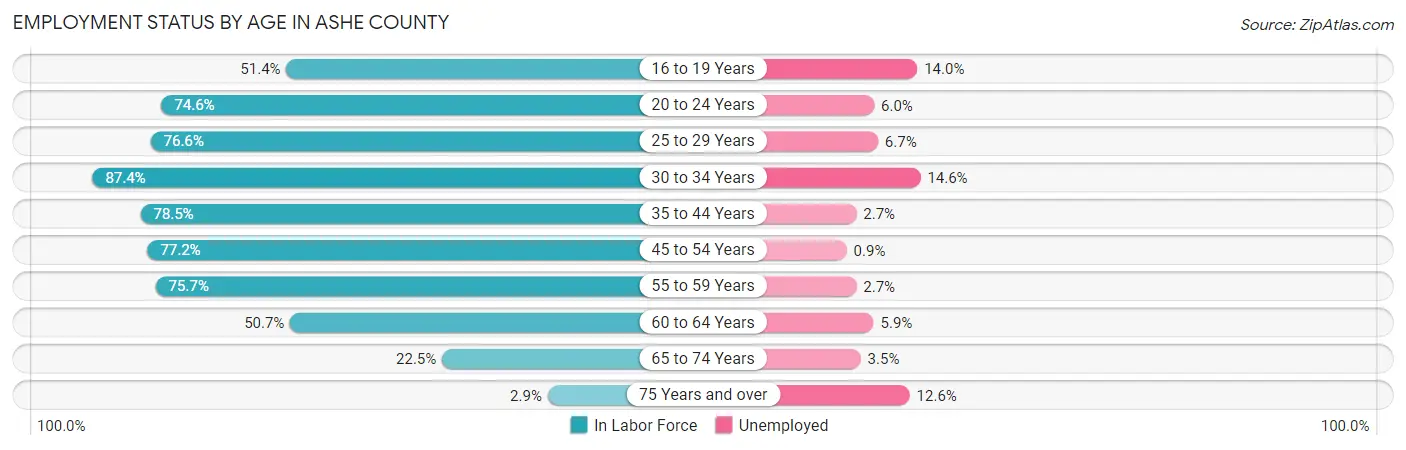
| Age Bracket | In Labor Force | Unemployed |
| 16 to 19 Years | 586 (51.4%) | 82 (14.0%) |
| 20 to 24 Years | 904 (74.6%) | 54 (6.0%) |
| 25 to 29 Years | 1,015 (76.6%) | 68 (6.7%) |
| 30 to 34 Years | 1,259 (87.4%) | 184 (14.6%) |
| 35 to 44 Years | 2,311 (78.5%) | 62 (2.7%) |
| 45 to 54 Years | 2,614 (77.2%) | 24 (0.9%) |
| 55 to 59 Years | 1,394 (75.7%) | 38 (2.7%) |
| 60 to 64 Years | 1,258 (50.7%) | 74 (5.9%) |
| 65 to 74 Years | 935 (22.5%) | 33 (3.5%) |
| 75 Years and over | 86 (2.9%) | 11 (12.6%) |
| Total | 12,362 (54.0%) | 630 (5.1%) |
Employment Status by Educational Attainment in Ashe County
According to labor force statistics for Ashe County, 73.4% of individuals (9,850) out of the total population between 25 and 64 years of age (13,419) are in the labor force, with 4.6% or 453 of them being unemployed. The group with the highest labor force participation rate are those with the educational attainment of college / associate degree, with 79.1% or 4,130 individuals in the labor force. Within the labor force, individuals with less than high school education have the highest percentage of unemployment, with 6.1% or 61 of them being unemployed.
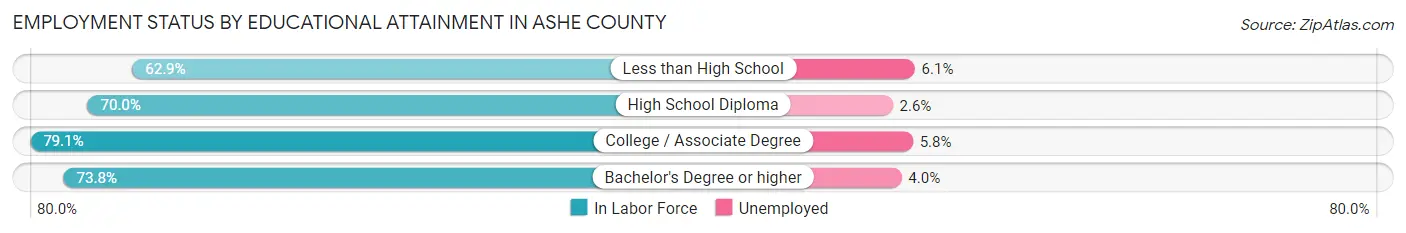
| Educational Attainment | In Labor Force | Unemployed |
| Less than High School | 993 (62.9%) | 96 (6.1%) |
| High School Diploma | 2,762 (70.0%) | 103 (2.6%) |
| College / Associate Degree | 4,130 (79.1%) | 303 (5.8%) |
| Bachelor's Degree or higher | 1,974 (73.8%) | 107 (4.0%) |
| Total | 9,850 (73.4%) | 617 (4.6%) |
Employment Occupations by Sex in Ashe County
Management, Business, Science and Arts Occupations
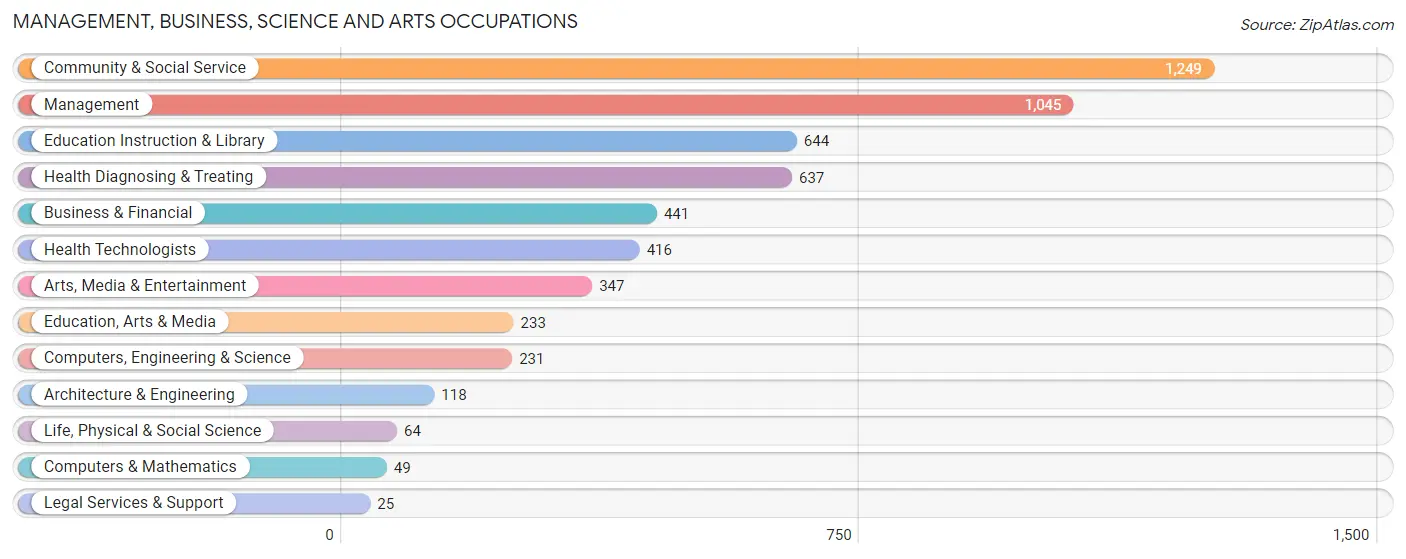
The most common Management, Business, Science and Arts occupations in Ashe County are Community & Social Service (1,249 | 10.7%), Management (1,045 | 8.9%), Education Instruction & Library (644 | 5.5%), Health Diagnosing & Treating (637 | 5.4%), and Business & Financial (441 | 3.8%).
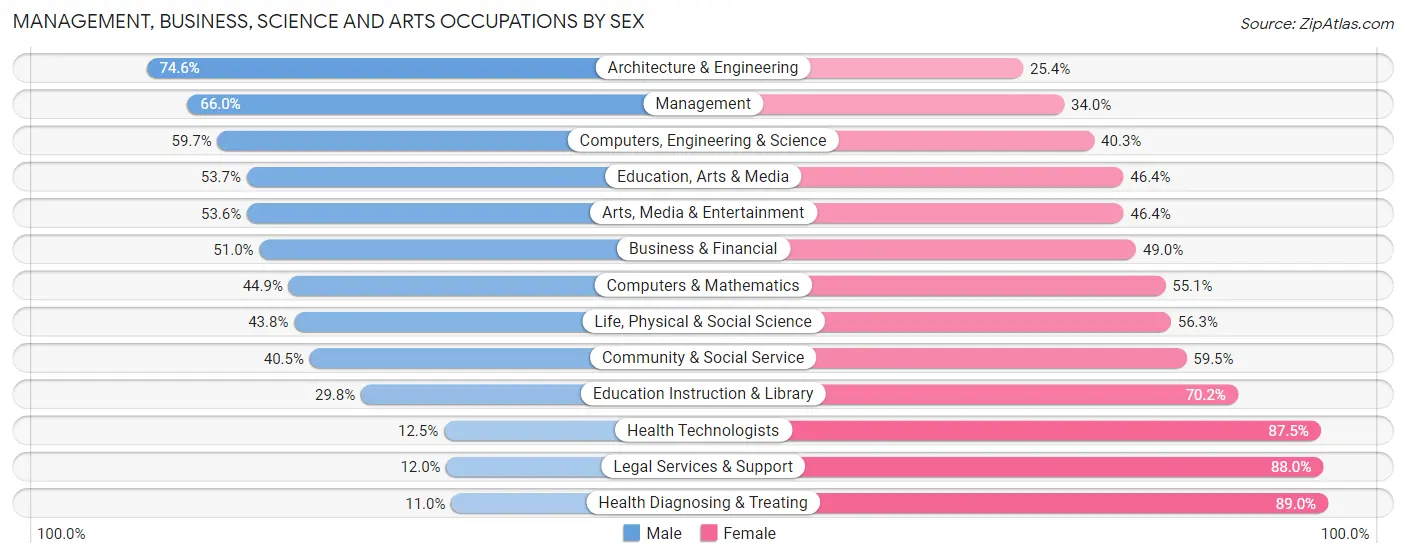
Management, Business, Science and Arts Occupations by Sex
Within the Management, Business, Science and Arts occupations in Ashe County, the most male-oriented occupations are Architecture & Engineering (74.6%), Management (66.0%), and Computers, Engineering & Science (59.7%), while the most female-oriented occupations are Health Diagnosing & Treating (89.0%), Legal Services & Support (88.0%), and Health Technologists (87.5%).
| Occupation | Male | Female |
| Management | 690 (66.0%) | 355 (34.0%) |
| Business & Financial | 225 (51.0%) | 216 (49.0%) |
| Computers, Engineering & Science | 138 (59.7%) | 93 (40.3%) |
| Computers & Mathematics | 22 (44.9%) | 27 (55.1%) |
| Architecture & Engineering | 88 (74.6%) | 30 (25.4%) |
| Life, Physical & Social Science | 28 (43.8%) | 36 (56.2%) |
| Community & Social Service | 506 (40.5%) | 743 (59.5%) |
| Education, Arts & Media | 125 (53.6%) | 108 (46.4%) |
| Legal Services & Support | 3 (12.0%) | 22 (88.0%) |
| Education Instruction & Library | 192 (29.8%) | 452 (70.2%) |
| Arts, Media & Entertainment | 186 (53.6%) | 161 (46.4%) |
| Health Diagnosing & Treating | 70 (11.0%) | 567 (89.0%) |
| Health Technologists | 52 (12.5%) | 364 (87.5%) |
| Total (Category) | 1,629 (45.2%) | 1,974 (54.8%) |
| Total (Overall) | 6,249 (53.4%) | 5,461 (46.6%) |
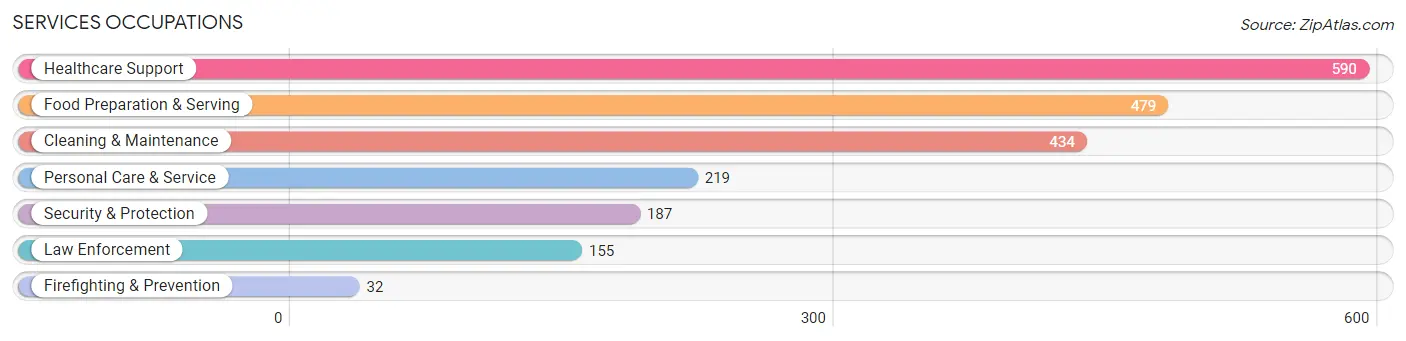
Services Occupations
The most common Services occupations in Ashe County are Healthcare Support (590 | 5.0%), Food Preparation & Serving (479 | 4.1%), Cleaning & Maintenance (434 | 3.7%), Personal Care & Service (219 | 1.9%), and Security & Protection (187 | 1.6%).
Services Occupations by Sex
Within the Services occupations in Ashe County, the most male-oriented occupations are Firefighting & Prevention (100.0%), Security & Protection (98.4%), and Law Enforcement (98.1%), while the most female-oriented occupations are Healthcare Support (93.4%), Personal Care & Service (89.0%), and Food Preparation & Serving (72.2%).
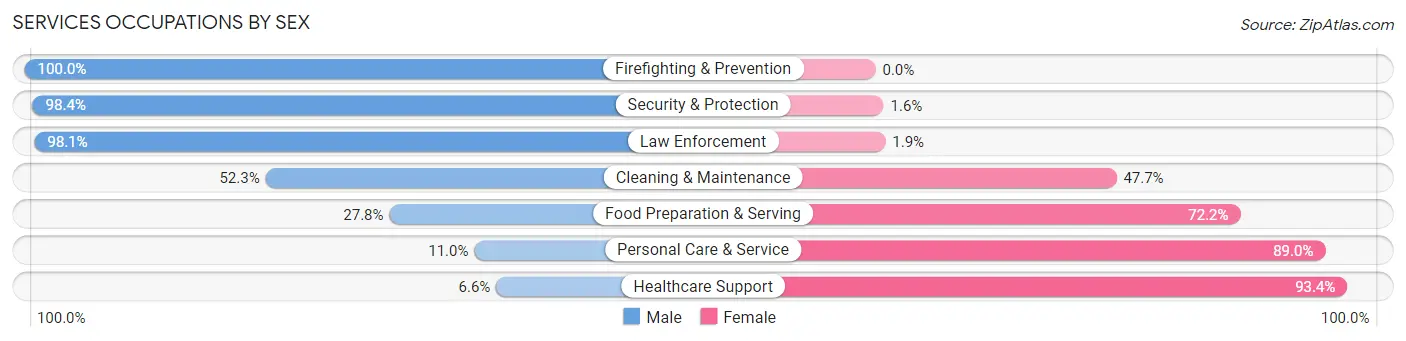
| Occupation | Male | Female |
| Healthcare Support | 39 (6.6%) | 551 (93.4%) |
| Security & Protection | 184 (98.4%) | 3 (1.6%) |
| Firefighting & Prevention | 32 (100.0%) | 0 (0.0%) |
| Law Enforcement | 152 (98.1%) | 3 (1.9%) |
| Food Preparation & Serving | 133 (27.8%) | 346 (72.2%) |
| Cleaning & Maintenance | 227 (52.3%) | 207 (47.7%) |
| Personal Care & Service | 24 (11.0%) | 195 (89.0%) |
| Total (Category) | 607 (31.8%) | 1,302 (68.2%) |
| Total (Overall) | 6,249 (53.4%) | 5,461 (46.6%) |
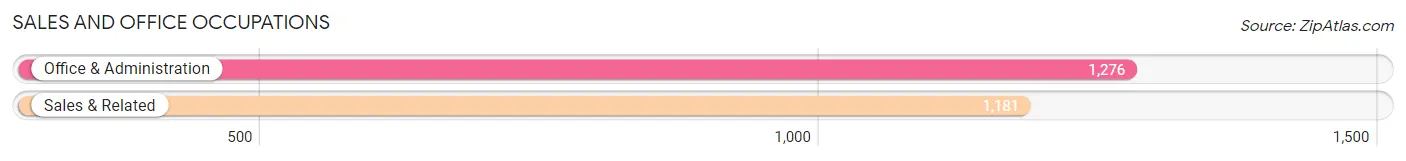
Sales and Office Occupations
The most common Sales and Office occupations in Ashe County are Office & Administration (1,276 | 10.9%), and Sales & Related (1,181 | 10.1%).
Sales and Office Occupations by Sex
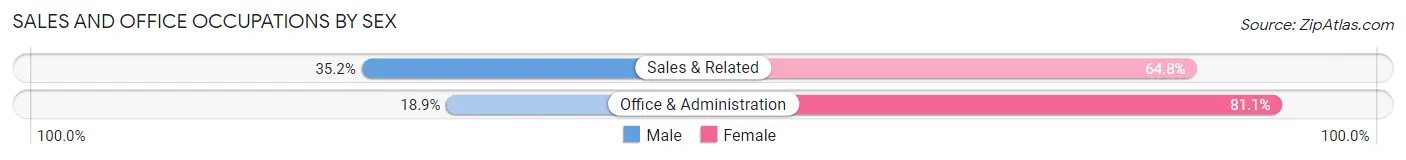
| Occupation | Male | Female |
| Sales & Related | 416 (35.2%) | 765 (64.8%) |
| Office & Administration | 241 (18.9%) | 1,035 (81.1%) |
| Total (Category) | 657 (26.7%) | 1,800 (73.3%) |
| Total (Overall) | 6,249 (53.4%) | 5,461 (46.6%) |
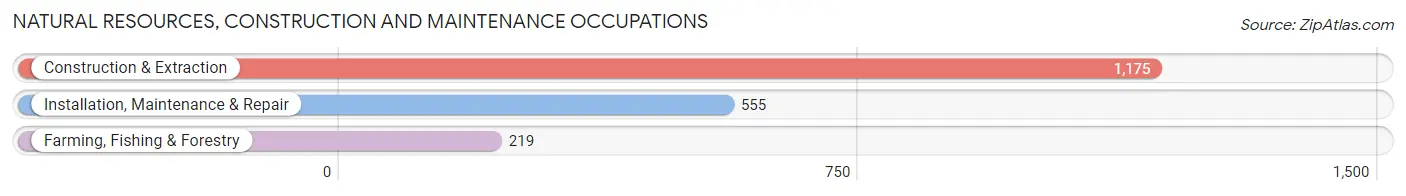
Natural Resources, Construction and Maintenance Occupations
The most common Natural Resources, Construction and Maintenance occupations in Ashe County are Construction & Extraction (1,175 | 10.0%), Installation, Maintenance & Repair (555 | 4.7%), and Farming, Fishing & Forestry (219 | 1.9%).
Natural Resources, Construction and Maintenance Occupations by Sex
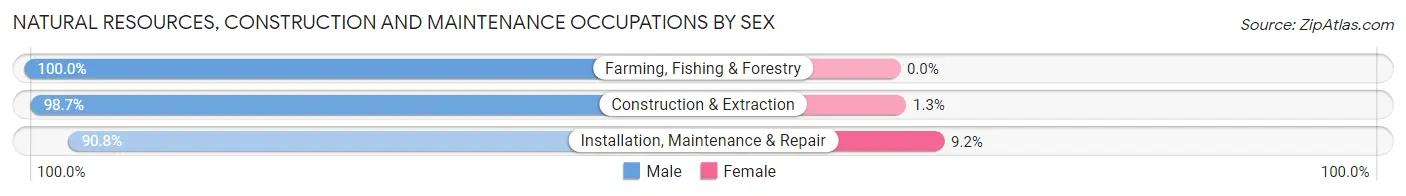
| Occupation | Male | Female |
| Farming, Fishing & Forestry | 219 (100.0%) | 0 (0.0%) |
| Construction & Extraction | 1,160 (98.7%) | 15 (1.3%) |
| Installation, Maintenance & Repair | 504 (90.8%) | 51 (9.2%) |
| Total (Category) | 1,883 (96.6%) | 66 (3.4%) |
| Total (Overall) | 6,249 (53.4%) | 5,461 (46.6%) |
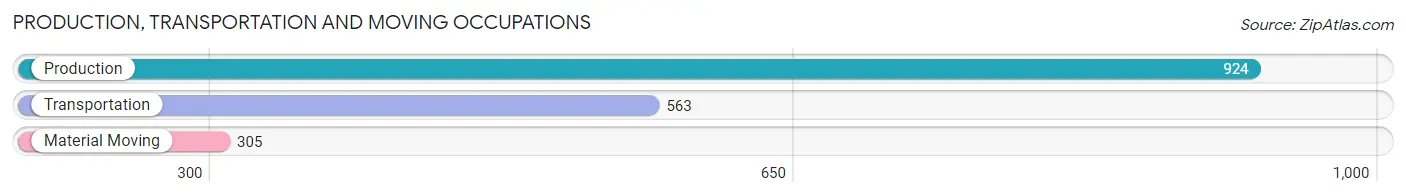
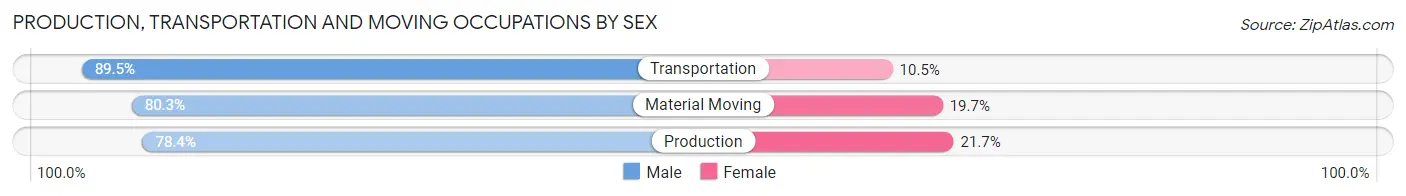
Production, Transportation and Moving Occupations
The most common Production, Transportation and Moving occupations in Ashe County are Production (924 | 7.9%), Transportation (563 | 4.8%), and Material Moving (305 | 2.6%).
Production, Transportation and Moving Occupations by Sex
| Occupation | Male | Female |
| Production | 724 (78.3%) | 200 (21.6%) |
| Transportation | 504 (89.5%) | 59 (10.5%) |
| Material Moving | 245 (80.3%) | 60 (19.7%) |
| Total (Category) | 1,473 (82.2%) | 319 (17.8%) |
| Total (Overall) | 6,249 (53.4%) | 5,461 (46.6%) |
Employment Industries by Sex in Ashe County
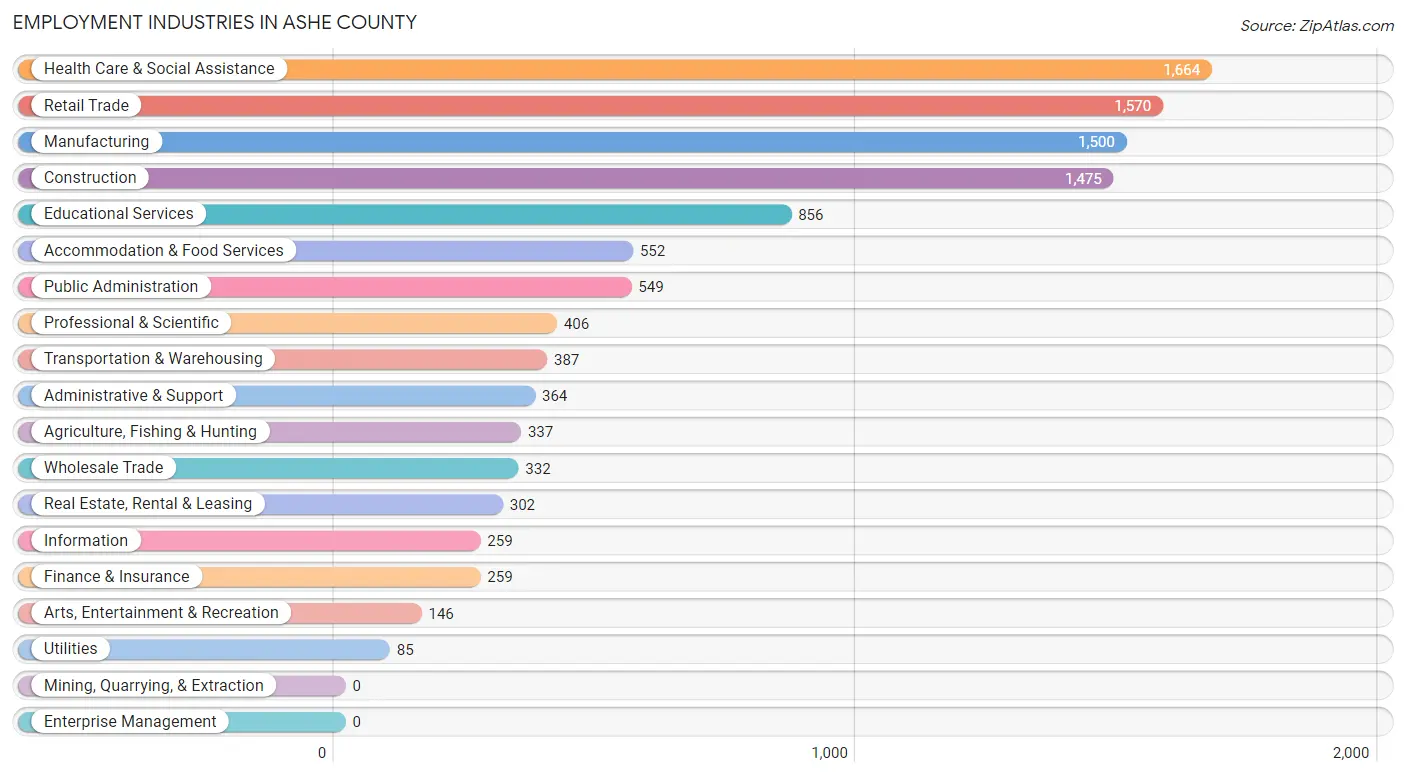
Employment Industries in Ashe County
The major employment industries in Ashe County include Health Care & Social Assistance (1,664 | 14.2%), Retail Trade (1,570 | 13.4%), Manufacturing (1,500 | 12.8%), Construction (1,475 | 12.6%), and Educational Services (856 | 7.3%).
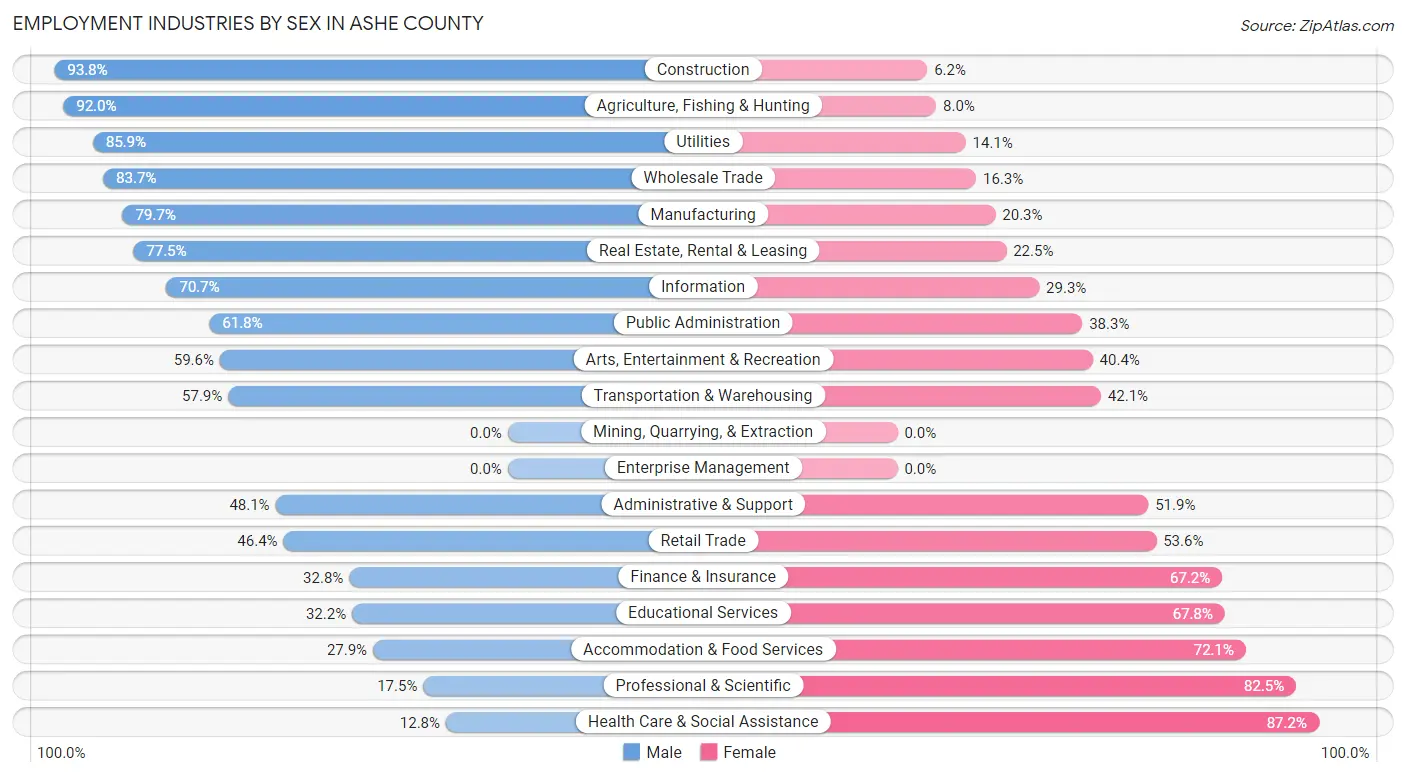
Employment Industries by Sex in Ashe County
The Ashe County industries that see more men than women are Construction (93.8%), Agriculture, Fishing & Hunting (92.0%), and Utilities (85.9%), whereas the industries that tend to have a higher number of women are Health Care & Social Assistance (87.2%), Professional & Scientific (82.5%), and Accommodation & Food Services (72.1%).
| Industry | Male | Female |
| Agriculture, Fishing & Hunting | 310 (92.0%) | 27 (8.0%) |
| Mining, Quarrying, & Extraction | 0 (0.0%) | 0 (0.0%) |
| Construction | 1,384 (93.8%) | 91 (6.2%) |
| Manufacturing | 1,196 (79.7%) | 304 (20.3%) |
| Wholesale Trade | 278 (83.7%) | 54 (16.3%) |
| Retail Trade | 729 (46.4%) | 841 (53.6%) |
| Transportation & Warehousing | 224 (57.9%) | 163 (42.1%) |
| Utilities | 73 (85.9%) | 12 (14.1%) |
| Information | 183 (70.7%) | 76 (29.3%) |
| Finance & Insurance | 85 (32.8%) | 174 (67.2%) |
| Real Estate, Rental & Leasing | 234 (77.5%) | 68 (22.5%) |
| Professional & Scientific | 71 (17.5%) | 335 (82.5%) |
| Enterprise Management | 0 (0.0%) | 0 (0.0%) |
| Administrative & Support | 175 (48.1%) | 189 (51.9%) |
| Educational Services | 276 (32.2%) | 580 (67.8%) |
| Health Care & Social Assistance | 213 (12.8%) | 1,451 (87.2%) |
| Arts, Entertainment & Recreation | 87 (59.6%) | 59 (40.4%) |
| Accommodation & Food Services | 154 (27.9%) | 398 (72.1%) |
| Public Administration | 339 (61.8%) | 210 (38.3%) |
| Total | 6,249 (53.4%) | 5,461 (46.6%) |
Education in Ashe County
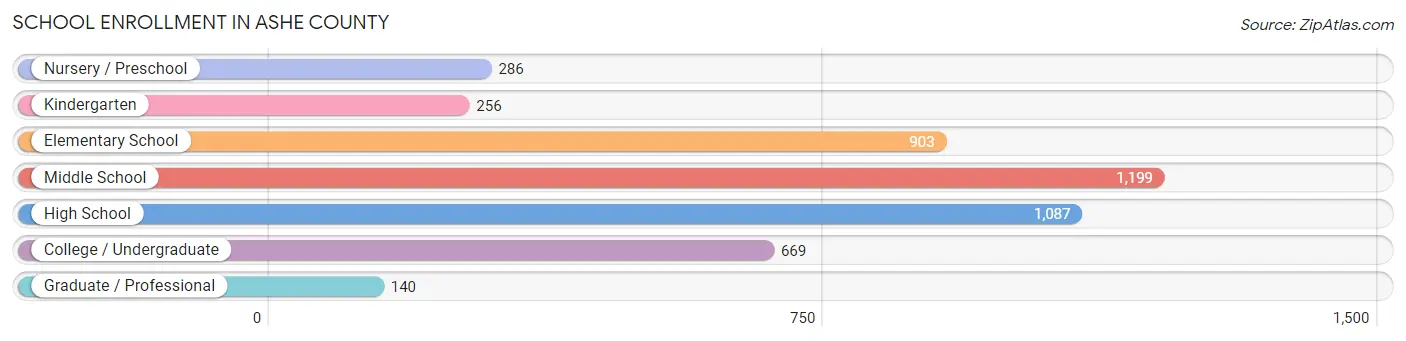
School Enrollment in Ashe County
The most common levels of schooling among the 4,540 students in Ashe County are middle school (1,199 | 26.4%), high school (1,087 | 23.9%), and elementary school (903 | 19.9%).
| School Level | # Students | % Students |
| Nursery / Preschool | 286 | 6.3% |
| Kindergarten | 256 | 5.6% |
| Elementary School | 903 | 19.9% |
| Middle School | 1,199 | 26.4% |
| High School | 1,087 | 23.9% |
| College / Undergraduate | 669 | 14.7% |
| Graduate / Professional | 140 | 3.1% |
| Total | 4,540 | 100.0% |
School Enrollment by Age by Funding Source in Ashe County
Out of a total of 4,540 students who are enrolled in schools in Ashe County, 640 (14.1%) attend a private institution, while the remaining 3,900 (85.9%) are enrolled in public schools. The age group of 25 to 34 year olds has the highest likelihood of being enrolled in private schools, with 147 (54.0% in the age bracket) enrolled. Conversely, the age group of 18 to 19 year olds has the lowest likelihood of being enrolled in a private school, with 217 (100.0% in the age bracket) attending a public institution.
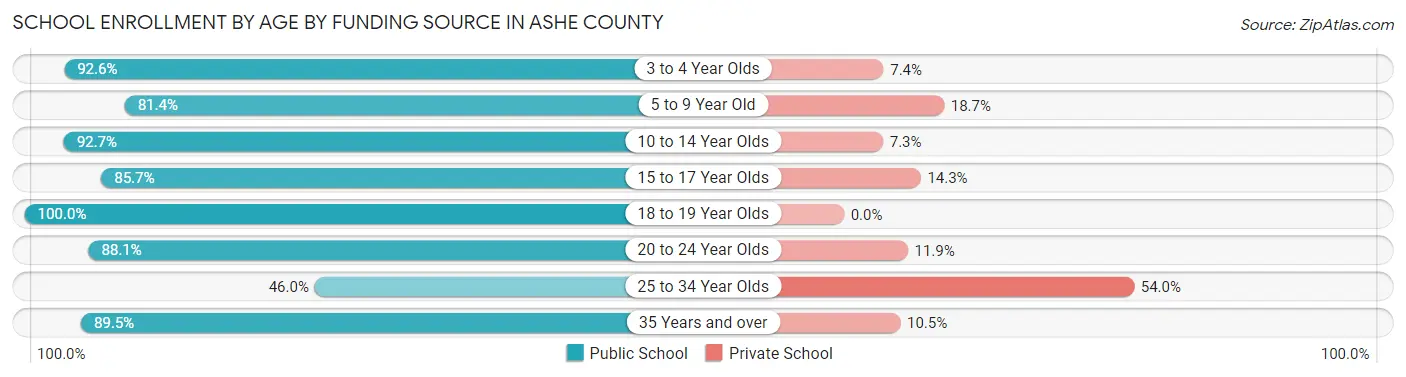
| Age Bracket | Public School | Private School |
| 3 to 4 Year Olds | 226 (92.6%) | 18 (7.4%) |
| 5 to 9 Year Old | 846 (81.4%) | 194 (18.6%) |
| 10 to 14 Year Olds | 1,360 (92.7%) | 107 (7.3%) |
| 15 to 17 Year Olds | 779 (85.7%) | 130 (14.3%) |
| 18 to 19 Year Olds | 217 (100.0%) | 0 (0.0%) |
| 20 to 24 Year Olds | 185 (88.1%) | 25 (11.9%) |
| 25 to 34 Year Olds | 125 (46.0%) | 147 (54.0%) |
| 35 Years and over | 162 (89.5%) | 19 (10.5%) |
| Total | 3,900 (85.9%) | 640 (14.1%) |
Educational Attainment by Field of Study in Ashe County
Education (850 | 18.3%), business (625 | 13.5%), arts & humanities (548 | 11.8%), science & technology (397 | 8.6%), and social sciences (388 | 8.4%) are the most common fields of study among 4,643 individuals in Ashe County who have obtained a bachelor's degree or higher.
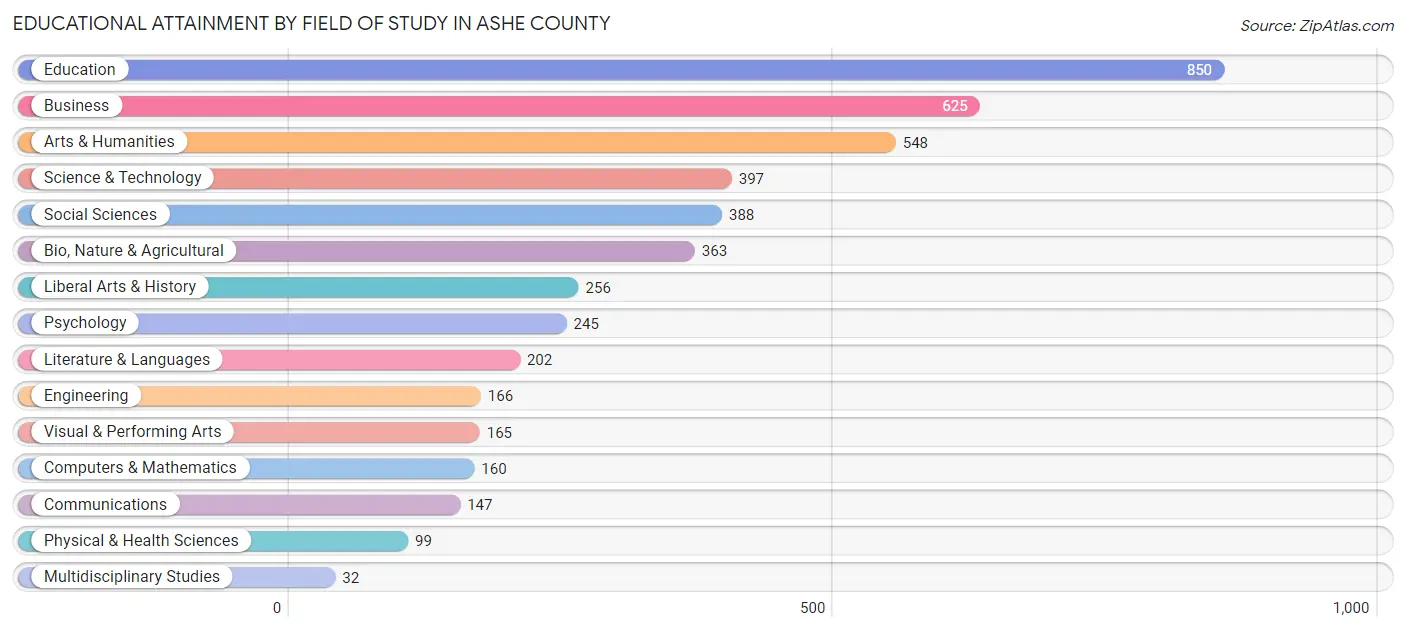
| Field of Study | # Graduates | % Graduates |
| Computers & Mathematics | 160 | 3.5% |
| Bio, Nature & Agricultural | 363 | 7.8% |
| Physical & Health Sciences | 99 | 2.1% |
| Psychology | 245 | 5.3% |
| Social Sciences | 388 | 8.4% |
| Engineering | 166 | 3.6% |
| Multidisciplinary Studies | 32 | 0.7% |
| Science & Technology | 397 | 8.6% |
| Business | 625 | 13.5% |
| Education | 850 | 18.3% |
| Literature & Languages | 202 | 4.3% |
| Liberal Arts & History | 256 | 5.5% |
| Visual & Performing Arts | 165 | 3.5% |
| Communications | 147 | 3.2% |
| Arts & Humanities | 548 | 11.8% |
| Total | 4,643 | 100.0% |
Transportation & Commute in Ashe County
Vehicle Availability by Sex in Ashe County
The most prevalent vehicle ownership categories in Ashe County are males with 2 vehicles (2,602, accounting for 43.4%) and females with 2 vehicles (2,077, making up 48.6%).
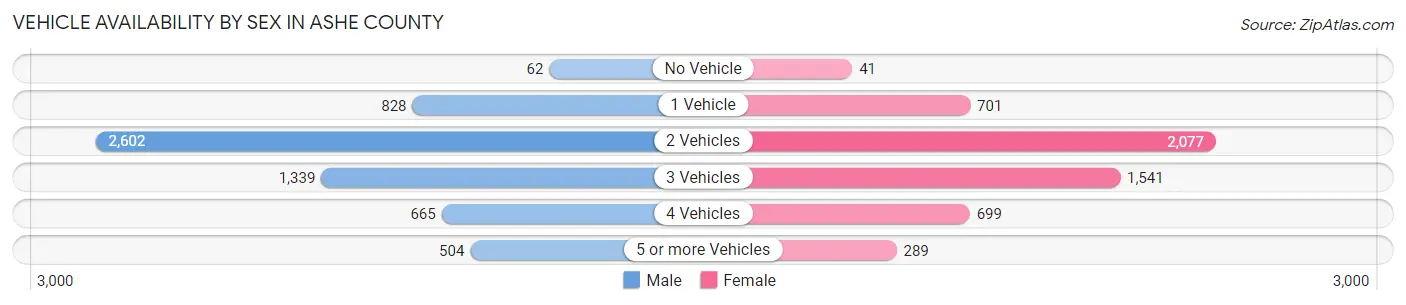
| Vehicles Available | Male | Female |
| No Vehicle | 62 (1.0%) | 41 (0.8%) |
| 1 Vehicle | 828 (13.8%) | 701 (13.1%) |
| 2 Vehicles | 2,602 (43.4%) | 2,077 (38.8%) |
| 3 Vehicles | 1,339 (22.3%) | 1,541 (28.8%) |
| 4 Vehicles | 665 (11.1%) | 699 (13.1%) |
| 5 or more Vehicles | 504 (8.4%) | 289 (5.4%) |
| Total | 6,000 (100.0%) | 5,348 (100.0%) |
Commute Time in Ashe County
The most frequently occuring commute durations in Ashe County are 10 to 14 minutes (1,817 commuters, 17.3%), 30 to 34 minutes (1,648 commuters, 15.7%), and 20 to 24 minutes (1,485 commuters, 14.1%).
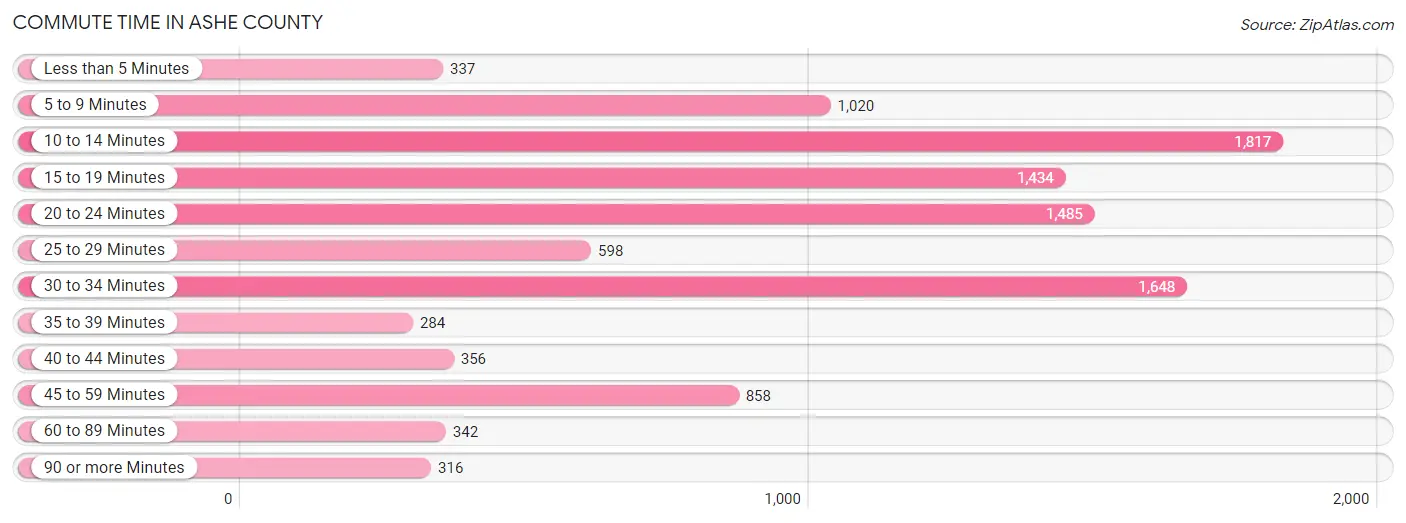
| Commute Time | # Commuters | % Commuters |
| Less than 5 Minutes | 337 | 3.2% |
| 5 to 9 Minutes | 1,020 | 9.7% |
| 10 to 14 Minutes | 1,817 | 17.3% |
| 15 to 19 Minutes | 1,434 | 13.7% |
| 20 to 24 Minutes | 1,485 | 14.1% |
| 25 to 29 Minutes | 598 | 5.7% |
| 30 to 34 Minutes | 1,648 | 15.7% |
| 35 to 39 Minutes | 284 | 2.7% |
| 40 to 44 Minutes | 356 | 3.4% |
| 45 to 59 Minutes | 858 | 8.2% |
| 60 to 89 Minutes | 342 | 3.3% |
| 90 or more Minutes | 316 | 3.0% |
Commute Time by Sex in Ashe County
The most common commute times in Ashe County are 20 to 24 minutes (850 commuters, 15.2%) for males and 10 to 14 minutes (970 commuters, 19.8%) for females.
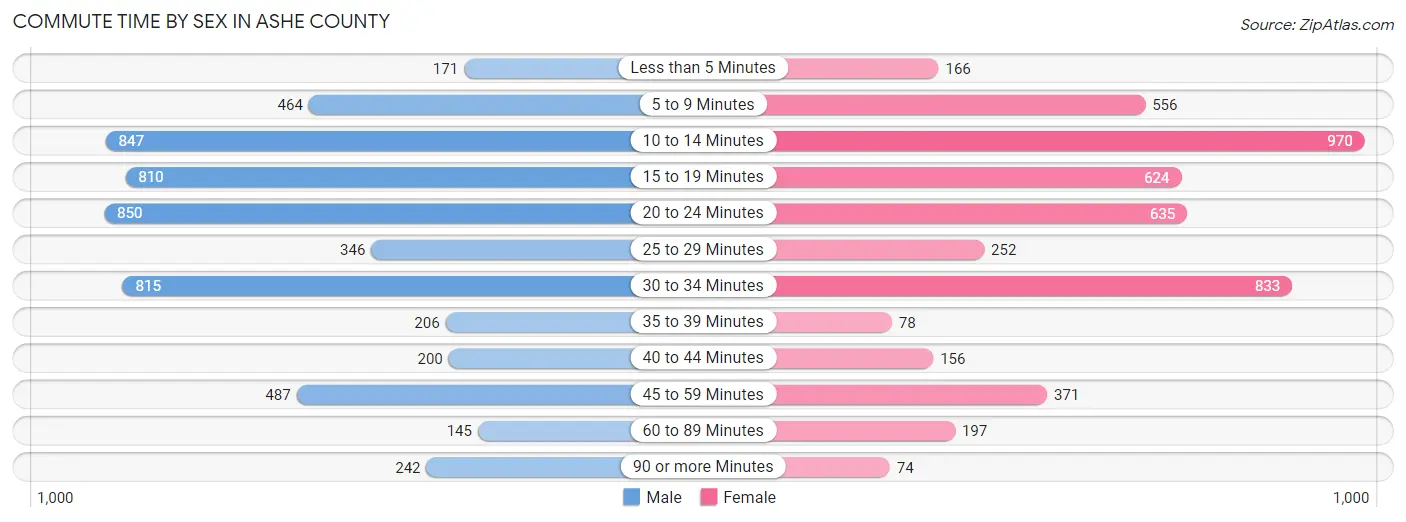
| Commute Time | Male | Female |
| Less than 5 Minutes | 171 (3.1%) | 166 (3.4%) |
| 5 to 9 Minutes | 464 (8.3%) | 556 (11.3%) |
| 10 to 14 Minutes | 847 (15.2%) | 970 (19.8%) |
| 15 to 19 Minutes | 810 (14.5%) | 624 (12.7%) |
| 20 to 24 Minutes | 850 (15.2%) | 635 (12.9%) |
| 25 to 29 Minutes | 346 (6.2%) | 252 (5.1%) |
| 30 to 34 Minutes | 815 (14.6%) | 833 (17.0%) |
| 35 to 39 Minutes | 206 (3.7%) | 78 (1.6%) |
| 40 to 44 Minutes | 200 (3.6%) | 156 (3.2%) |
| 45 to 59 Minutes | 487 (8.7%) | 371 (7.5%) |
| 60 to 89 Minutes | 145 (2.6%) | 197 (4.0%) |
| 90 or more Minutes | 242 (4.3%) | 74 (1.5%) |
Time of Departure to Work by Sex in Ashe County
The most frequent times of departure to work in Ashe County are 7:30 AM to 7:59 AM (863, 15.5%) for males and 7:00 AM to 7:29 AM (935, 19.0%) for females.
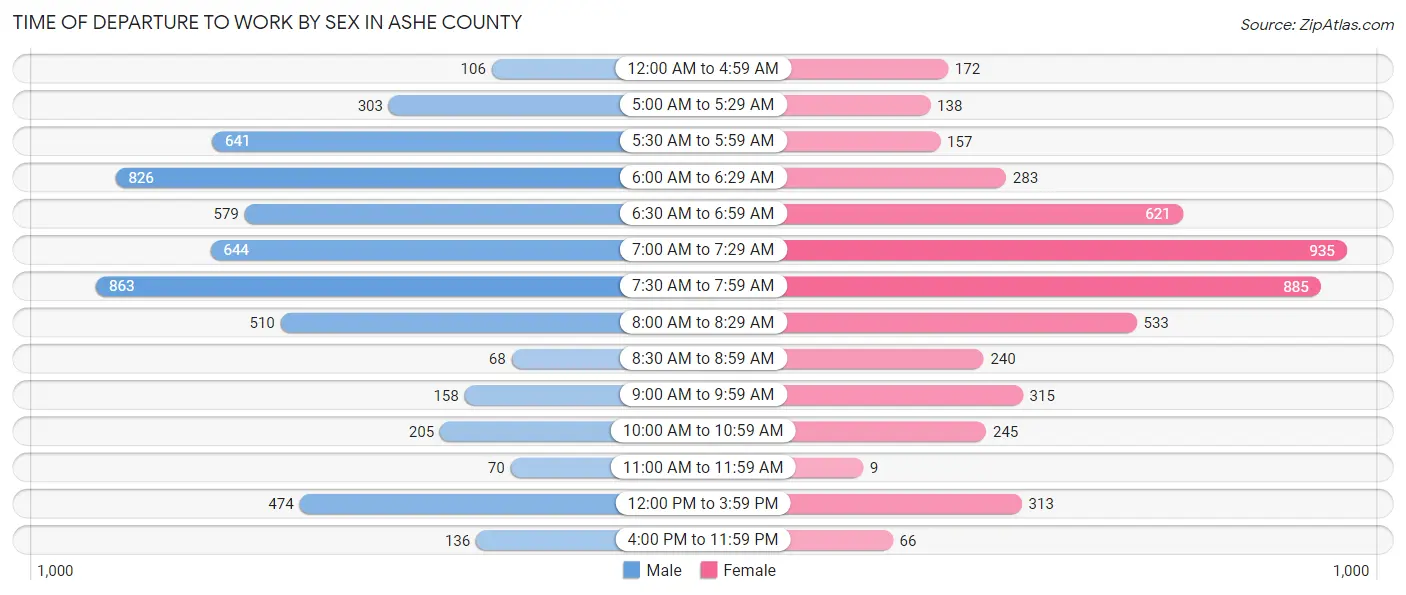
| Time of Departure | Male | Female |
| 12:00 AM to 4:59 AM | 106 (1.9%) | 172 (3.5%) |
| 5:00 AM to 5:29 AM | 303 (5.4%) | 138 (2.8%) |
| 5:30 AM to 5:59 AM | 641 (11.5%) | 157 (3.2%) |
| 6:00 AM to 6:29 AM | 826 (14.8%) | 283 (5.8%) |
| 6:30 AM to 6:59 AM | 579 (10.4%) | 621 (12.6%) |
| 7:00 AM to 7:29 AM | 644 (11.5%) | 935 (19.0%) |
| 7:30 AM to 7:59 AM | 863 (15.5%) | 885 (18.0%) |
| 8:00 AM to 8:29 AM | 510 (9.1%) | 533 (10.8%) |
| 8:30 AM to 8:59 AM | 68 (1.2%) | 240 (4.9%) |
| 9:00 AM to 9:59 AM | 158 (2.8%) | 315 (6.4%) |
| 10:00 AM to 10:59 AM | 205 (3.7%) | 245 (5.0%) |
| 11:00 AM to 11:59 AM | 70 (1.3%) | 9 (0.2%) |
| 12:00 PM to 3:59 PM | 474 (8.5%) | 313 (6.4%) |
| 4:00 PM to 11:59 PM | 136 (2.4%) | 66 (1.3%) |
| Total | 5,583 (100.0%) | 4,912 (100.0%) |
Housing Occupancy in Ashe County
Occupancy by Ownership in Ashe County
Of the total 11,823 dwellings in Ashe County, owner-occupied units account for 9,431 (79.8%), while renter-occupied units make up 2,392 (20.2%).
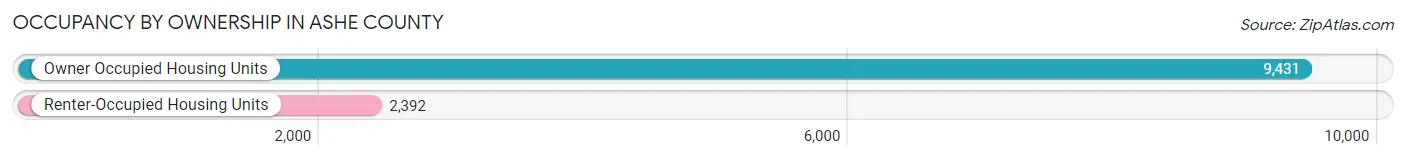
| Occupancy | # Housing Units | % Housing Units |
| Owner Occupied Housing Units | 9,431 | 79.8% |
| Renter-Occupied Housing Units | 2,392 | 20.2% |
| Total Occupied Housing Units | 11,823 | 100.0% |
Occupancy by Household Size in Ashe County
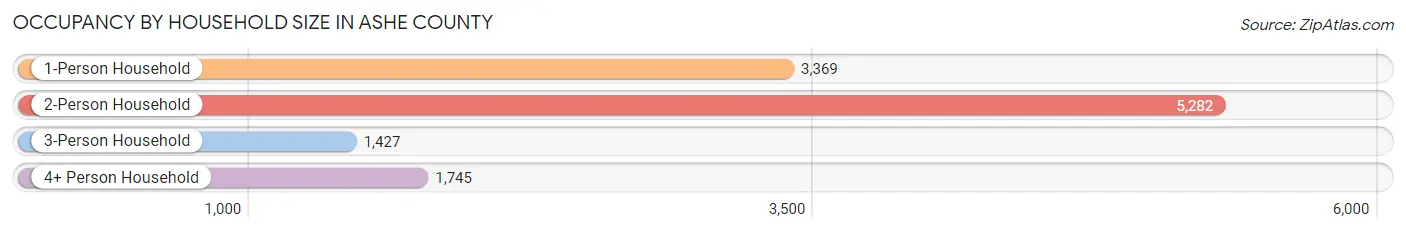
| Household Size | # Housing Units | % Housing Units |
| 1-Person Household | 3,369 | 28.5% |
| 2-Person Household | 5,282 | 44.7% |
| 3-Person Household | 1,427 | 12.1% |
| 4+ Person Household | 1,745 | 14.8% |
| Total Housing Units | 11,823 | 100.0% |
Occupancy by Ownership by Household Size in Ashe County
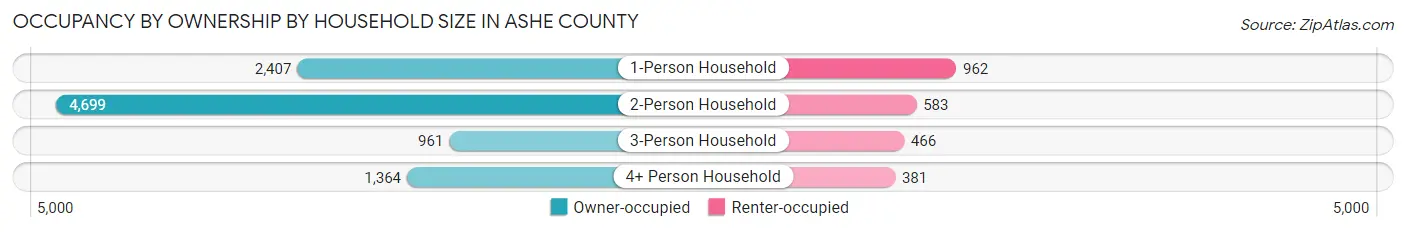
| Household Size | Owner-occupied | Renter-occupied |
| 1-Person Household | 2,407 (71.5%) | 962 (28.5%) |
| 2-Person Household | 4,699 (89.0%) | 583 (11.0%) |
| 3-Person Household | 961 (67.3%) | 466 (32.7%) |
| 4+ Person Household | 1,364 (78.2%) | 381 (21.8%) |
| Total Housing Units | 9,431 (79.8%) | 2,392 (20.2%) |
Occupancy by Educational Attainment in Ashe County
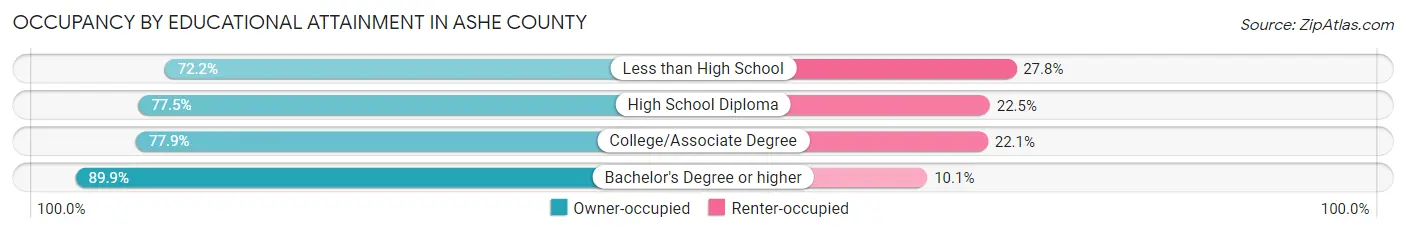
| Household Size | Owner-occupied | Renter-occupied |
| Less than High School | 1,025 (72.2%) | 394 (27.8%) |
| High School Diploma | 2,724 (77.5%) | 792 (22.5%) |
| College/Associate Degree | 3,301 (77.9%) | 938 (22.1%) |
| Bachelor's Degree or higher | 2,381 (89.9%) | 268 (10.1%) |
Occupancy by Age of Householder in Ashe County
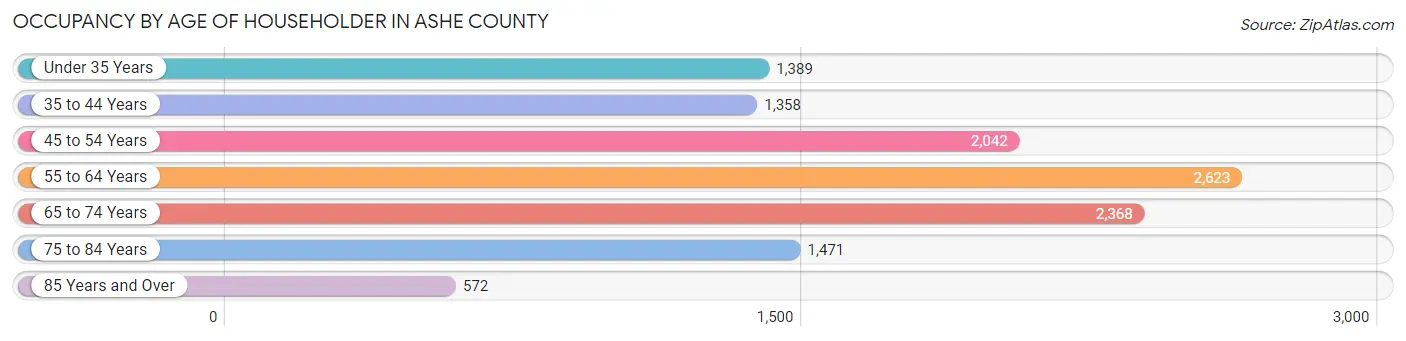
| Age Bracket | # Households | % Households |
| Under 35 Years | 1,389 | 11.7% |
| 35 to 44 Years | 1,358 | 11.5% |
| 45 to 54 Years | 2,042 | 17.3% |
| 55 to 64 Years | 2,623 | 22.2% |
| 65 to 74 Years | 2,368 | 20.0% |
| 75 to 84 Years | 1,471 | 12.4% |
| 85 Years and Over | 572 | 4.8% |
| Total | 11,823 | 100.0% |
Housing Finances in Ashe County
Median Income by Occupancy in Ashe County
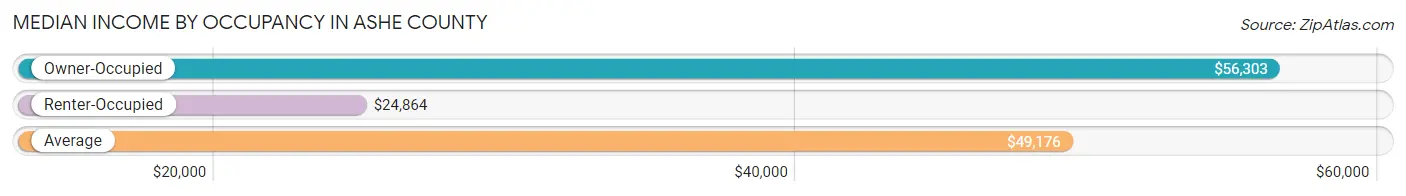
| Occupancy Type | # Households | Median Income |
| Owner-Occupied | 9,431 (79.8%) | $56,303 |
| Renter-Occupied | 2,392 (20.2%) | $24,864 |
| Average | 11,823 (100.0%) | $49,176 |
Occupancy by Householder Income Bracket in Ashe County
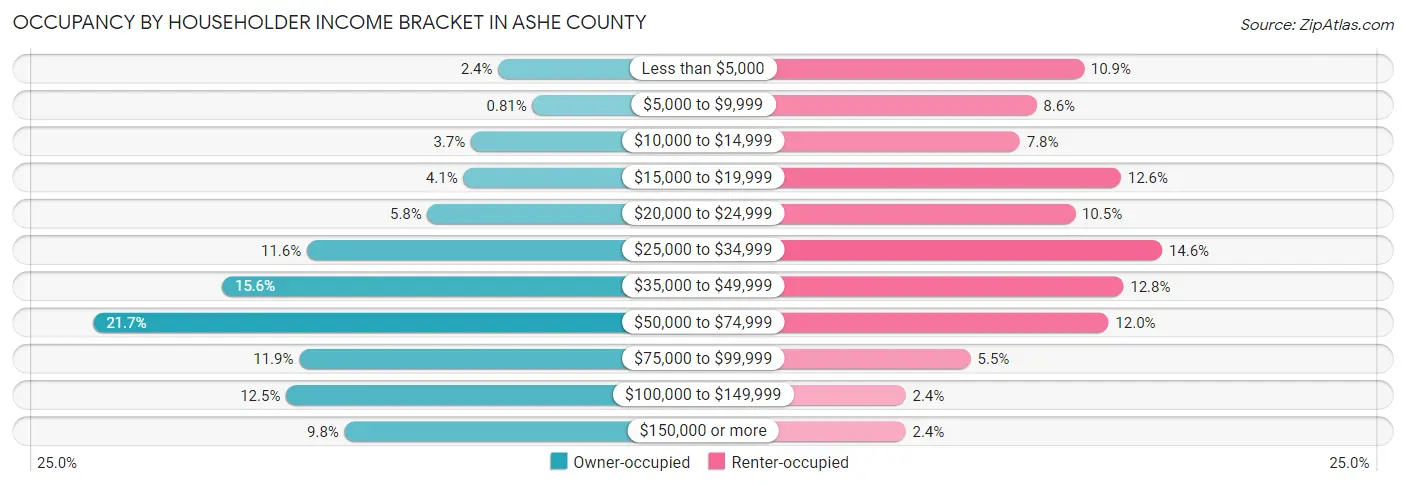
| Income Bracket | Owner-occupied | Renter-occupied |
| Less than $5,000 | 230 (2.4%) | 260 (10.9%) |
| $5,000 to $9,999 | 76 (0.8%) | 206 (8.6%) |
| $10,000 to $14,999 | 353 (3.7%) | 187 (7.8%) |
| $15,000 to $19,999 | 387 (4.1%) | 302 (12.6%) |
| $20,000 to $24,999 | 548 (5.8%) | 250 (10.4%) |
| $25,000 to $34,999 | 1,089 (11.6%) | 349 (14.6%) |
| $35,000 to $49,999 | 1,472 (15.6%) | 305 (12.8%) |
| $50,000 to $74,999 | 2,049 (21.7%) | 288 (12.0%) |
| $75,000 to $99,999 | 1,124 (11.9%) | 131 (5.5%) |
| $100,000 to $149,999 | 1,183 (12.5%) | 57 (2.4%) |
| $150,000 or more | 920 (9.8%) | 57 (2.4%) |
| Total | 9,431 (100.0%) | 2,392 (100.0%) |
Monthly Housing Cost Tiers in Ashe County
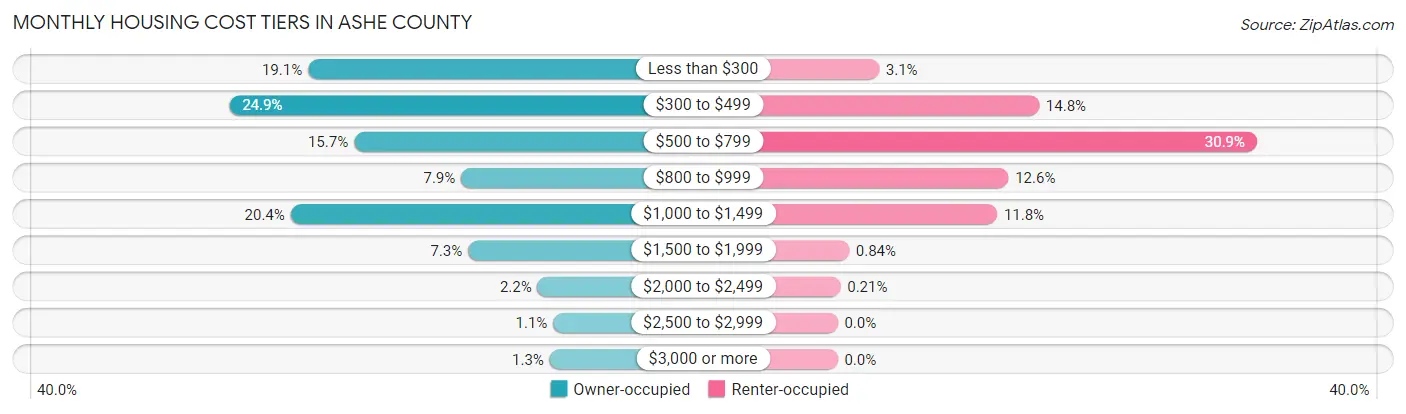
| Monthly Cost | Owner-occupied | Renter-occupied |
| Less than $300 | 1,804 (19.1%) | 73 (3.0%) |
| $300 to $499 | 2,351 (24.9%) | 355 (14.8%) |
| $500 to $799 | 1,484 (15.7%) | 739 (30.9%) |
| $800 to $999 | 740 (7.9%) | 301 (12.6%) |
| $1,000 to $1,499 | 1,925 (20.4%) | 281 (11.7%) |
| $1,500 to $1,999 | 692 (7.3%) | 20 (0.8%) |
| $2,000 to $2,499 | 209 (2.2%) | 5 (0.2%) |
| $2,500 to $2,999 | 101 (1.1%) | 0 (0.0%) |
| $3,000 or more | 125 (1.3%) | 0 (0.0%) |
| Total | 9,431 (100.0%) | 2,392 (100.0%) |
Physical Housing Characteristics in Ashe County
Housing Structures in Ashe County
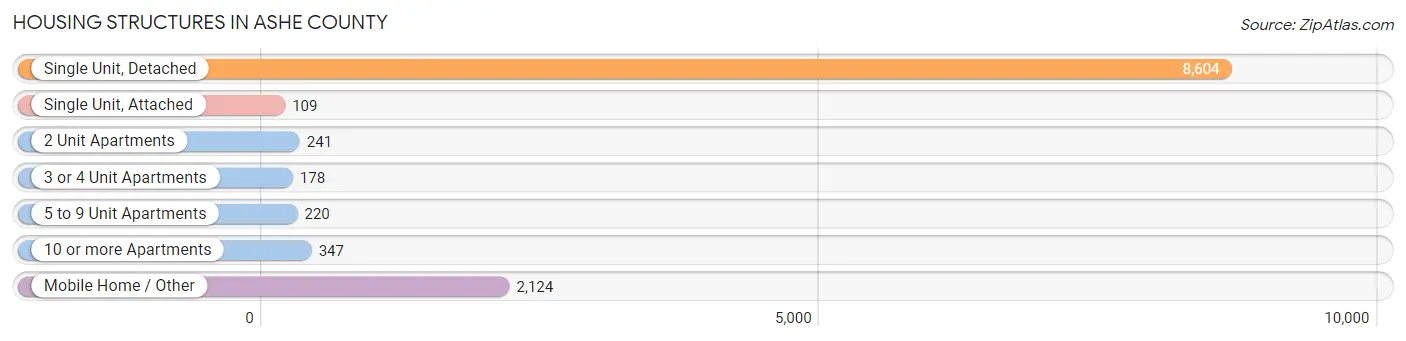
| Structure Type | # Housing Units | % Housing Units |
| Single Unit, Detached | 8,604 | 72.8% |
| Single Unit, Attached | 109 | 0.9% |
| 2 Unit Apartments | 241 | 2.0% |
| 3 or 4 Unit Apartments | 178 | 1.5% |
| 5 to 9 Unit Apartments | 220 | 1.9% |
| 10 or more Apartments | 347 | 2.9% |
| Mobile Home / Other | 2,124 | 18.0% |
| Total | 11,823 | 100.0% |
Housing Structures by Occupancy in Ashe County
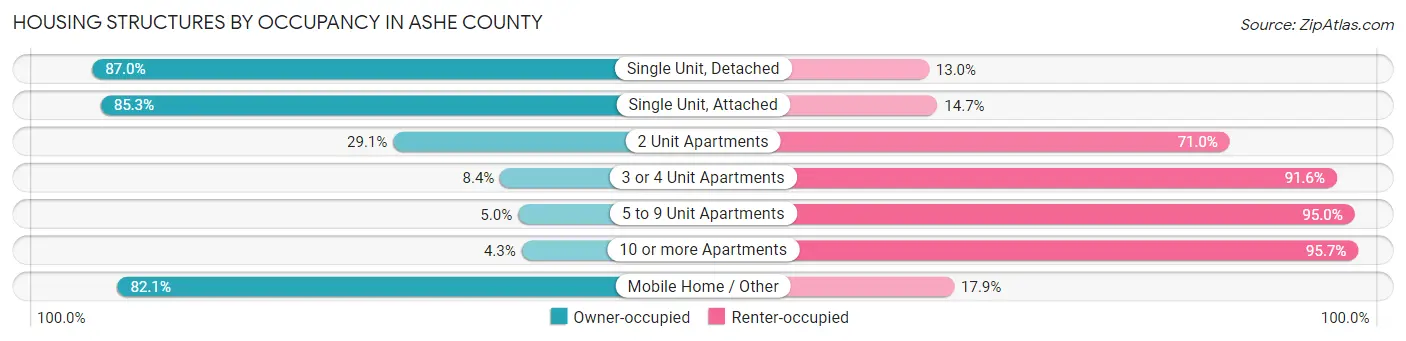
| Structure Type | Owner-occupied | Renter-occupied |
| Single Unit, Detached | 7,483 (87.0%) | 1,121 (13.0%) |
| Single Unit, Attached | 93 (85.3%) | 16 (14.7%) |
| 2 Unit Apartments | 70 (29.0%) | 171 (71.0%) |
| 3 or 4 Unit Apartments | 15 (8.4%) | 163 (91.6%) |
| 5 to 9 Unit Apartments | 11 (5.0%) | 209 (95.0%) |
| 10 or more Apartments | 15 (4.3%) | 332 (95.7%) |
| Mobile Home / Other | 1,744 (82.1%) | 380 (17.9%) |
| Total | 9,431 (79.8%) | 2,392 (20.2%) |
Housing Structures by Number of Rooms in Ashe County
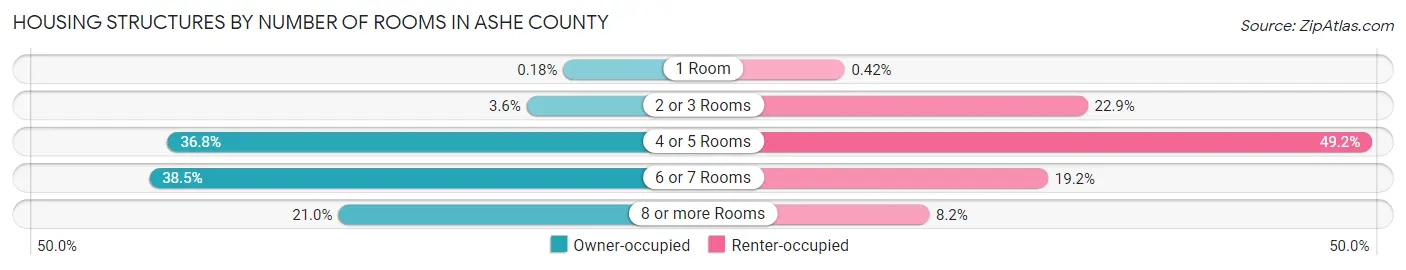
| Number of Rooms | Owner-occupied | Renter-occupied |
| 1 Room | 17 (0.2%) | 10 (0.4%) |
| 2 or 3 Rooms | 337 (3.6%) | 548 (22.9%) |
| 4 or 5 Rooms | 3,469 (36.8%) | 1,177 (49.2%) |
| 6 or 7 Rooms | 3,628 (38.5%) | 460 (19.2%) |
| 8 or more Rooms | 1,980 (21.0%) | 197 (8.2%) |
| Total | 9,431 (100.0%) | 2,392 (100.0%) |
Housing Structure by Heating Type in Ashe County
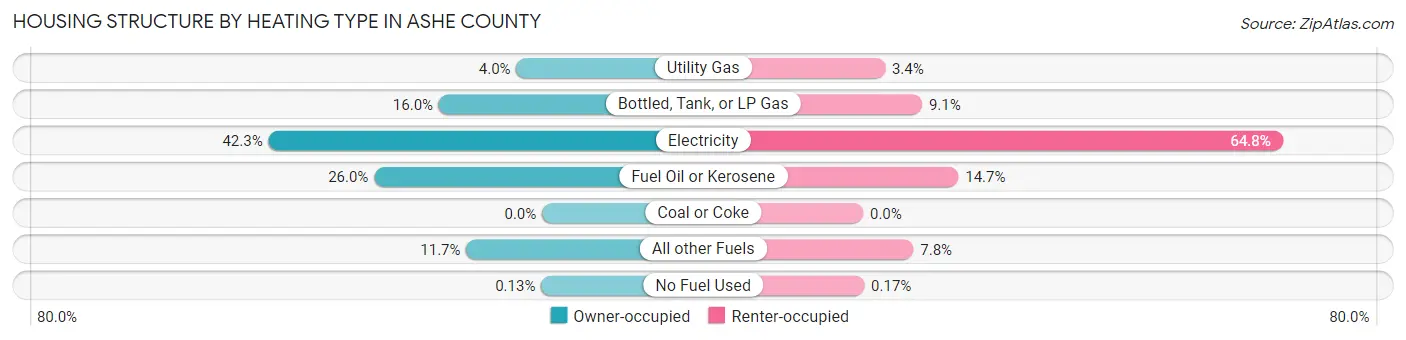
| Heating Type | Owner-occupied | Renter-occupied |
| Utility Gas | 374 (4.0%) | 81 (3.4%) |
| Bottled, Tank, or LP Gas | 1,504 (16.0%) | 218 (9.1%) |
| Electricity | 3,989 (42.3%) | 1,551 (64.8%) |
| Fuel Oil or Kerosene | 2,448 (26.0%) | 352 (14.7%) |
| Coal or Coke | 0 (0.0%) | 0 (0.0%) |
| All other Fuels | 1,104 (11.7%) | 186 (7.8%) |
| No Fuel Used | 12 (0.1%) | 4 (0.2%) |
| Total | 9,431 (100.0%) | 2,392 (100.0%) |
Household Vehicle Usage in Ashe County
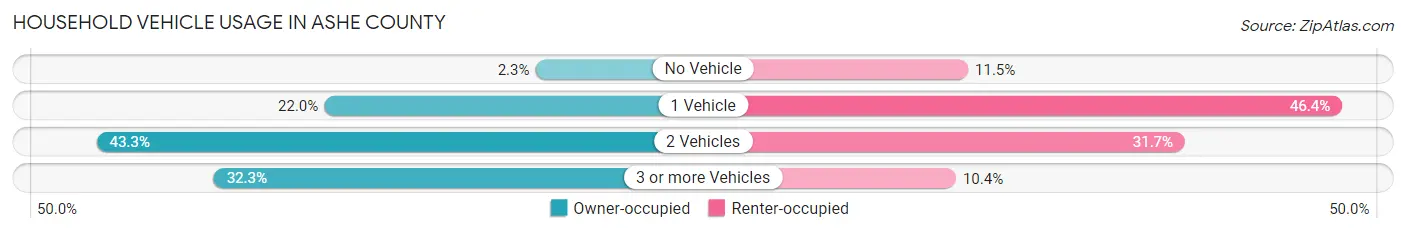
| Vehicles per Household | Owner-occupied | Renter-occupied |
| No Vehicle | 220 (2.3%) | 275 (11.5%) |
| 1 Vehicle | 2,079 (22.0%) | 1,110 (46.4%) |
| 2 Vehicles | 4,082 (43.3%) | 759 (31.7%) |
| 3 or more Vehicles | 3,050 (32.3%) | 248 (10.4%) |
| Total | 9,431 (100.0%) | 2,392 (100.0%) |
Real Estate & Mortgages in Ashe County
Real Estate and Mortgage Overview in Ashe County
| Characteristic | Without Mortgage | With Mortgage |
| Housing Units | 5,179 | 4,252 |
| Median Property Value | $196,500 | $201,600 |
| Median Household Income | $45,445 | $636 |
| Monthly Housing Costs | $370 | $117 |
| Real Estate Taxes | $1,090 | $90 |
Property Value by Mortgage Status in Ashe County
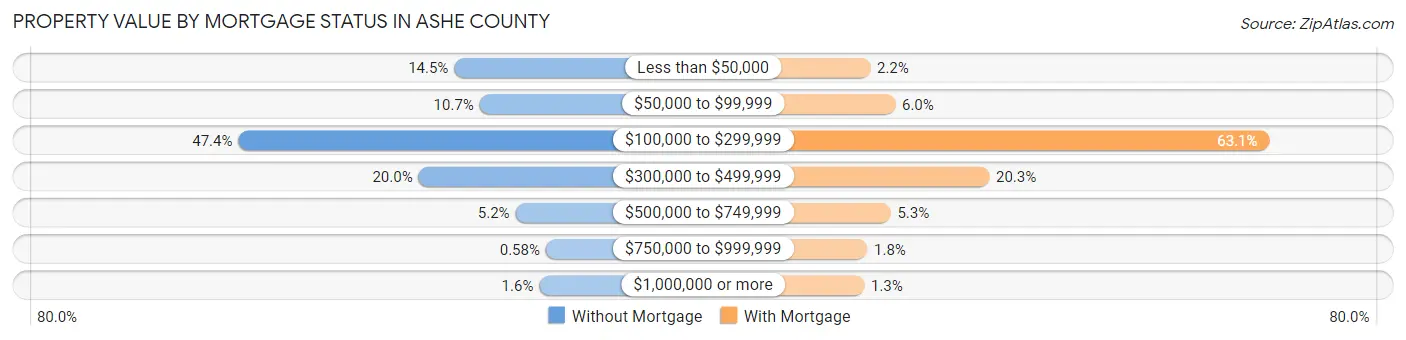
| Property Value | Without Mortgage | With Mortgage |
| Less than $50,000 | 753 (14.5%) | 94 (2.2%) |
| $50,000 to $99,999 | 552 (10.7%) | 256 (6.0%) |
| $100,000 to $299,999 | 2,457 (47.4%) | 2,681 (63.0%) |
| $300,000 to $499,999 | 1,035 (20.0%) | 865 (20.3%) |
| $500,000 to $749,999 | 270 (5.2%) | 226 (5.3%) |
| $750,000 to $999,999 | 30 (0.6%) | 75 (1.8%) |
| $1,000,000 or more | 82 (1.6%) | 55 (1.3%) |
| Total | 5,179 (100.0%) | 4,252 (100.0%) |
Household Income by Mortgage Status in Ashe County
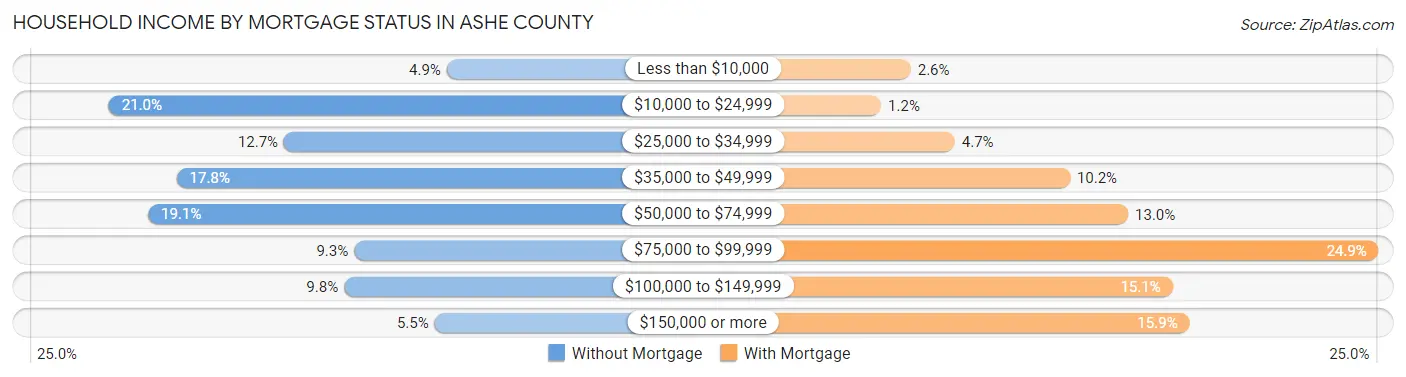
| Household Income | Without Mortgage | With Mortgage |
| Less than $10,000 | 254 (4.9%) | 112 (2.6%) |
| $10,000 to $24,999 | 1,087 (21.0%) | 52 (1.2%) |
| $25,000 to $34,999 | 655 (12.7%) | 201 (4.7%) |
| $35,000 to $49,999 | 920 (17.8%) | 434 (10.2%) |
| $50,000 to $74,999 | 990 (19.1%) | 552 (13.0%) |
| $75,000 to $99,999 | 482 (9.3%) | 1,059 (24.9%) |
| $100,000 to $149,999 | 507 (9.8%) | 642 (15.1%) |
| $150,000 or more | 284 (5.5%) | 676 (15.9%) |
| Total | 5,179 (100.0%) | 4,252 (100.0%) |
Property Value to Household Income Ratio in Ashe County
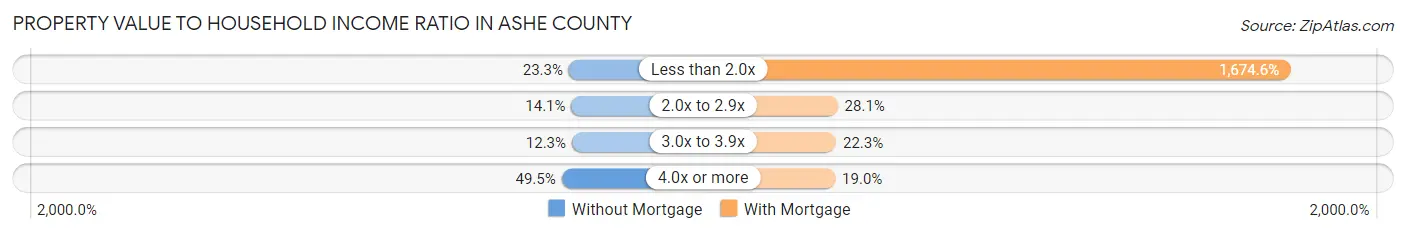
| Value-to-Income Ratio | Without Mortgage | With Mortgage |
| Less than 2.0x | 1,209 (23.3%) | 71,204 (1,674.6%) |
| 2.0x to 2.9x | 728 (14.1%) | 1,196 (28.1%) |
| 3.0x to 3.9x | 638 (12.3%) | 947 (22.3%) |
| 4.0x or more | 2,565 (49.5%) | 808 (19.0%) |
| Total | 5,179 (100.0%) | 4,252 (100.0%) |
Real Estate Taxes by Mortgage Status in Ashe County
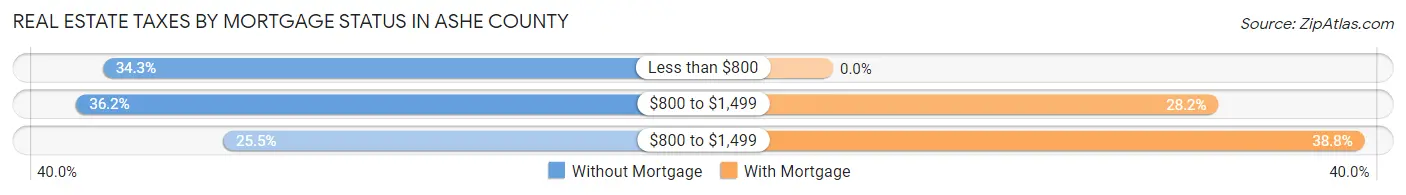
| Property Taxes | Without Mortgage | With Mortgage |
| Less than $800 | 1,776 (34.3%) | 0 (0.0%) |
| $800 to $1,499 | 1,876 (36.2%) | 1,197 (28.1%) |
| $800 to $1,499 | 1,320 (25.5%) | 1,651 (38.8%) |
| Total | 5,179 (100.0%) | 4,252 (100.0%) |
Health & Disability in Ashe County
Health Insurance Coverage by Age in Ashe County
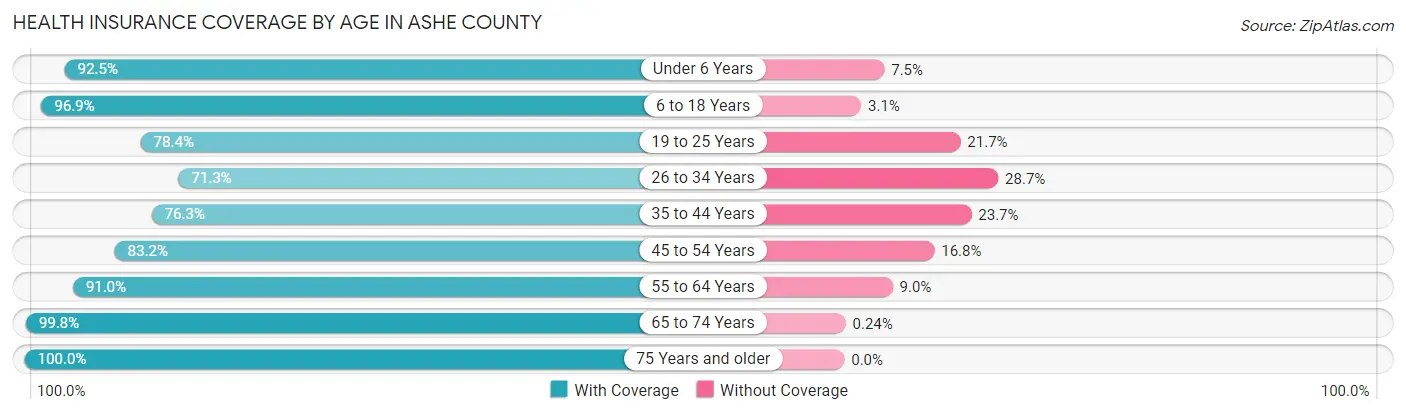
| Age Bracket | With Coverage | Without Coverage |
| Under 6 Years | 1,154 (92.5%) | 93 (7.5%) |
| 6 to 18 Years | 3,495 (96.9%) | 113 (3.1%) |
| 19 to 25 Years | 1,317 (78.3%) | 364 (21.6%) |
| 26 to 34 Years | 1,737 (71.3%) | 699 (28.7%) |
| 35 to 44 Years | 2,213 (76.3%) | 687 (23.7%) |
| 45 to 54 Years | 2,791 (83.2%) | 563 (16.8%) |
| 55 to 64 Years | 3,919 (91.0%) | 388 (9.0%) |
| 65 to 74 Years | 4,120 (99.8%) | 10 (0.2%) |
| 75 Years and older | 2,789 (100.0%) | 0 (0.0%) |
| Total | 23,535 (89.0%) | 2,917 (11.0%) |
Health Insurance Coverage by Citizenship Status in Ashe County
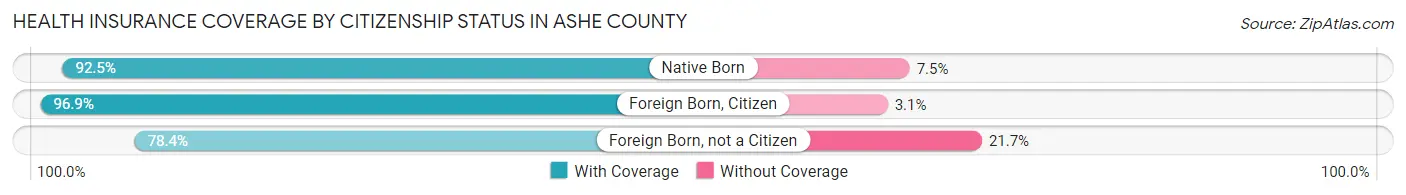
| Citizenship Status | With Coverage | Without Coverage |
| Native Born | 1,154 (92.5%) | 93 (7.5%) |
| Foreign Born, Citizen | 3,495 (96.9%) | 113 (3.1%) |
| Foreign Born, not a Citizen | 1,317 (78.3%) | 364 (21.6%) |
Health Insurance Coverage by Household Income in Ashe County
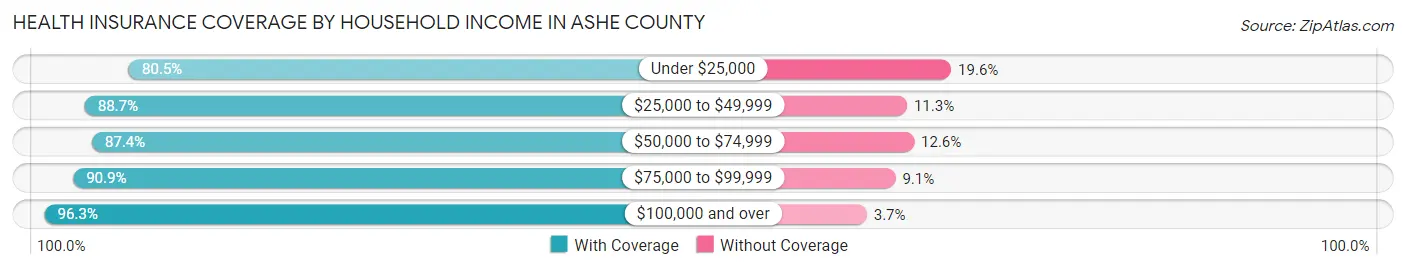
| Household Income | With Coverage | Without Coverage |
| Under $25,000 | 3,682 (80.4%) | 895 (19.6%) |
| $25,000 to $49,999 | 5,656 (88.7%) | 719 (11.3%) |
| $50,000 to $74,999 | 4,830 (87.4%) | 697 (12.6%) |
| $75,000 to $99,999 | 3,200 (90.9%) | 321 (9.1%) |
| $100,000 and over | 6,067 (96.3%) | 236 (3.7%) |
Public vs Private Health Insurance Coverage by Age in Ashe County
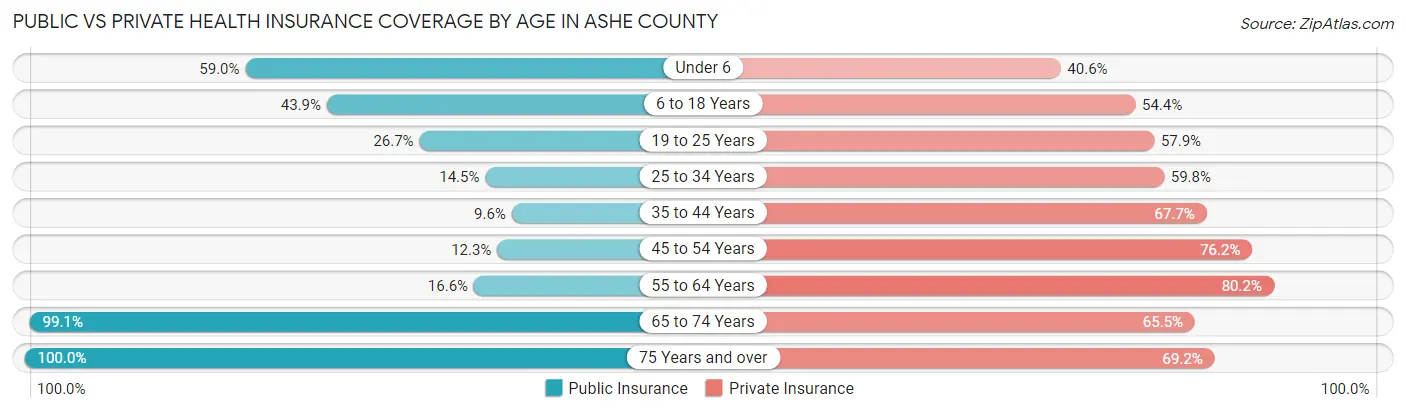
| Age Bracket | Public Insurance | Private Insurance |
| Under 6 | 736 (59.0%) | 506 (40.6%) |
| 6 to 18 Years | 1,584 (43.9%) | 1,964 (54.4%) |
| 19 to 25 Years | 449 (26.7%) | 974 (57.9%) |
| 25 to 34 Years | 353 (14.5%) | 1,456 (59.8%) |
| 35 to 44 Years | 278 (9.6%) | 1,964 (67.7%) |
| 45 to 54 Years | 412 (12.3%) | 2,555 (76.2%) |
| 55 to 64 Years | 715 (16.6%) | 3,453 (80.2%) |
| 65 to 74 Years | 4,091 (99.1%) | 2,707 (65.5%) |
| 75 Years and over | 2,789 (100.0%) | 1,930 (69.2%) |
| Total | 11,407 (43.1%) | 17,509 (66.2%) |
Disability Status by Sex by Age in Ashe County
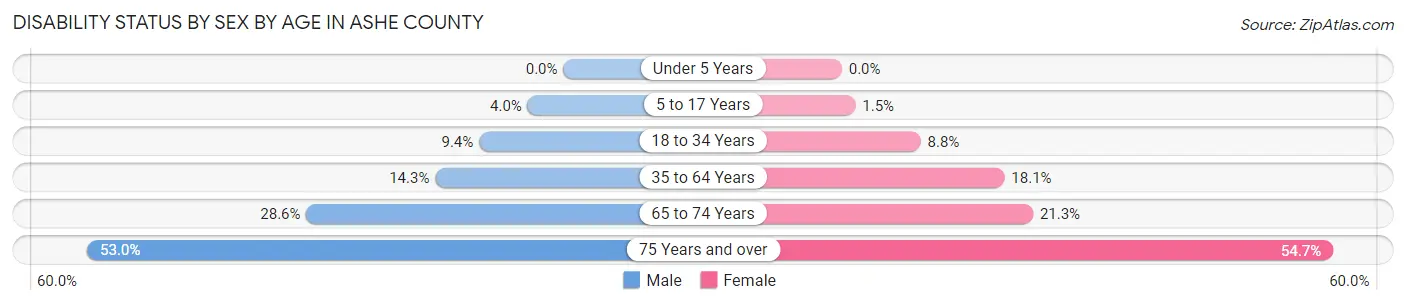
| Age Bracket | Male | Female |
| Under 5 Years | 0 (0.0%) | 0 (0.0%) |
| 5 to 17 Years | 70 (4.0%) | 26 (1.5%) |
| 18 to 34 Years | 211 (9.4%) | 193 (8.8%) |
| 35 to 64 Years | 761 (14.3%) | 947 (18.1%) |
| 65 to 74 Years | 573 (28.6%) | 453 (21.3%) |
| 75 Years and over | 636 (53.0%) | 870 (54.7%) |
Disability Class by Sex by Age in Ashe County
Disability Class: Hearing Difficulty
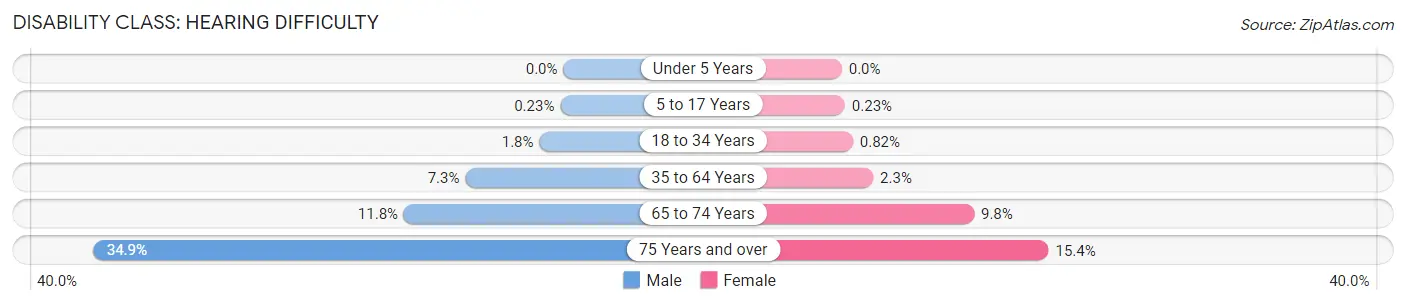
| Age Bracket | Male | Female |
| Under 5 Years | 0 (0.0%) | 0 (0.0%) |
| 5 to 17 Years | 4 (0.2%) | 4 (0.2%) |
| 18 to 34 Years | 40 (1.8%) | 18 (0.8%) |
| 35 to 64 Years | 388 (7.3%) | 122 (2.3%) |
| 65 to 74 Years | 237 (11.8%) | 209 (9.8%) |
| 75 Years and over | 418 (34.9%) | 244 (15.3%) |
Disability Class: Vision Difficulty
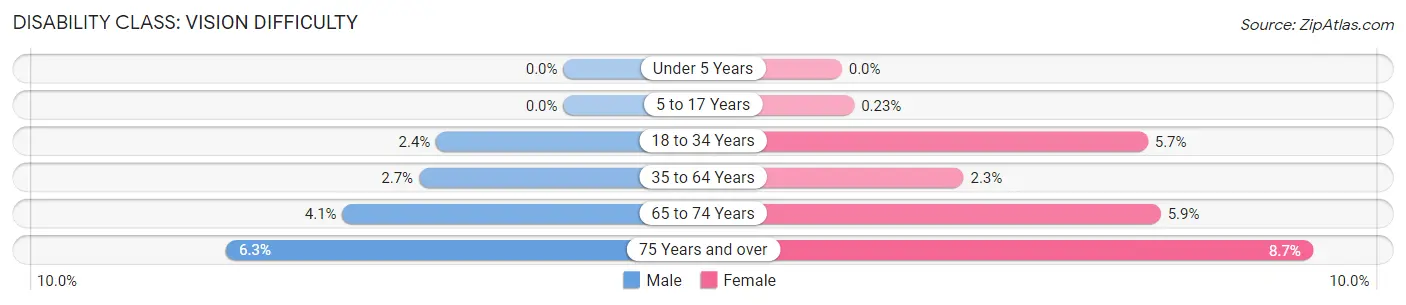
| Age Bracket | Male | Female |
| Under 5 Years | 0 (0.0%) | 0 (0.0%) |
| 5 to 17 Years | 0 (0.0%) | 4 (0.2%) |
| 18 to 34 Years | 53 (2.4%) | 125 (5.7%) |
| 35 to 64 Years | 143 (2.7%) | 118 (2.3%) |
| 65 to 74 Years | 82 (4.1%) | 126 (5.9%) |
| 75 Years and over | 75 (6.3%) | 139 (8.7%) |
Disability Class: Cognitive Difficulty
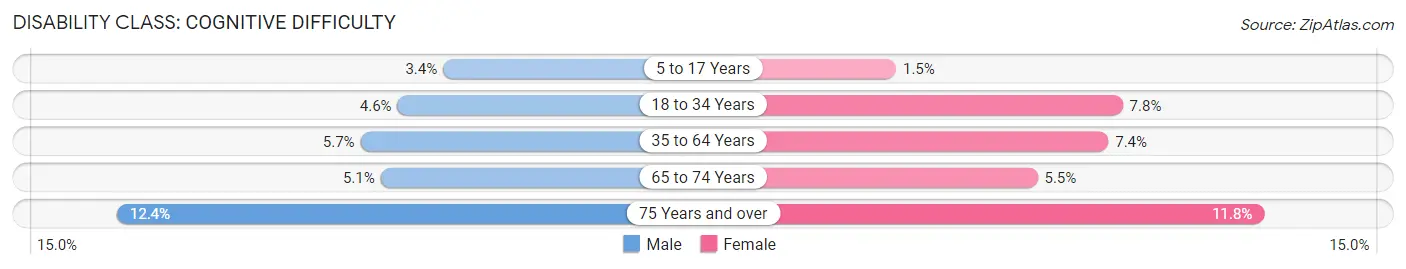
| Age Bracket | Male | Female |
| 5 to 17 Years | 59 (3.4%) | 26 (1.5%) |
| 18 to 34 Years | 104 (4.6%) | 172 (7.8%) |
| 35 to 64 Years | 301 (5.7%) | 388 (7.4%) |
| 65 to 74 Years | 102 (5.1%) | 116 (5.4%) |
| 75 Years and over | 149 (12.4%) | 187 (11.8%) |
Disability Class: Ambulatory Difficulty
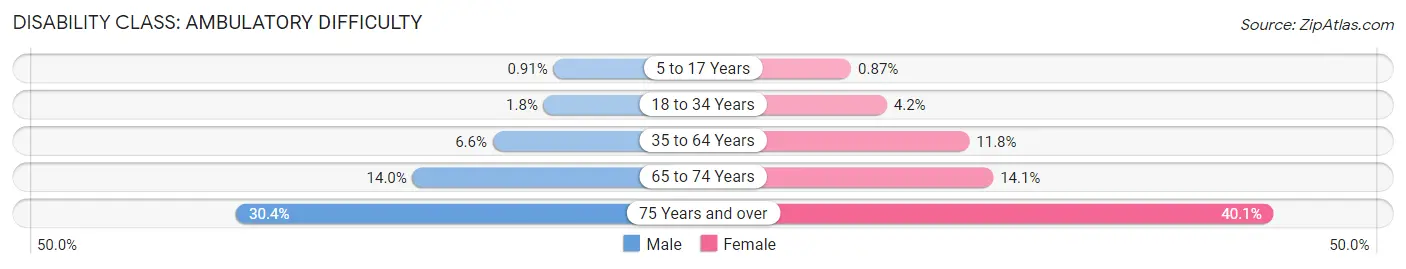
| Age Bracket | Male | Female |
| 5 to 17 Years | 16 (0.9%) | 15 (0.9%) |
| 18 to 34 Years | 41 (1.8%) | 92 (4.2%) |
| 35 to 64 Years | 349 (6.6%) | 619 (11.8%) |
| 65 to 74 Years | 280 (14.0%) | 299 (14.1%) |
| 75 Years and over | 364 (30.4%) | 637 (40.1%) |
Disability Class: Self-Care Difficulty
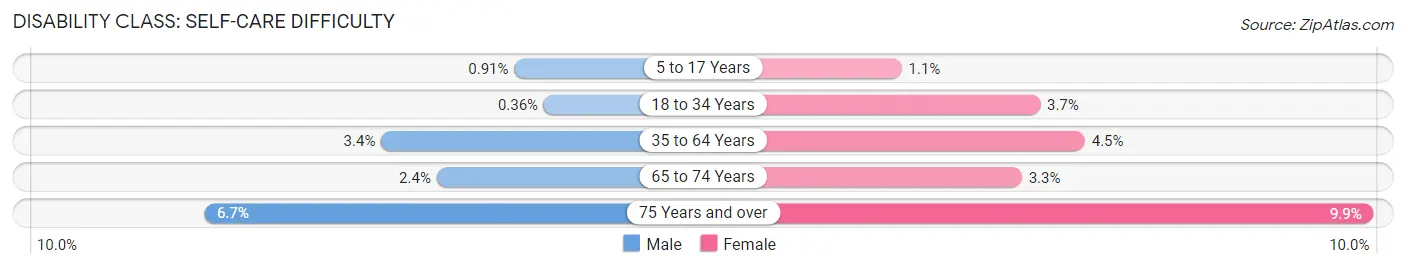
| Age Bracket | Male | Female |
| 5 to 17 Years | 16 (0.9%) | 19 (1.1%) |
| 18 to 34 Years | 8 (0.4%) | 81 (3.7%) |
| 35 to 64 Years | 180 (3.4%) | 236 (4.5%) |
| 65 to 74 Years | 47 (2.4%) | 71 (3.3%) |
| 75 Years and over | 80 (6.7%) | 157 (9.9%) |
Technology Access in Ashe County
Computing Device Access in Ashe County
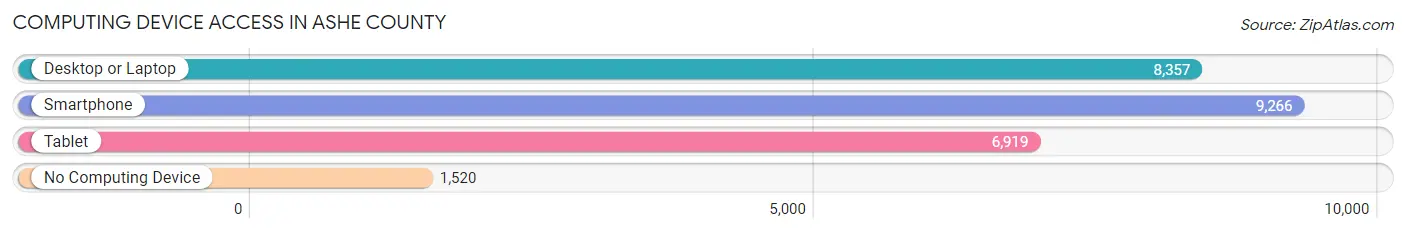
| Device Type | # Households | % Households |
| Desktop or Laptop | 8,357 | 70.7% |
| Smartphone | 9,266 | 78.4% |
| Tablet | 6,919 | 58.5% |
| No Computing Device | 1,520 | 12.9% |
| Total | 11,823 | 100.0% |
Internet Access in Ashe County
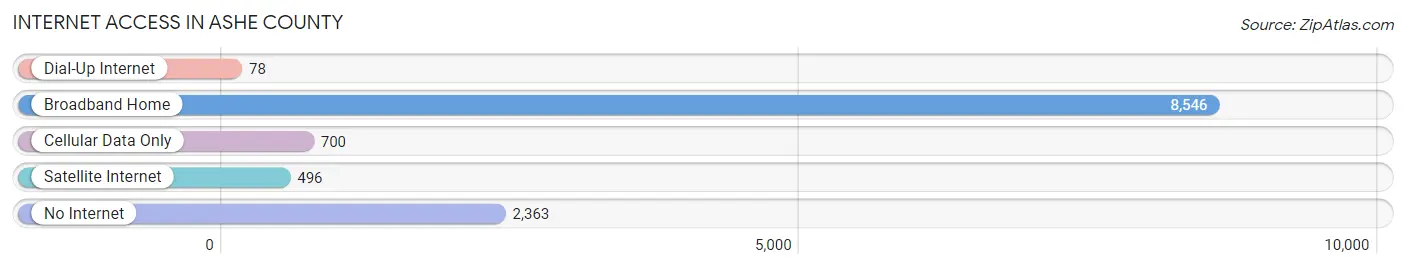
| Internet Type | # Households | % Households |
| Dial-Up Internet | 78 | 0.7% |
| Broadband Home | 8,546 | 72.3% |
| Cellular Data Only | 700 | 5.9% |
| Satellite Internet | 496 | 4.2% |
| No Internet | 2,363 | 20.0% |
| Total | 11,823 | 100.0% |
Ashe County Summary
Ashe County is located in the northwestern corner of North Carolina, and is part of the Blue Ridge Mountains. It is bordered by Alleghany County to the north, Watauga County to the east, Wilkes County to the south, and Johnson County, Tennessee to the west. The county seat is Jefferson, and the largest town is West Jefferson. The county was formed in 1799 from parts of Wilkes County and was named for Samuel Ashe, the Governor of North Carolina from 1795 to 1798.
Geography
Ashe County covers an area of 437 square miles, of which 434 square miles is land and 3 square miles is water. The terrain is mostly mountainous, with the highest point being Mount Jefferson, which has an elevation of 5,499 feet. The county is home to several rivers, including the New River, the Little River, and the North Fork of the New River. The county is also home to several state parks, including Mount Jefferson State Natural Area, New River State Park, and the Blue Ridge Parkway.
Climate
Ashe County has a humid subtropical climate, with hot, humid summers and cold, wet winters. The average annual temperature is 54°F, and the average annual precipitation is 44 inches.
Demographics
As of the 2010 census, Ashe County had a population of 27,281. The racial makeup of the county was 94.3% White, 2.7% Black or African American, 0.5% Native American, 0.3% Asian, 0.1% Pacific Islander, 1.2% from other races, and 1.1% from two or more races. Hispanic or Latino of any race were 2.7% of the population.
Economy
Ashe County's economy is largely based on agriculture, forestry, and tourism. The county is home to several large farms, and the main crops grown are corn, soybeans, hay, and tobacco. The county is also home to several large lumber mills, and the timber industry is a major employer in the area. Tourism is also an important part of the economy, with the county being home to several popular attractions, including the Blue Ridge Parkway, Mount Jefferson State Natural Area, and the New River State Park.
Ashe County is also home to several small businesses, including restaurants, retail stores, and art galleries. The county is also home to several wineries, and the local wine industry is growing.
Conclusion
Ashe County is a rural county located in the northwestern corner of North Carolina. It is home to several rivers, state parks, and other attractions, and its economy is largely based on agriculture, forestry, and tourism. The county is also home to several small businesses, and the local wine industry is growing. The county has a population of 27,281, and the racial makeup of the county is 94.3% White, 2.7% Black or African American, 0.5% Native American, 0.3% Asian, 0.1% Pacific Islander, 1.2% from other races, and 1.1% from two or more races.
Common Questions
What is Per Capita Income in Ashe County?
Per Capita income in Ashe County is $29,683.
What is the Median Family Income in Ashe County?
Median Family Income in Ashe County is $62,380.
What is the Median Household income in Ashe County?
Median Household Income in Ashe County is $49,176.
What is Income or Wage Gap in Ashe County?
Income or Wage Gap in Ashe County is 17.9%.
Women in Ashe County earn 82.1 cents for every dollar earned by a man.
What is Family Income Deficit in Ashe County?
Family Income Deficit in Ashe County is $8,997.
Families that are below poverty line in Ashe County earn $8,997 less on average than the poverty threshold level.
What is Inequality or Gini Index in Ashe County?
Inequality or Gini Index in Ashe County is 0.44.
What is the Total Population of Ashe County?
Total Population of Ashe County is 26,759.
What is the Total Male Population of Ashe County?
Total Male Population of Ashe County is 13,254.
What is the Total Female Population of Ashe County?
Total Female Population of Ashe County is 13,505.
What is the Ratio of Males per 100 Females in Ashe County?
There are 98.14 Males per 100 Females in Ashe County.
What is the Ratio of Females per 100 Males in Ashe County?
There are 101.89 Females per 100 Males in Ashe County.
What is the Median Population Age in Ashe County?
Median Population Age in Ashe County is 49.6 Years.
What is the Average Family Size in Ashe County
Average Family Size in Ashe County is 2.7 People.
What is the Average Household Size in Ashe County
Average Household Size in Ashe County is 2.2 People.
How Large is the Labor Force in Ashe County?
There are 12,362 People in the Labor Forcein in Ashe County.
What is the Percentage of People in the Labor Force in Ashe County?
54.0% of People are in the Labor Force in Ashe County.
What is the Unemployment Rate in Ashe County?
Unemployment Rate in Ashe County is 5.1%.