Anson County, NC Map & Demographics
Anson County Map
Anson County Overview
$22,854
PER CAPITA INCOME
$60,146
AVG FAMILY INCOME
$42,000
AVG HOUSEHOLD INCOME
16.5%
WAGE / INCOME GAP [ % ]
83.5¢/ $1
WAGE / INCOME GAP [ $ ]
$8,154
FAMILY INCOME DEFICIT
0.45
INEQUALITY / GINI INDEX
22,200
TOTAL POPULATION
11,246
MALE POPULATION
10,954
FEMALE POPULATION
102.67
MALES / 100 FEMALES
97.40
FEMALES / 100 MALES
41.1
MEDIAN AGE
3.3
AVG FAMILY SIZE
2.5
AVG HOUSEHOLD SIZE
9,345
LABOR FORCE [ PEOPLE ]
50.8%
PERCENT IN LABOR FORCE
6.4%
UNEMPLOYMENT RATE
Income in Anson County
Income Overview in Anson County
Per Capita Income in Anson County is $22,854, while median incomes of families and households are $60,146 and $42,000 respectively.
| Characteristic | Number | Measure |
| Per Capita Income | 22,200 | $22,854 |
| Median Family Income | 4,830 | $60,146 |
| Mean Family Income | 4,830 | $72,609 |
| Median Household Income | 8,266 | $42,000 |
| Mean Household Income | 8,266 | $56,821 |
| Income Deficit | 4,830 | $8,154 |
| Wage / Income Gap (%) | 22,200 | 16.53% |
| Wage / Income Gap ($) | 22,200 | 83.47¢ per $1 |
| Gini / Inequality Index | 22,200 | 0.45 |
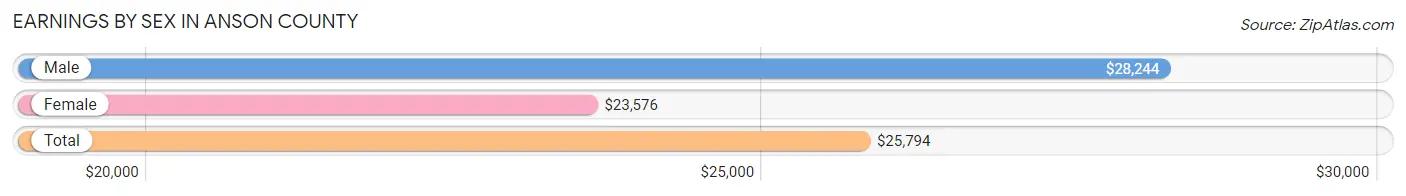
Earnings by Sex in Anson County
Average Earnings in Anson County are $25,794, $28,244 for men and $23,576 for women, a difference of 16.5%.
| Sex | Number | Average Earnings |
| Male | 5,590 (54.1%) | $28,244 |
| Female | 4,739 (45.9%) | $23,576 |
| Total | 10,329 (100.0%) | $25,794 |
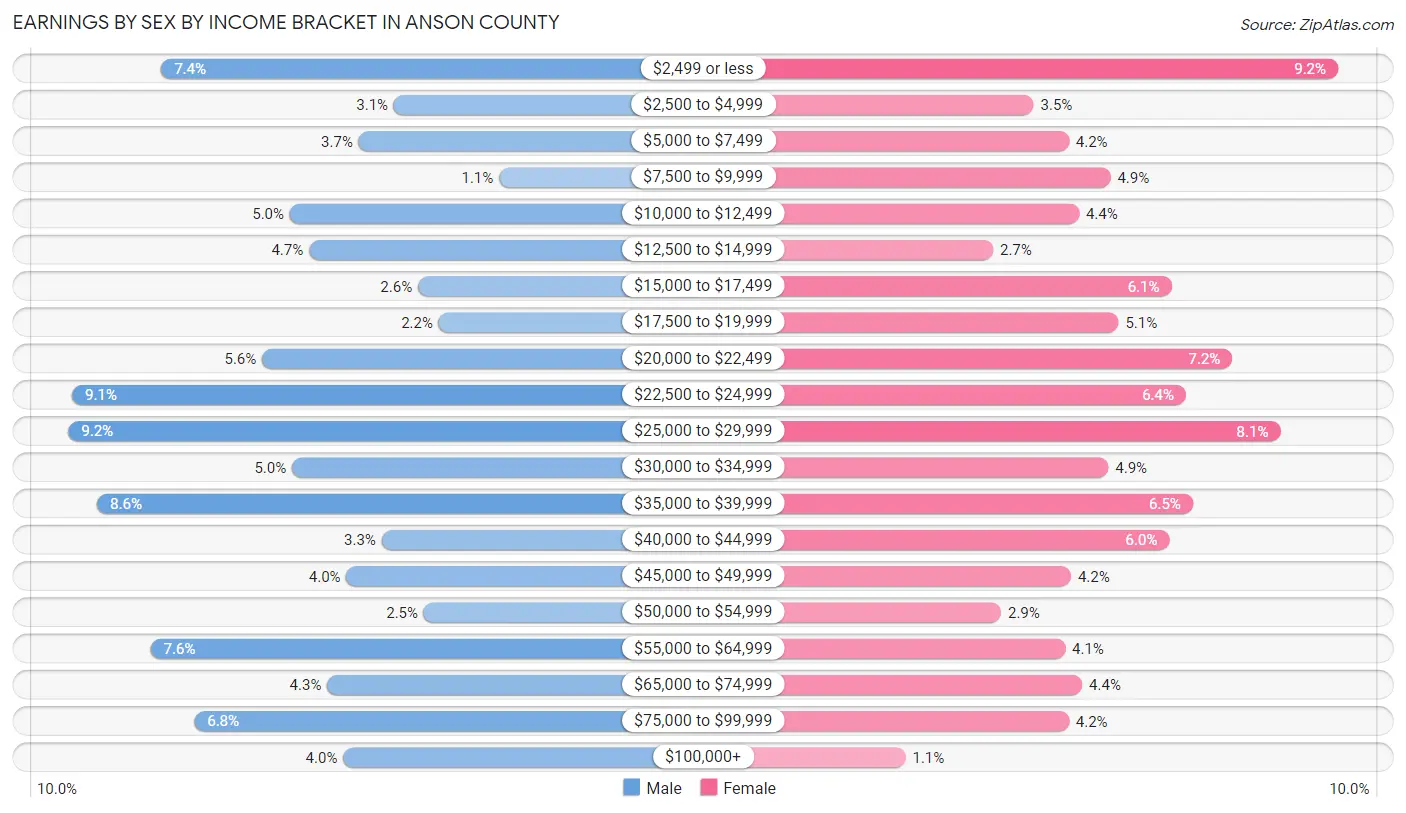
Earnings by Sex by Income Bracket in Anson County
The most common earnings brackets in Anson County are $25,000 to $29,999 for men (513 | 9.2%) and $2,499 or less for women (436 | 9.2%).
| Income | Male | Female |
| $2,499 or less | 416 (7.4%) | 436 (9.2%) |
| $2,500 to $4,999 | 172 (3.1%) | 166 (3.5%) |
| $5,000 to $7,499 | 209 (3.7%) | 197 (4.2%) |
| $7,500 to $9,999 | 62 (1.1%) | 234 (4.9%) |
| $10,000 to $12,499 | 281 (5.0%) | 206 (4.3%) |
| $12,500 to $14,999 | 261 (4.7%) | 130 (2.7%) |
| $15,000 to $17,499 | 147 (2.6%) | 288 (6.1%) |
| $17,500 to $19,999 | 125 (2.2%) | 241 (5.1%) |
| $20,000 to $22,499 | 310 (5.6%) | 342 (7.2%) |
| $22,500 to $24,999 | 509 (9.1%) | 301 (6.4%) |
| $25,000 to $29,999 | 513 (9.2%) | 385 (8.1%) |
| $30,000 to $34,999 | 279 (5.0%) | 232 (4.9%) |
| $35,000 to $39,999 | 483 (8.6%) | 307 (6.5%) |
| $40,000 to $44,999 | 185 (3.3%) | 286 (6.0%) |
| $45,000 to $49,999 | 222 (4.0%) | 199 (4.2%) |
| $50,000 to $54,999 | 141 (2.5%) | 137 (2.9%) |
| $55,000 to $64,999 | 427 (7.6%) | 194 (4.1%) |
| $65,000 to $74,999 | 242 (4.3%) | 209 (4.4%) |
| $75,000 to $99,999 | 381 (6.8%) | 197 (4.2%) |
| $100,000+ | 225 (4.0%) | 52 (1.1%) |
| Total | 5,590 (100.0%) | 4,739 (100.0%) |
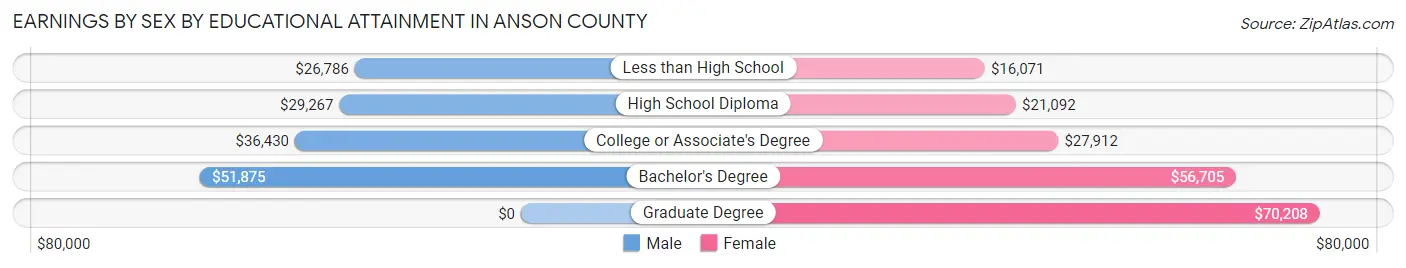
Earnings by Sex by Educational Attainment in Anson County
Average earnings in Anson County are $32,267 for men and $25,969 for women, a difference of 19.5%. Men with an educational attainment of bachelor's degree enjoy the highest average annual earnings of $51,875, while those with less than high school education earn the least with $26,786. Women with an educational attainment of graduate degree earn the most with the average annual earnings of $70,208, while those with less than high school education have the smallest earnings of $16,071.
| Educational Attainment | Male Income | Female Income |
| Less than High School | $26,786 | $16,071 |
| High School Diploma | $29,267 | $21,092 |
| College or Associate's Degree | $36,430 | $27,912 |
| Bachelor's Degree | $51,875 | $56,705 |
| Graduate Degree | - | - |
| Total | $32,267 | $25,969 |
Family Income in Anson County
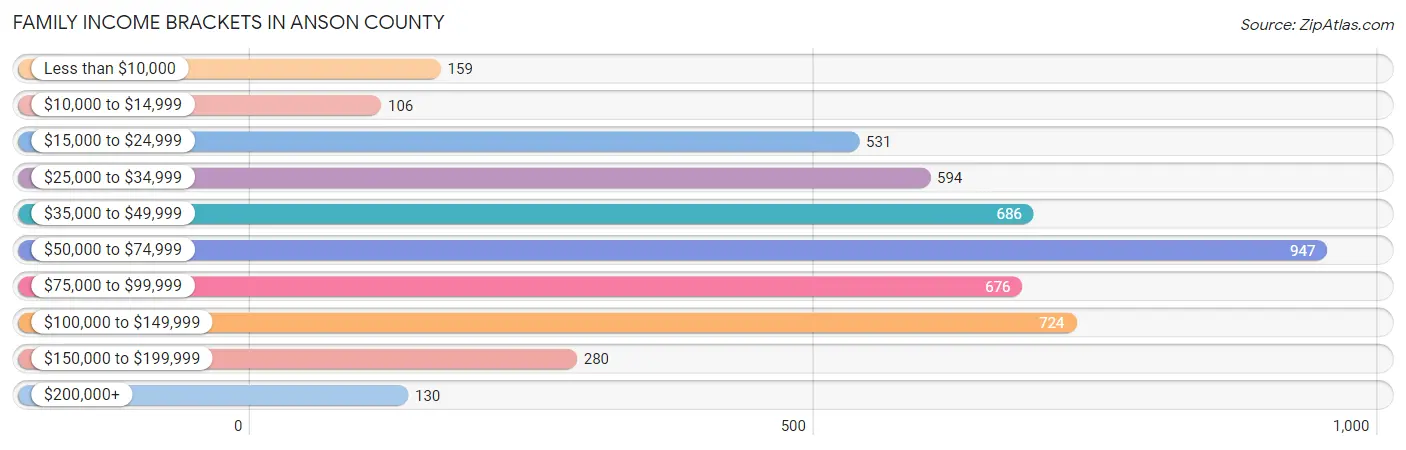
Family Income Brackets in Anson County
According to the Anson County family income data, there are 947 families falling into the $50,000 to $74,999 income range, which is the most common income bracket and makes up 19.6% of all families. Conversely, the $10,000 to $14,999 income bracket is the least frequent group with only 106 families (2.2%) belonging to this category.
| Income Bracket | # Families | % Families |
| Less than $10,000 | 159 | 3.3% |
| $10,000 to $14,999 | 106 | 2.2% |
| $15,000 to $24,999 | 531 | 11.0% |
| $25,000 to $34,999 | 594 | 12.3% |
| $35,000 to $49,999 | 686 | 14.2% |
| $50,000 to $74,999 | 947 | 19.6% |
| $75,000 to $99,999 | 676 | 14.0% |
| $100,000 to $149,999 | 724 | 15.0% |
| $150,000 to $199,999 | 280 | 5.8% |
| $200,000+ | 130 | 2.7% |
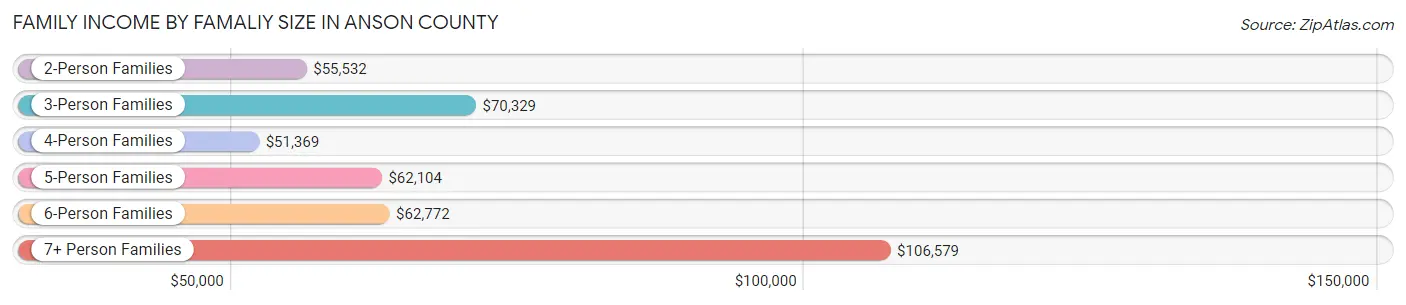
Family Income by Famaliy Size in Anson County
7+ person families (56 | 1.2%) account for the highest median family income in Anson County with $106,579 per family, while 2-person families (2,322 | 48.1%) have the highest median income of $27,766 per family member.
| Income Bracket | # Families | Median Income |
| 2-Person Families | 2,322 (48.1%) | $55,532 |
| 3-Person Families | 1,164 (24.1%) | $70,329 |
| 4-Person Families | 847 (17.5%) | $51,369 |
| 5-Person Families | 321 (6.7%) | $62,104 |
| 6-Person Families | 120 (2.5%) | $62,772 |
| 7+ Person Families | 56 (1.2%) | $106,579 |
| Total | 4,830 (100.0%) | $60,146 |
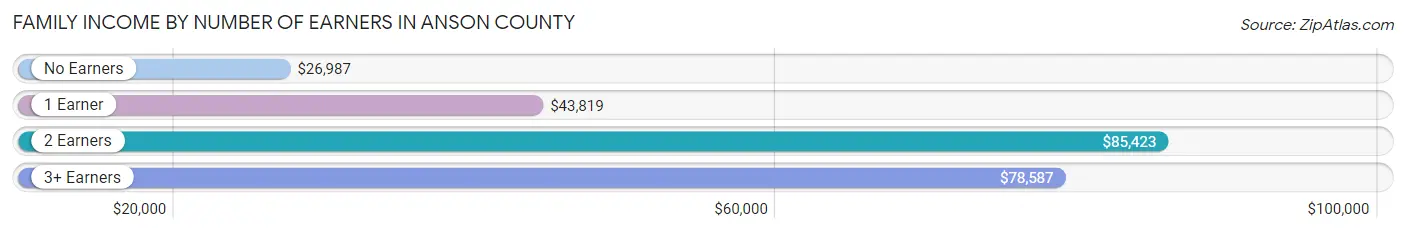
Family Income by Number of Earners in Anson County
The median family income in Anson County is $60,146, with families comprising 2 earners (1,831) having the highest median family income of $85,423, while families with no earners (1,026) have the lowest median family income of $26,987, accounting for 37.9% and 21.2% of families, respectively.
| Number of Earners | # Families | Median Income |
| No Earners | 1,026 (21.2%) | $26,987 |
| 1 Earner | 1,497 (31.0%) | $43,819 |
| 2 Earners | 1,831 (37.9%) | $85,423 |
| 3+ Earners | 476 (9.9%) | $78,587 |
| Total | 4,830 (100.0%) | $60,146 |
Household Income in Anson County
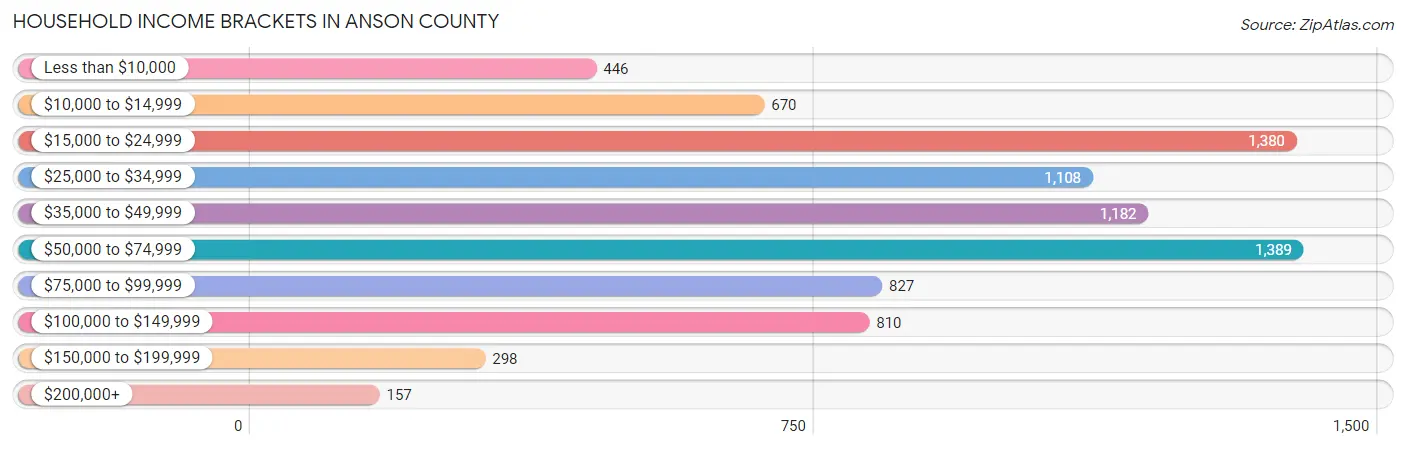
Household Income Brackets in Anson County
With 1,389 households falling in the category, the $50,000 to $74,999 income range is the most frequent in Anson County, accounting for 16.8% of all households. In contrast, only 157 households (1.9%) fall into the $200,000+ income bracket, making it the least populous group.
| Income Bracket | # Households | % Households |
| Less than $10,000 | 446 | 5.4% |
| $10,000 to $14,999 | 670 | 8.1% |
| $15,000 to $24,999 | 1,380 | 16.7% |
| $25,000 to $34,999 | 1,108 | 13.4% |
| $35,000 to $49,999 | 1,182 | 14.3% |
| $50,000 to $74,999 | 1,389 | 16.8% |
| $75,000 to $99,999 | 827 | 10.0% |
| $100,000 to $149,999 | 810 | 9.8% |
| $150,000 to $199,999 | 298 | 3.6% |
| $200,000+ | 157 | 1.9% |
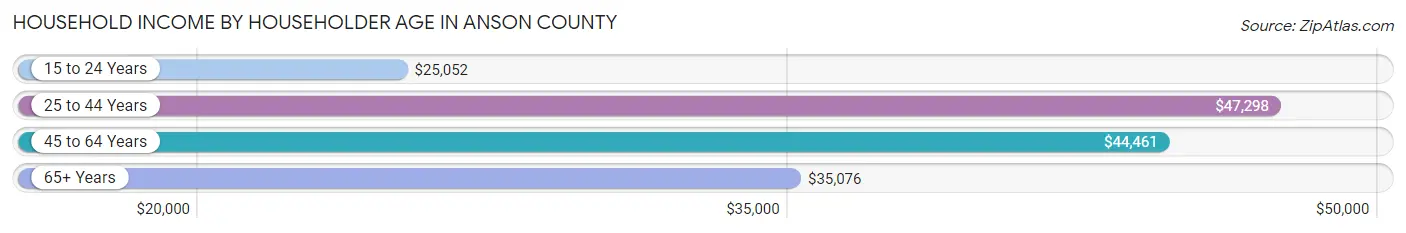
Household Income by Householder Age in Anson County
The median household income in Anson County is $42,000, with the highest median household income of $47,298 found in the 25 to 44 years age bracket for the primary householder. A total of 1,997 households (24.2%) fall into this category. Meanwhile, the 15 to 24 years age bracket for the primary householder has the lowest median household income of $25,052, with 168 households (2.0%) in this group.
| Income Bracket | # Households | Median Income |
| 15 to 24 Years | 168 (2.0%) | $25,052 |
| 25 to 44 Years | 1,997 (24.2%) | $47,298 |
| 45 to 64 Years | 3,120 (37.7%) | $44,461 |
| 65+ Years | 2,981 (36.1%) | $35,076 |
| Total | 8,266 (100.0%) | $42,000 |
Poverty in Anson County
Income Below Poverty by Sex and Age in Anson County
With 17.9% poverty level for males and 20.8% for females among the residents of Anson County, 16 and 17 year old males and 5 year old females are the most vulnerable to poverty, with 209 males (68.1%) and 52 females (40.3%) in their respective age groups living below the poverty level.
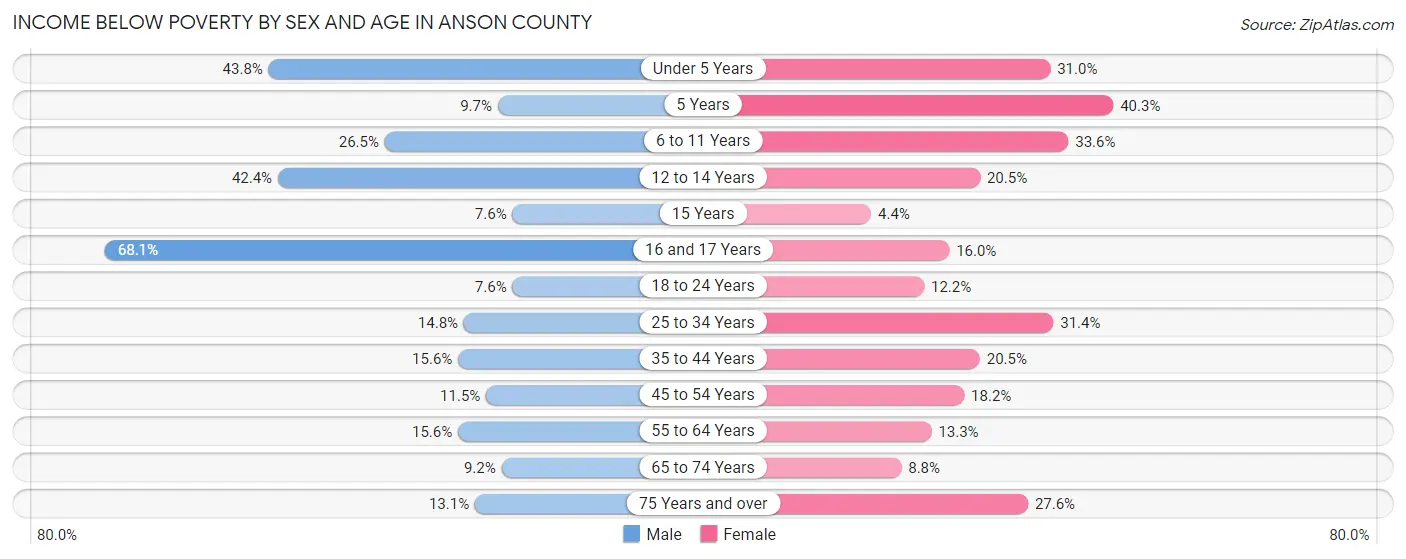
| Age Bracket | Male | Female |
| Under 5 Years | 221 (43.8%) | 169 (30.9%) |
| 5 Years | 11 (9.7%) | 52 (40.3%) |
| 6 to 11 Years | 176 (26.5%) | 304 (33.6%) |
| 12 to 14 Years | 178 (42.4%) | 63 (20.5%) |
| 15 Years | 8 (7.5%) | 2 (4.3%) |
| 16 and 17 Years | 209 (68.1%) | 52 (16.0%) |
| 18 to 24 Years | 84 (7.5%) | 90 (12.2%) |
| 25 to 34 Years | 206 (14.8%) | 321 (31.4%) |
| 35 to 44 Years | 189 (15.6%) | 209 (20.5%) |
| 45 to 54 Years | 135 (11.5%) | 221 (18.2%) |
| 55 to 64 Years | 215 (15.6%) | 193 (13.3%) |
| 65 to 74 Years | 104 (9.2%) | 111 (8.8%) |
| 75 Years and over | 84 (13.1%) | 306 (27.6%) |
| Total | 1,820 (17.9%) | 2,093 (20.8%) |
Income Above Poverty by Sex and Age in Anson County
According to the poverty statistics in Anson County, males aged 15 years and females aged 15 years are the age groups that are most secure financially, with 92.4% of males and 95.7% of females in these age groups living above the poverty line.
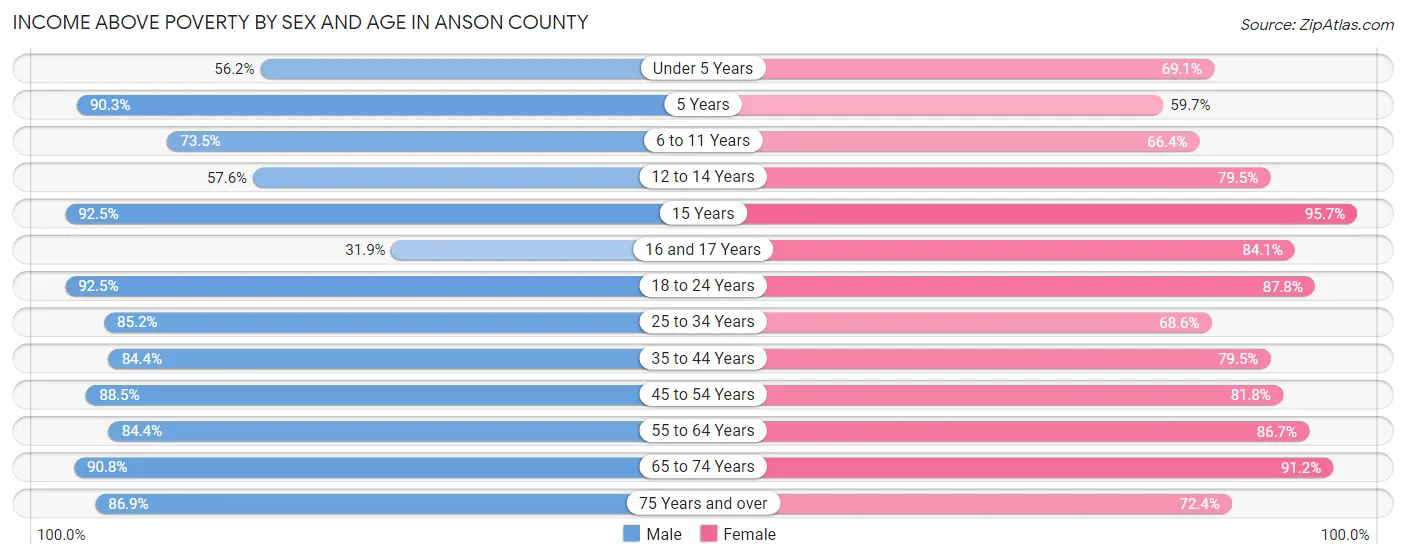
| Age Bracket | Male | Female |
| Under 5 Years | 284 (56.2%) | 377 (69.1%) |
| 5 Years | 102 (90.3%) | 77 (59.7%) |
| 6 to 11 Years | 488 (73.5%) | 600 (66.4%) |
| 12 to 14 Years | 242 (57.6%) | 244 (79.5%) |
| 15 Years | 98 (92.4%) | 44 (95.7%) |
| 16 and 17 Years | 98 (31.9%) | 274 (84.1%) |
| 18 to 24 Years | 1,028 (92.4%) | 647 (87.8%) |
| 25 to 34 Years | 1,189 (85.2%) | 701 (68.6%) |
| 35 to 44 Years | 1,021 (84.4%) | 811 (79.5%) |
| 45 to 54 Years | 1,043 (88.5%) | 995 (81.8%) |
| 55 to 64 Years | 1,160 (84.4%) | 1,257 (86.7%) |
| 65 to 74 Years | 1,029 (90.8%) | 1,146 (91.2%) |
| 75 Years and over | 556 (86.9%) | 801 (72.4%) |
| Total | 8,338 (82.1%) | 7,974 (79.2%) |
Income Below Poverty Among Married-Couple Families in Anson County
The poverty statistics for married-couple families in Anson County show that 6.8% or 206 of the total 3,040 families live below the poverty line. Families with 3 or 4 children have the highest poverty rate of 25.5%, comprising of 50 families. On the other hand, families with 5 or more children have the lowest poverty rate of 0.0%, which includes 0 families.
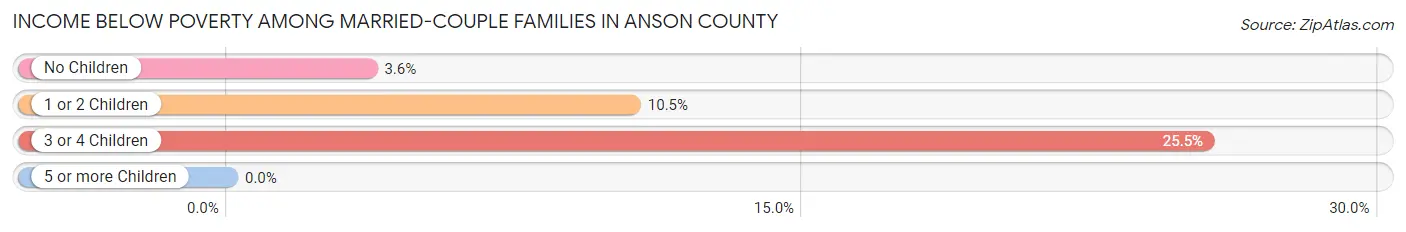
| Children | Above Poverty | Below Poverty |
| No Children | 1,988 (96.4%) | 75 (3.6%) |
| 1 or 2 Children | 689 (89.5%) | 81 (10.5%) |
| 3 or 4 Children | 146 (74.5%) | 50 (25.5%) |
| 5 or more Children | 11 (100.0%) | 0 (0.0%) |
| Total | 2,834 (93.2%) | 206 (6.8%) |
Income Below Poverty Among Single-Parent Households in Anson County
According to the poverty data in Anson County, 12.7% or 35 single-father households and 31.3% or 474 single-mother households are living below the poverty line. Among single-father households, those with 1 or 2 children have the highest poverty rate, with 19 households (18.4%) experiencing poverty. Likewise, among single-mother households, those with 3 or 4 children have the highest poverty rate, with 149 households (83.7%) falling below the poverty line.
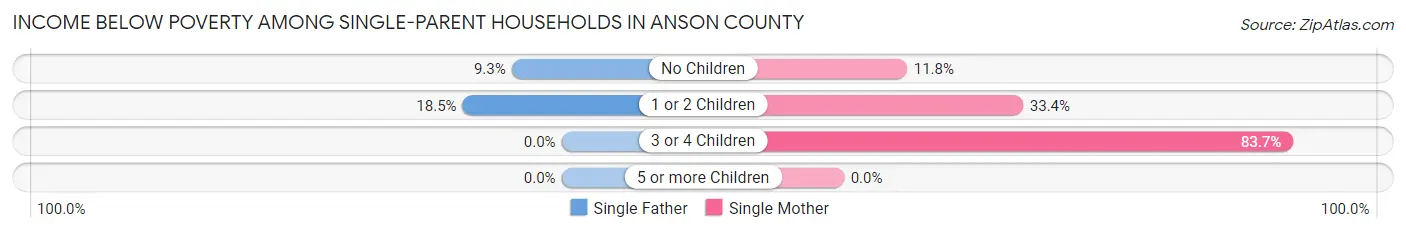
| Children | Single Father | Single Mother |
| No Children | 16 (9.3%) | 66 (11.8%) |
| 1 or 2 Children | 19 (18.4%) | 259 (33.4%) |
| 3 or 4 Children | 0 (0.0%) | 149 (83.7%) |
| 5 or more Children | 0 (0.0%) | 0 (0.0%) |
| Total | 35 (12.7%) | 474 (31.3%) |
Income Below Poverty Among Married-Couple vs Single-Parent Households in Anson County
The poverty data for Anson County shows that 206 of the married-couple family households (6.8%) and 509 of the single-parent households (28.4%) are living below the poverty level. Within the married-couple family households, those with 3 or 4 children have the highest poverty rate, with 50 households (25.5%) falling below the poverty line. Among the single-parent households, those with 3 or 4 children have the highest poverty rate, with 149 household (83.7%) living below poverty.
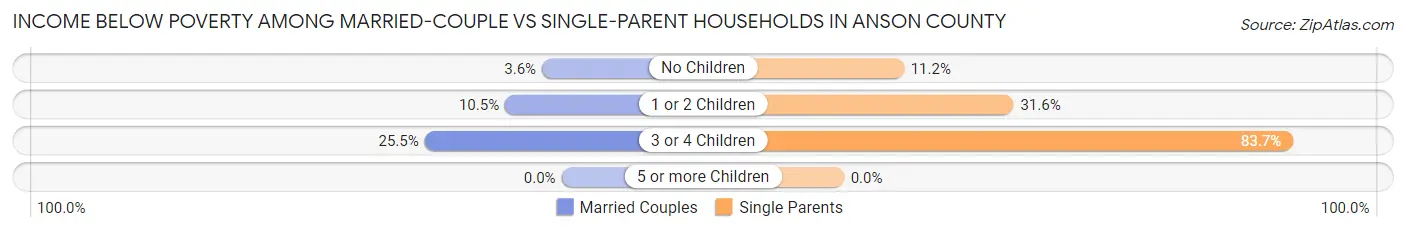
| Children | Married-Couple Families | Single-Parent Households |
| No Children | 75 (3.6%) | 82 (11.2%) |
| 1 or 2 Children | 81 (10.5%) | 278 (31.6%) |
| 3 or 4 Children | 50 (25.5%) | 149 (83.7%) |
| 5 or more Children | 0 (0.0%) | 0 (0.0%) |
| Total | 206 (6.8%) | 509 (28.4%) |
Race in Anson County
The most populous races in Anson County are Black / African American (10,652 | 48.0%), White / Caucasian (10,218 | 46.0%), and Hispanic or Latino (1,012 | 4.6%).
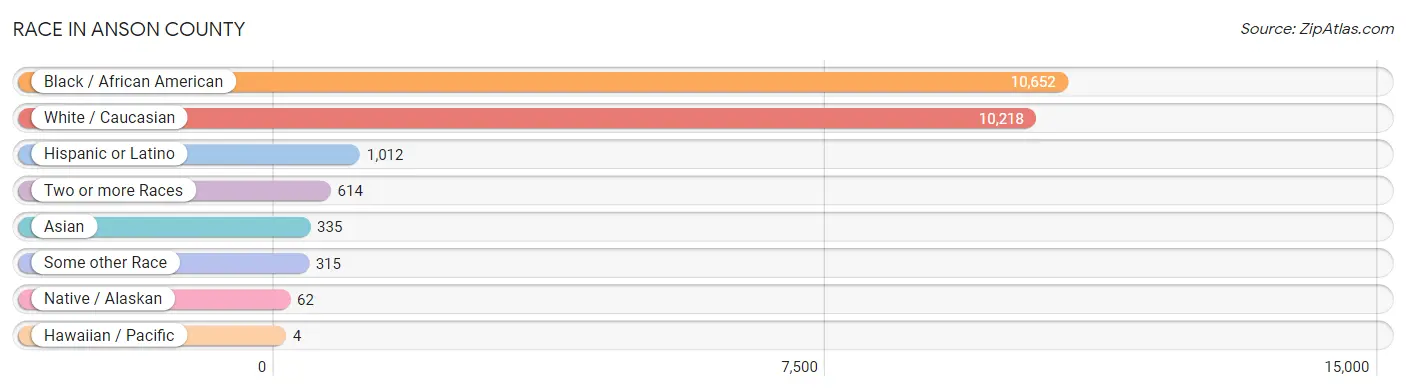
| Race | # Population | % Population |
| Asian | 335 | 1.5% |
| Black / African American | 10,652 | 48.0% |
| Hawaiian / Pacific | 4 | 0.0% |
| Hispanic or Latino | 1,012 | 4.6% |
| Native / Alaskan | 62 | 0.3% |
| White / Caucasian | 10,218 | 46.0% |
| Two or more Races | 614 | 2.8% |
| Some other Race | 315 | 1.4% |
| Total | 22,200 | 100.0% |
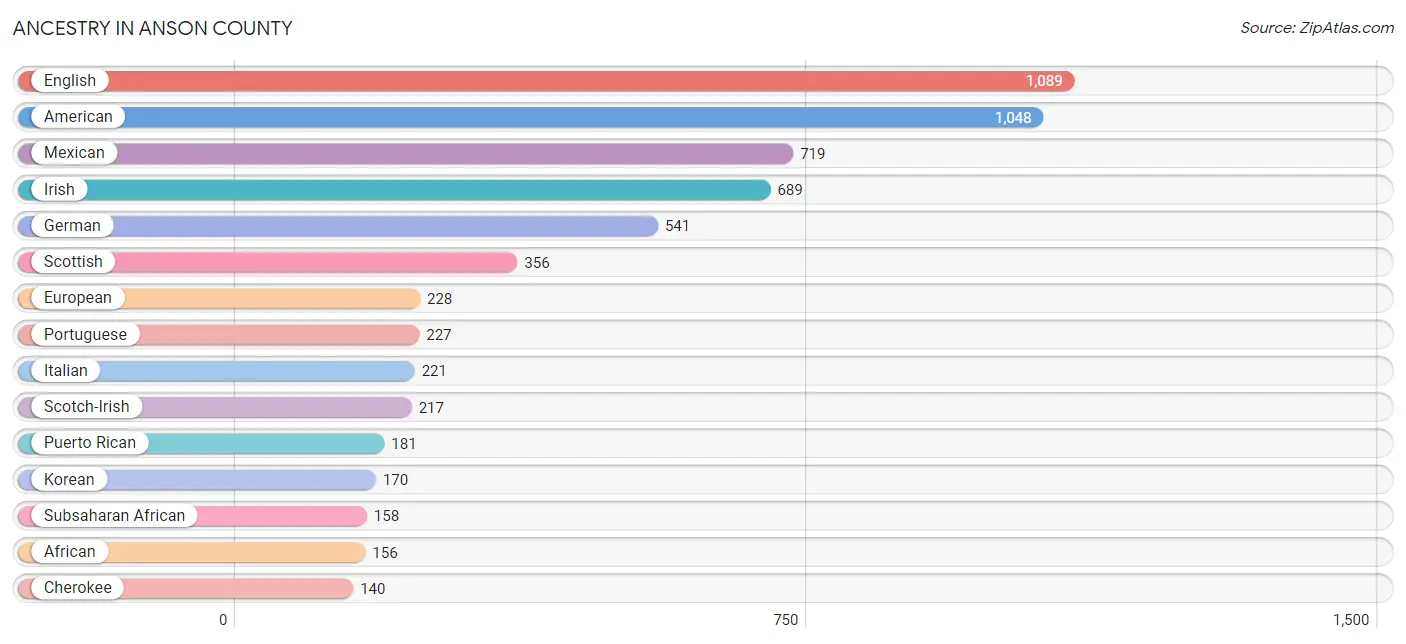
Ancestry in Anson County
The most populous ancestries reported in Anson County are English (1,089 | 4.9%), American (1,048 | 4.7%), Mexican (719 | 3.2%), Irish (689 | 3.1%), and German (541 | 2.4%), together accounting for 18.4% of all Anson County residents.
| Ancestry | # Population | % Population |
| African | 156 | 0.7% |
| American | 1,048 | 4.7% |
| Arab | 8 | 0.0% |
| Austrian | 5 | 0.0% |
| Bahamian | 8 | 0.0% |
| Bhutanese | 36 | 0.2% |
| British | 62 | 0.3% |
| Burmese | 119 | 0.5% |
| Central American | 52 | 0.2% |
| Cherokee | 140 | 0.6% |
| Colombian | 14 | 0.1% |
| Cuban | 5 | 0.0% |
| Dominican | 4 | 0.0% |
| Dutch | 16 | 0.1% |
| English | 1,089 | 4.9% |
| European | 228 | 1.0% |
| French | 36 | 0.2% |
| French Canadian | 11 | 0.1% |
| German | 541 | 2.4% |
| Greek | 15 | 0.1% |
| Honduran | 19 | 0.1% |
| Iranian | 26 | 0.1% |
| Irish | 689 | 3.1% |
| Italian | 221 | 1.0% |
| Jamaican | 46 | 0.2% |
| Korean | 170 | 0.8% |
| Lumbee | 36 | 0.2% |
| Macedonian | 4 | 0.0% |
| Mexican | 719 | 3.2% |
| Moroccan | 8 | 0.0% |
| Native Hawaiian | 4 | 0.0% |
| Nigerian | 2 | 0.0% |
| Northern European | 9 | 0.0% |
| Norwegian | 1 | 0.0% |
| Panamanian | 33 | 0.2% |
| Polish | 33 | 0.2% |
| Portuguese | 227 | 1.0% |
| Puerto Rican | 181 | 0.8% |
| Russian | 11 | 0.1% |
| Scandinavian | 12 | 0.1% |
| Scotch-Irish | 217 | 1.0% |
| Scottish | 356 | 1.6% |
| Sioux | 11 | 0.1% |
| South American | 14 | 0.1% |
| Spanish | 21 | 0.1% |
| Subsaharan African | 158 | 0.7% |
| Swedish | 25 | 0.1% |
| Swiss | 10 | 0.1% |
| Thai | 43 | 0.2% |
| Ukrainian | 14 | 0.1% |
| Welsh | 102 | 0.5% | View All 51 Rows |
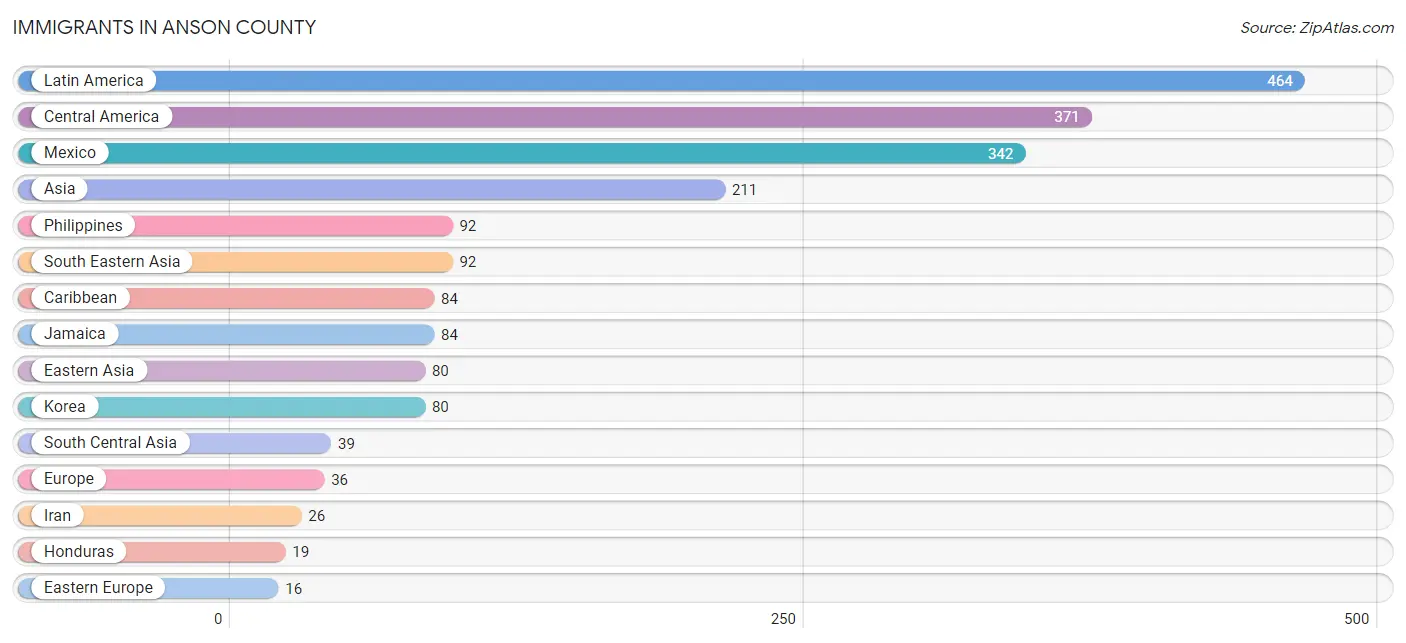
Immigrants in Anson County
The most numerous immigrant groups reported in Anson County came from Latin America (464 | 2.1%), Central America (371 | 1.7%), Mexico (342 | 1.5%), Asia (211 | 0.9%), and Philippines (92 | 0.4%), together accounting for 6.7% of all Anson County residents.
| Immigration Origin | # Population | % Population |
| Africa | 9 | 0.0% |
| Asia | 211 | 0.9% |
| Canada | 11 | 0.1% |
| Caribbean | 84 | 0.4% |
| Central America | 371 | 1.7% |
| Colombia | 9 | 0.0% |
| Eastern Asia | 80 | 0.4% |
| Eastern Europe | 16 | 0.1% |
| Europe | 36 | 0.2% |
| Germany | 14 | 0.1% |
| Honduras | 19 | 0.1% |
| India | 13 | 0.1% |
| Iran | 26 | 0.1% |
| Jamaica | 84 | 0.4% |
| Korea | 80 | 0.4% |
| Latin America | 464 | 2.1% |
| Mexico | 342 | 1.5% |
| Nigeria | 3 | 0.0% |
| Northern Africa | 6 | 0.0% |
| Northern Europe | 6 | 0.0% |
| Panama | 10 | 0.1% |
| Philippines | 92 | 0.4% |
| Poland | 5 | 0.0% |
| Russia | 11 | 0.1% |
| South America | 9 | 0.0% |
| South Central Asia | 39 | 0.2% |
| South Eastern Asia | 92 | 0.4% |
| Western Africa | 3 | 0.0% |
| Western Europe | 14 | 0.1% | View All 29 Rows |
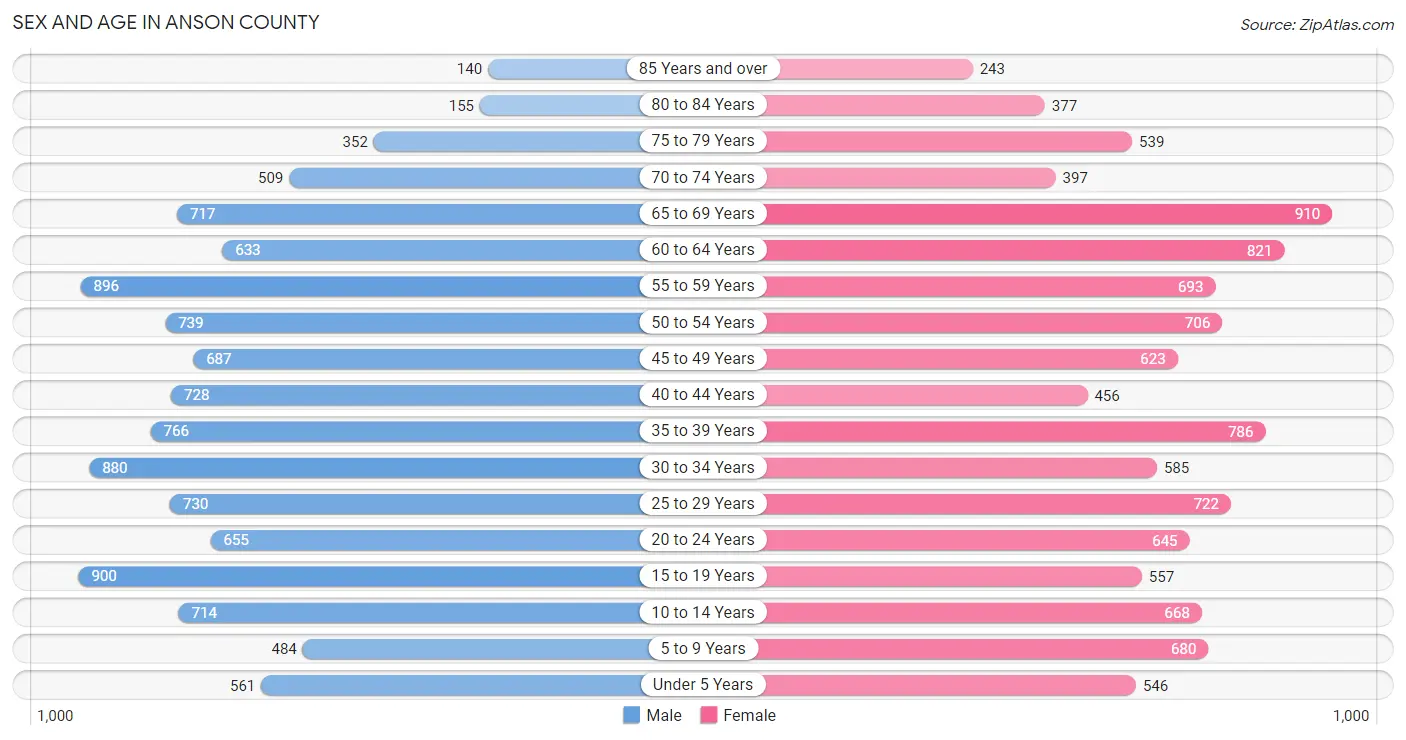
Sex and Age in Anson County
Sex and Age in Anson County
The most populous age groups in Anson County are 15 to 19 Years (900 | 8.0%) for men and 65 to 69 Years (910 | 8.3%) for women.
| Age Bracket | Male | Female |
| Under 5 Years | 561 (5.0%) | 546 (5.0%) |
| 5 to 9 Years | 484 (4.3%) | 680 (6.2%) |
| 10 to 14 Years | 714 (6.4%) | 668 (6.1%) |
| 15 to 19 Years | 900 (8.0%) | 557 (5.1%) |
| 20 to 24 Years | 655 (5.8%) | 645 (5.9%) |
| 25 to 29 Years | 730 (6.5%) | 722 (6.6%) |
| 30 to 34 Years | 880 (7.8%) | 585 (5.3%) |
| 35 to 39 Years | 766 (6.8%) | 786 (7.2%) |
| 40 to 44 Years | 728 (6.5%) | 456 (4.2%) |
| 45 to 49 Years | 687 (6.1%) | 623 (5.7%) |
| 50 to 54 Years | 739 (6.6%) | 706 (6.5%) |
| 55 to 59 Years | 896 (8.0%) | 693 (6.3%) |
| 60 to 64 Years | 633 (5.6%) | 821 (7.5%) |
| 65 to 69 Years | 717 (6.4%) | 910 (8.3%) |
| 70 to 74 Years | 509 (4.5%) | 397 (3.6%) |
| 75 to 79 Years | 352 (3.1%) | 539 (4.9%) |
| 80 to 84 Years | 155 (1.4%) | 377 (3.4%) |
| 85 Years and over | 140 (1.2%) | 243 (2.2%) |
| Total | 11,246 (100.0%) | 10,954 (100.0%) |
Families and Households in Anson County
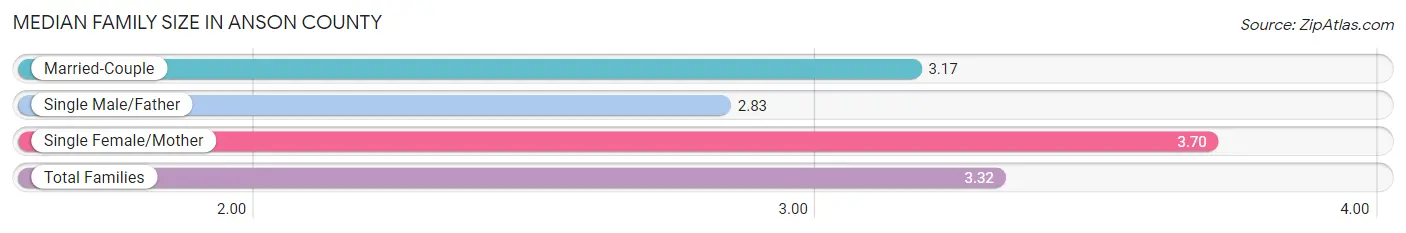
Median Family Size in Anson County
The median family size in Anson County is 3.32 persons per family, with single female/mother families (1,515 | 31.4%) accounting for the largest median family size of 3.7 persons per family. On the other hand, single male/father families (275 | 5.7%) represent the smallest median family size with 2.83 persons per family.
| Family Type | # Families | Family Size |
| Married-Couple | 3,040 (62.9%) | 3.17 |
| Single Male/Father | 275 (5.7%) | 2.83 |
| Single Female/Mother | 1,515 (31.4%) | 3.70 |
| Total Families | 4,830 (100.0%) | 3.32 |
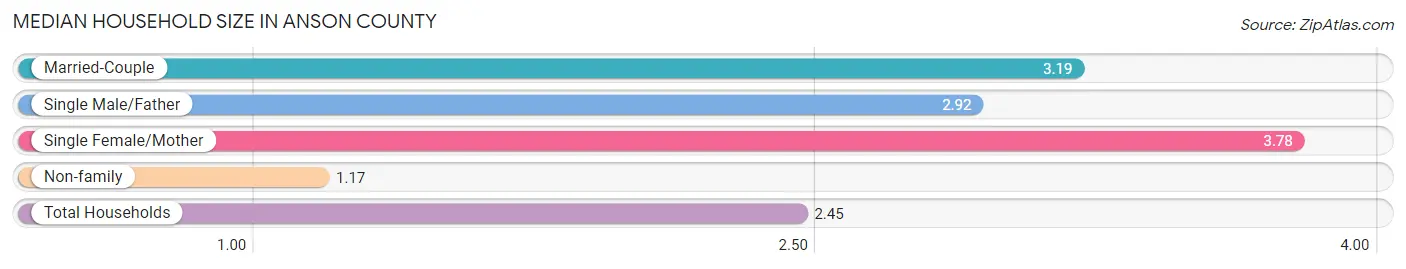
Median Household Size in Anson County
The median household size in Anson County is 2.45 persons per household, with single female/mother households (1,515 | 18.3%) accounting for the largest median household size of 3.78 persons per household. non-family households (3,436 | 41.6%) represent the smallest median household size with 1.17 persons per household.
| Household Type | # Households | Household Size |
| Married-Couple | 3,040 (36.8%) | 3.19 |
| Single Male/Father | 275 (3.3%) | 2.92 |
| Single Female/Mother | 1,515 (18.3%) | 3.78 |
| Non-family | 3,436 (41.6%) | 1.17 |
| Total Households | 8,266 (100.0%) | 2.45 |
Household Size by Marriage Status in Anson County
Out of a total of 8,266 households in Anson County, 4,830 (58.4%) are family households, while 3,436 (41.6%) are nonfamily households. The most numerous type of family households are 2-person households, comprising 2,283, and the most common type of nonfamily households are 1-person households, comprising 2,949.
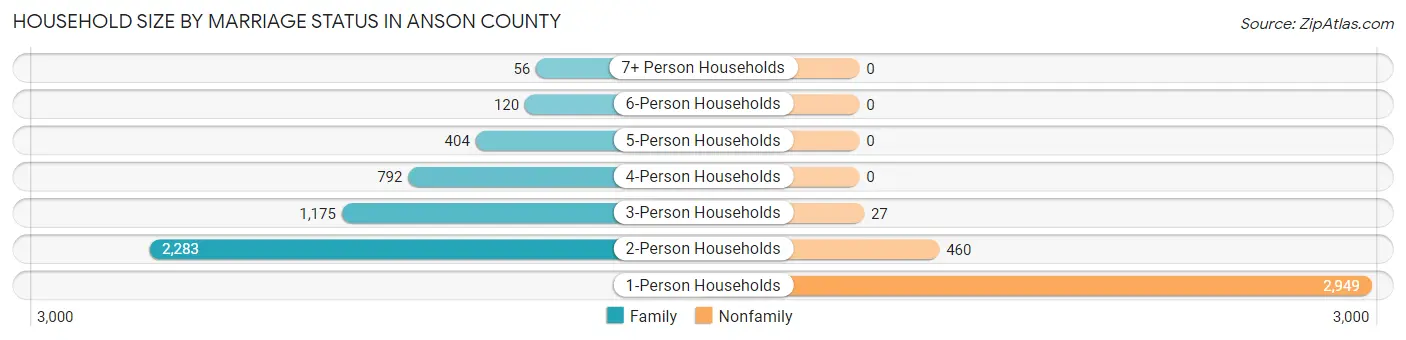
| Household Size | Family Households | Nonfamily Households |
| 1-Person Households | - | 2,949 (35.7%) |
| 2-Person Households | 2,283 (27.6%) | 460 (5.6%) |
| 3-Person Households | 1,175 (14.2%) | 27 (0.3%) |
| 4-Person Households | 792 (9.6%) | 0 (0.0%) |
| 5-Person Households | 404 (4.9%) | 0 (0.0%) |
| 6-Person Households | 120 (1.5%) | 0 (0.0%) |
| 7+ Person Households | 56 (0.7%) | 0 (0.0%) |
| Total | 4,830 (58.4%) | 3,436 (41.6%) |
Female Fertility in Anson County
Fertility by Age in Anson County
Average fertility rate in Anson County is 60.0 births per 1,000 women. Women in the age bracket of 20 to 34 years have the highest fertility rate with 118.0 births per 1,000 women. Women in the age bracket of 20 to 34 years acount for 85.6% of all women with births.
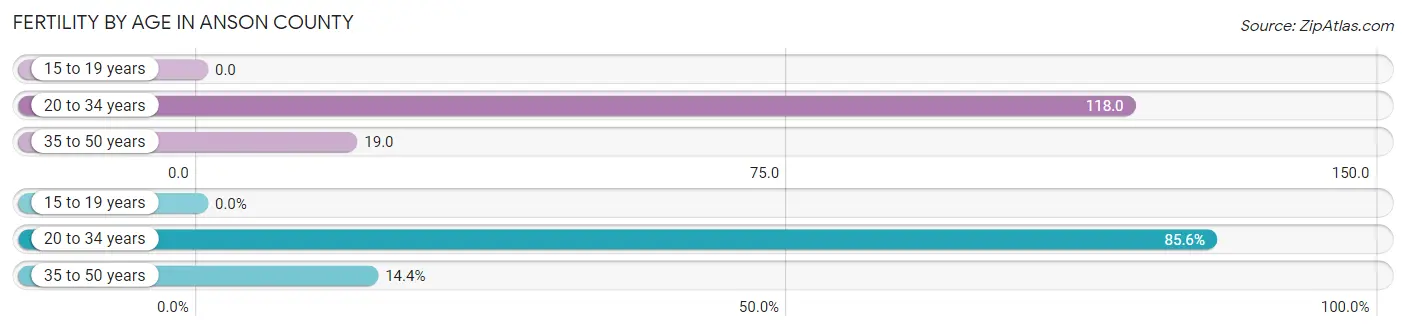
| Age Bracket | Women with Births | Births / 1,000 Women |
| 15 to 19 years | 0 (0.0%) | 0.0 |
| 20 to 34 years | 231 (85.6%) | 118.0 |
| 35 to 50 years | 39 (14.4%) | 19.0 |
| Total | 270 (100.0%) | 60.0 |
Fertility by Age by Marriage Status in Anson County
51.5% of women with births (270) in Anson County are married. The highest percentage of unmarried women with births falls into 20 to 34 years age bracket with 53.7% of them unmarried at the time of birth, while the lowest percentage of unmarried women with births belong to 35 to 50 years age bracket with 17.9% of them unmarried.
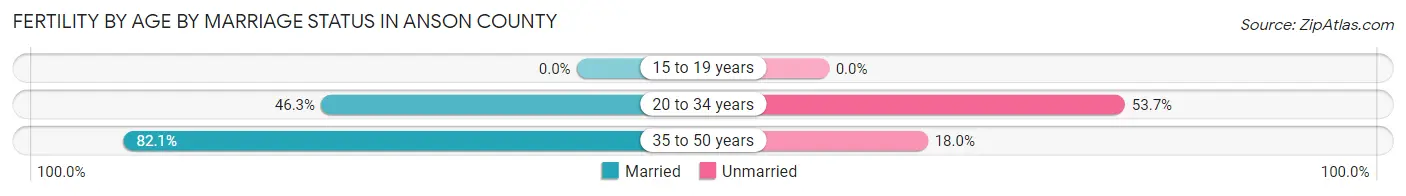
| Age Bracket | Married | Unmarried |
| 15 to 19 years | 0 (0.0%) | 0 (0.0%) |
| 20 to 34 years | 107 (46.3%) | 124 (53.7%) |
| 35 to 50 years | 32 (82.1%) | 7 (17.9%) |
| Total | 139 (51.5%) | 131 (48.5%) |
Fertility by Education in Anson County
Average fertility rate in Anson County is 60.0 births per 1,000 women. Women with the education attainment of graduate degree have the highest fertility rate of 149.0 births per 1,000 women, while women with the education attainment of college or associate's degree have the lowest fertility at 7.0 births per 1,000 women. Women with the education attainment of high school diploma represent 69.6% of all women with births.
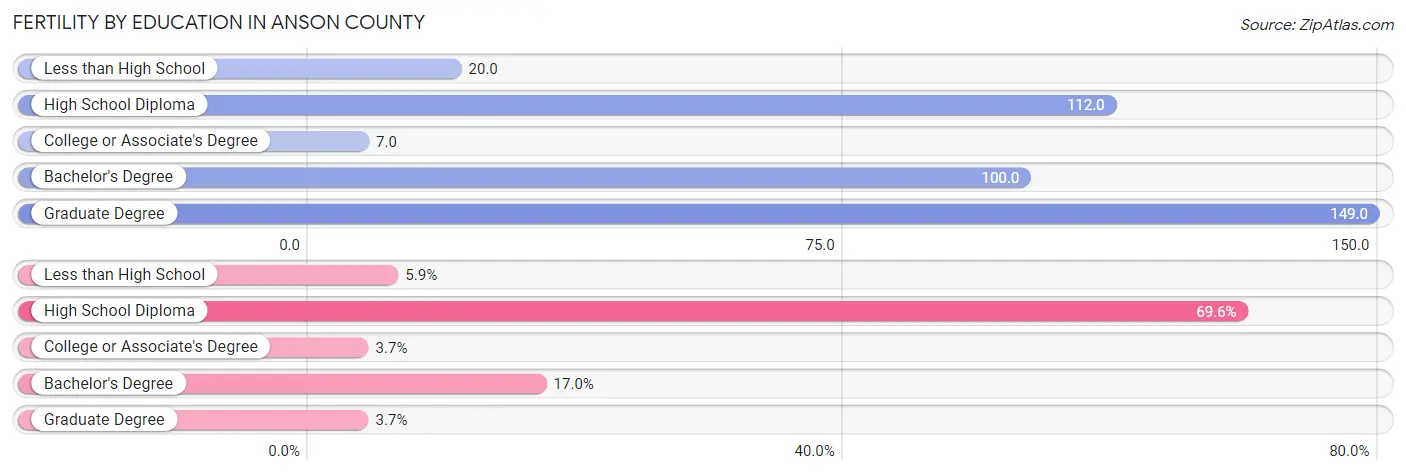
| Educational Attainment | Women with Births | Births / 1,000 Women |
| Less than High School | 16 (5.9%) | 20.0 |
| High School Diploma | 188 (69.6%) | 112.0 |
| College or Associate's Degree | 10 (3.7%) | 7.0 |
| Bachelor's Degree | 46 (17.0%) | 100.0 |
| Graduate Degree | 10 (3.7%) | 149.0 |
| Total | 270 (100.0%) | 60.0 |
Fertility by Education by Marriage Status in Anson County
48.5% of women with births in Anson County are unmarried. Women with the educational attainment of bachelor's degree are most likely to be married with 91.3% of them married at childbirth, while women with the educational attainment of less than high school are least likely to be married with 100.0% of them unmarried at childbirth.
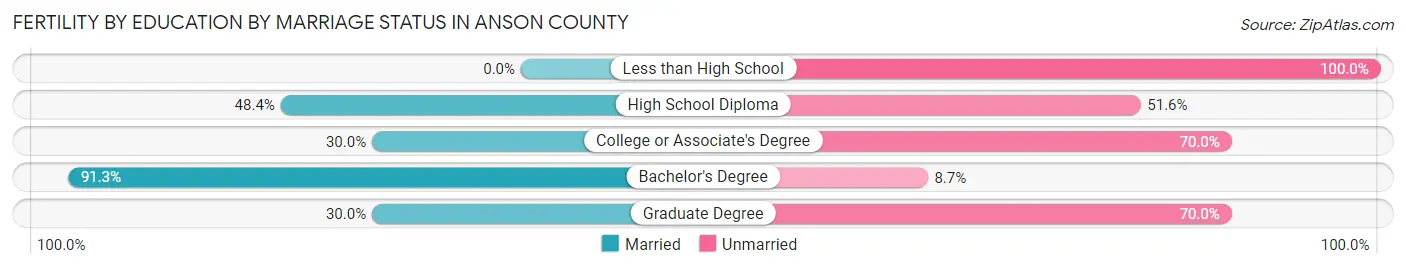
| Educational Attainment | Married | Unmarried |
| Less than High School | 0 (0.0%) | 16 (100.0%) |
| High School Diploma | 91 (48.4%) | 97 (51.6%) |
| College or Associate's Degree | 3 (30.0%) | 7 (70.0%) |
| Bachelor's Degree | 42 (91.3%) | 4 (8.7%) |
| Graduate Degree | 3 (30.0%) | 7 (70.0%) |
| Total | 139 (51.5%) | 131 (48.5%) |
Employment Characteristics in Anson County
Employment by Class of Employer in Anson County
Among the 8,565 employed individuals in Anson County, private company employees (5,672 | 66.2%), local government employees (832 | 9.7%), and self-employed (not incorporated) (815 | 9.5%) make up the most common classes of employment.
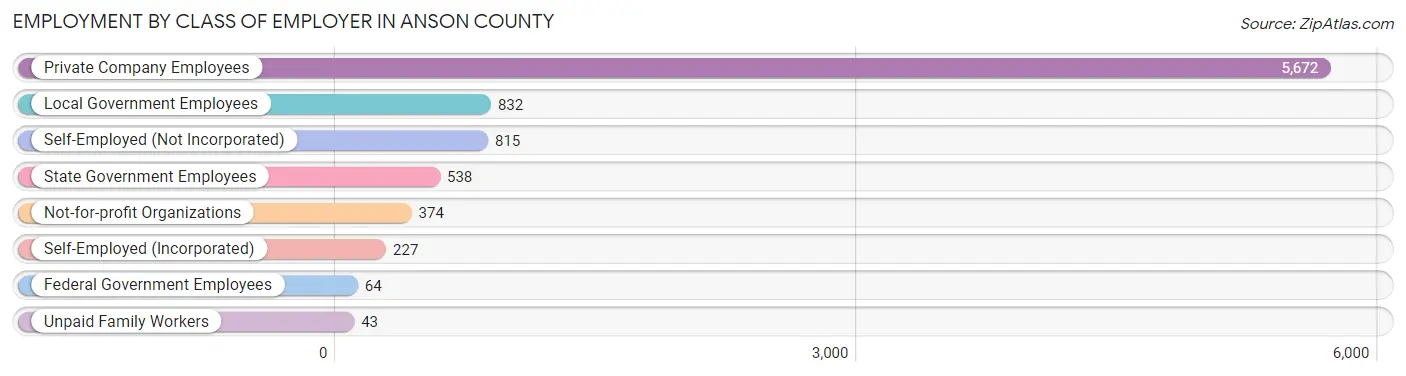
| Employer Class | # Employees | % Employees |
| Private Company Employees | 5,672 | 66.2% |
| Self-Employed (Incorporated) | 227 | 2.6% |
| Self-Employed (Not Incorporated) | 815 | 9.5% |
| Not-for-profit Organizations | 374 | 4.4% |
| Local Government Employees | 832 | 9.7% |
| State Government Employees | 538 | 6.3% |
| Federal Government Employees | 64 | 0.7% |
| Unpaid Family Workers | 43 | 0.5% |
| Total | 8,565 | 100.0% |
Employment Status by Age in Anson County
According to the labor force statistics for Anson County, out of the total population over 16 years of age (18,395), 50.8% or 9,345 individuals are in the labor force, with 6.4% or 598 of them unemployed. The age group with the highest labor force participation rate is 30 to 34 years, with 67.7% or 992 individuals in the labor force. Within the labor force, the 16 to 19 years age range has the highest percentage of unemployed individuals, with 35.4% or 216 of them being unemployed.
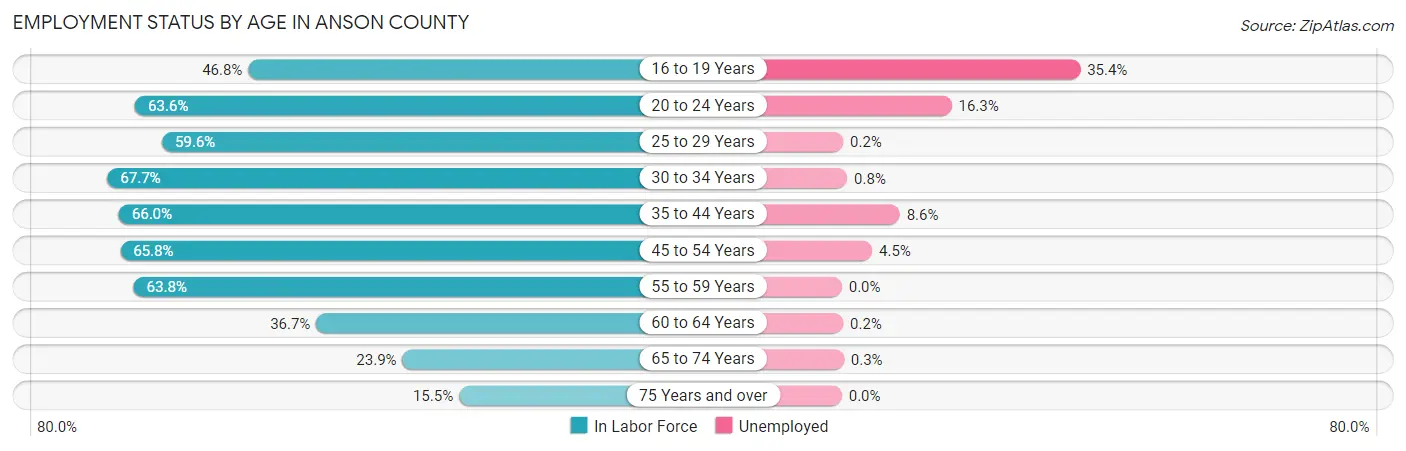
| Age Bracket | In Labor Force | Unemployed |
| 16 to 19 Years | 611 (46.8%) | 216 (35.4%) |
| 20 to 24 Years | 827 (63.6%) | 135 (16.3%) |
| 25 to 29 Years | 865 (59.6%) | 2 (0.2%) |
| 30 to 34 Years | 992 (67.7%) | 8 (0.8%) |
| 35 to 44 Years | 1,806 (66.0%) | 155 (8.6%) |
| 45 to 54 Years | 1,813 (65.8%) | 82 (4.5%) |
| 55 to 59 Years | 1,014 (63.8%) | 0 (0.0%) |
| 60 to 64 Years | 534 (36.7%) | 1 (0.2%) |
| 65 to 74 Years | 605 (23.9%) | 2 (0.3%) |
| 75 Years and over | 280 (15.5%) | 0 (0.0%) |
| Total | 9,345 (50.8%) | 598 (6.4%) |
Employment Status by Educational Attainment in Anson County
According to labor force statistics for Anson County, 61.4% of individuals (7,031) out of the total population between 25 and 64 years of age (11,451) are in the labor force, with 3.5% or 246 of them being unemployed. The group with the highest labor force participation rate are those with the educational attainment of bachelor's degree or higher, with 82.8% or 1,021 individuals in the labor force. Within the labor force, individuals with less than high school education have the highest percentage of unemployment, with 6.7% or 50 of them being unemployed.
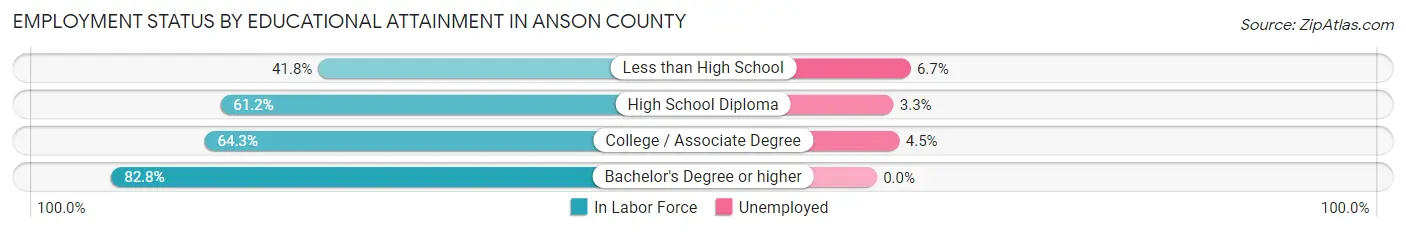
| Educational Attainment | In Labor Force | Unemployed |
| Less than High School | 749 (41.8%) | 120 (6.7%) |
| High School Diploma | 3,232 (61.2%) | 174 (3.3%) |
| College / Associate Degree | 2,023 (64.3%) | 142 (4.5%) |
| Bachelor's Degree or higher | 1,021 (82.8%) | 0 (0.0%) |
| Total | 7,031 (61.4%) | 401 (3.5%) |
Employment Occupations by Sex in Anson County
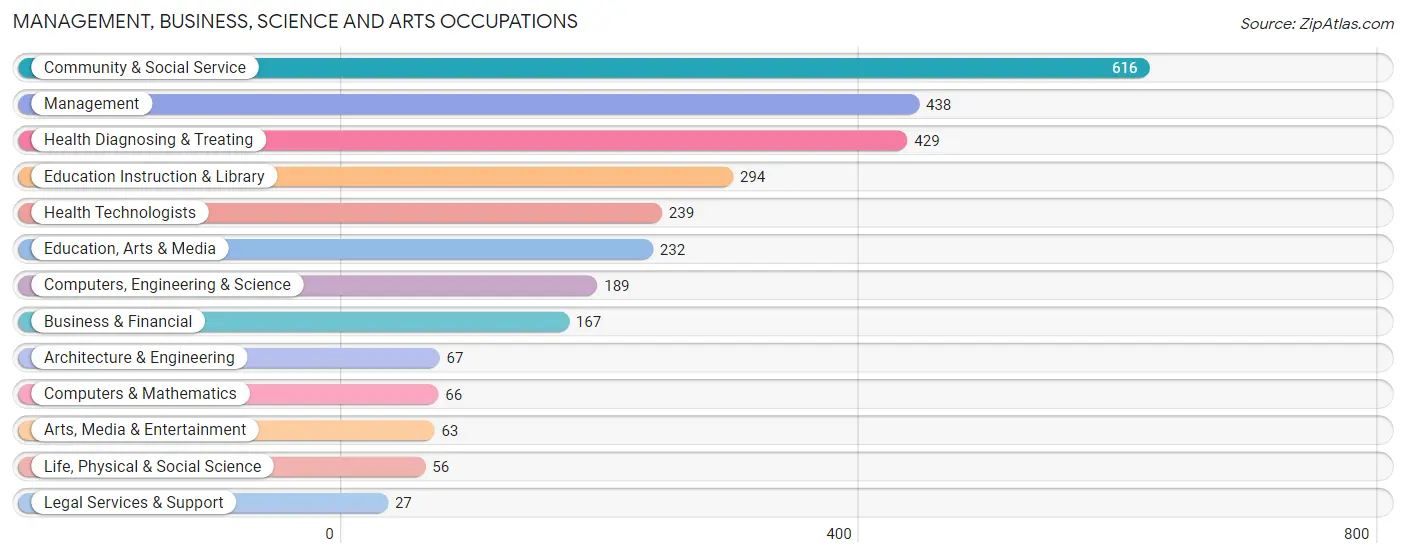
Management, Business, Science and Arts Occupations
The most common Management, Business, Science and Arts occupations in Anson County are Community & Social Service (616 | 7.1%), Management (438 | 5.0%), Health Diagnosing & Treating (429 | 4.9%), Education Instruction & Library (294 | 3.4%), and Health Technologists (239 | 2.7%).
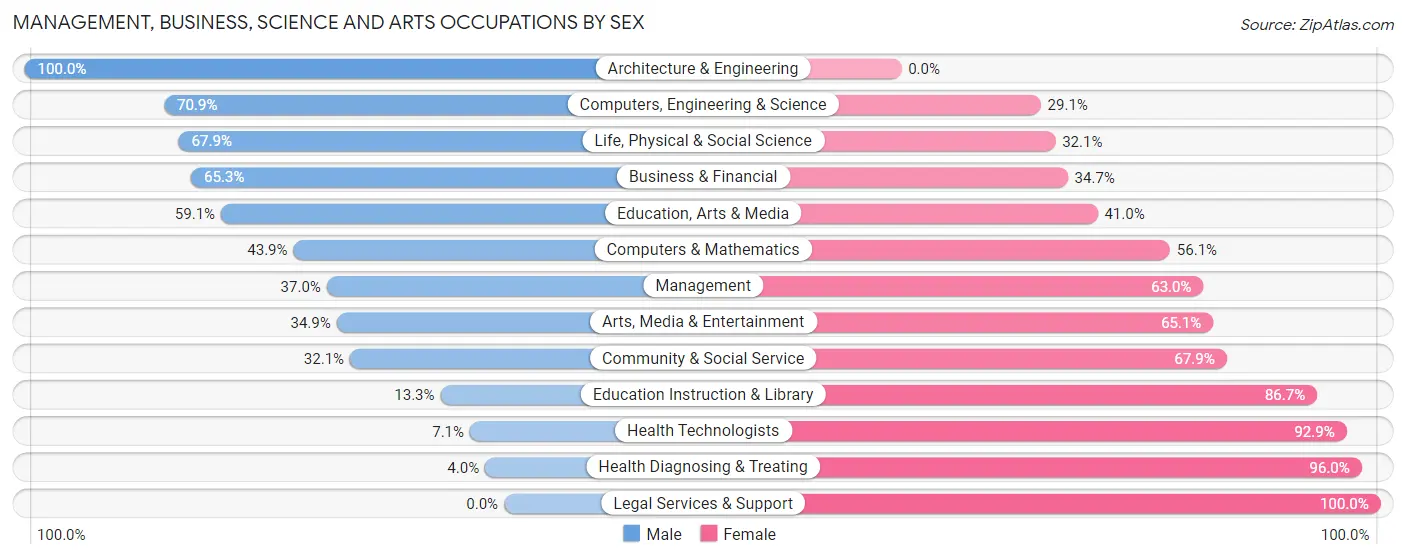
Management, Business, Science and Arts Occupations by Sex
Within the Management, Business, Science and Arts occupations in Anson County, the most male-oriented occupations are Architecture & Engineering (100.0%), Computers, Engineering & Science (70.9%), and Life, Physical & Social Science (67.9%), while the most female-oriented occupations are Legal Services & Support (100.0%), Health Diagnosing & Treating (96.0%), and Health Technologists (92.9%).
| Occupation | Male | Female |
| Management | 162 (37.0%) | 276 (63.0%) |
| Business & Financial | 109 (65.3%) | 58 (34.7%) |
| Computers, Engineering & Science | 134 (70.9%) | 55 (29.1%) |
| Computers & Mathematics | 29 (43.9%) | 37 (56.1%) |
| Architecture & Engineering | 67 (100.0%) | 0 (0.0%) |
| Life, Physical & Social Science | 38 (67.9%) | 18 (32.1%) |
| Community & Social Service | 198 (32.1%) | 418 (67.9%) |
| Education, Arts & Media | 137 (59.1%) | 95 (40.9%) |
| Legal Services & Support | 0 (0.0%) | 27 (100.0%) |
| Education Instruction & Library | 39 (13.3%) | 255 (86.7%) |
| Arts, Media & Entertainment | 22 (34.9%) | 41 (65.1%) |
| Health Diagnosing & Treating | 17 (4.0%) | 412 (96.0%) |
| Health Technologists | 17 (7.1%) | 222 (92.9%) |
| Total (Category) | 620 (33.7%) | 1,219 (66.3%) |
| Total (Overall) | 4,594 (52.6%) | 4,137 (47.4%) |
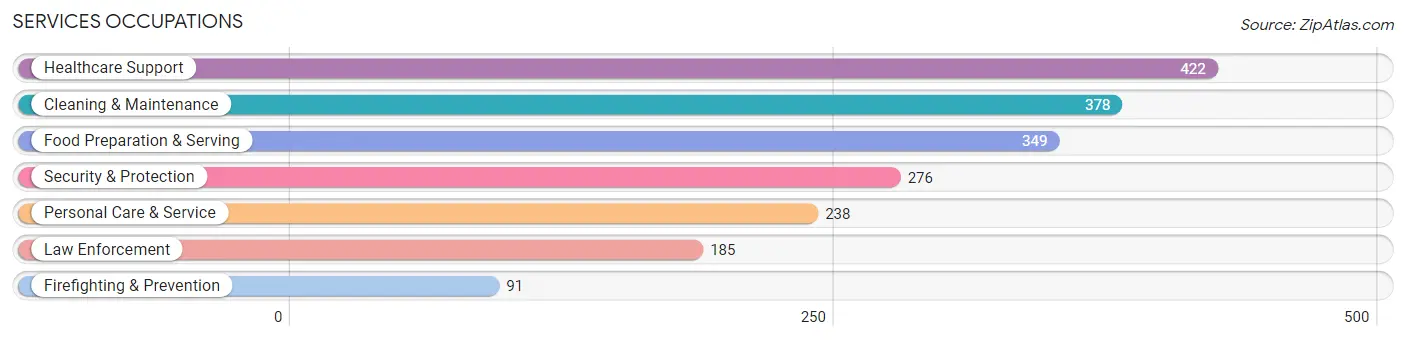
Services Occupations
The most common Services occupations in Anson County are Healthcare Support (422 | 4.8%), Cleaning & Maintenance (378 | 4.3%), Food Preparation & Serving (349 | 4.0%), Security & Protection (276 | 3.2%), and Personal Care & Service (238 | 2.7%).
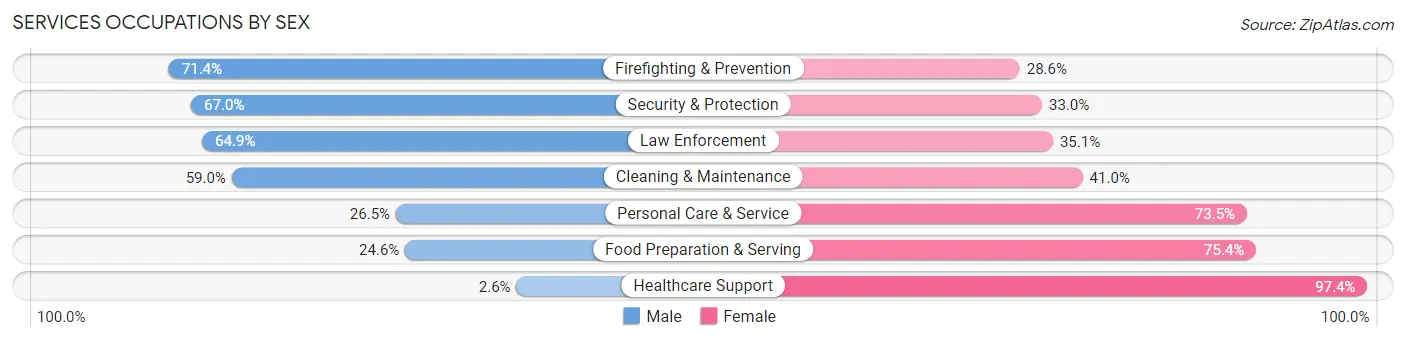
Services Occupations by Sex
Within the Services occupations in Anson County, the most male-oriented occupations are Firefighting & Prevention (71.4%), Security & Protection (67.0%), and Law Enforcement (64.9%), while the most female-oriented occupations are Healthcare Support (97.4%), Food Preparation & Serving (75.4%), and Personal Care & Service (73.5%).
| Occupation | Male | Female |
| Healthcare Support | 11 (2.6%) | 411 (97.4%) |
| Security & Protection | 185 (67.0%) | 91 (33.0%) |
| Firefighting & Prevention | 65 (71.4%) | 26 (28.6%) |
| Law Enforcement | 120 (64.9%) | 65 (35.1%) |
| Food Preparation & Serving | 86 (24.6%) | 263 (75.4%) |
| Cleaning & Maintenance | 223 (59.0%) | 155 (41.0%) |
| Personal Care & Service | 63 (26.5%) | 175 (73.5%) |
| Total (Category) | 568 (34.2%) | 1,095 (65.8%) |
| Total (Overall) | 4,594 (52.6%) | 4,137 (47.4%) |
Sales and Office Occupations
The most common Sales and Office occupations in Anson County are Office & Administration (720 | 8.3%), and Sales & Related (584 | 6.7%).
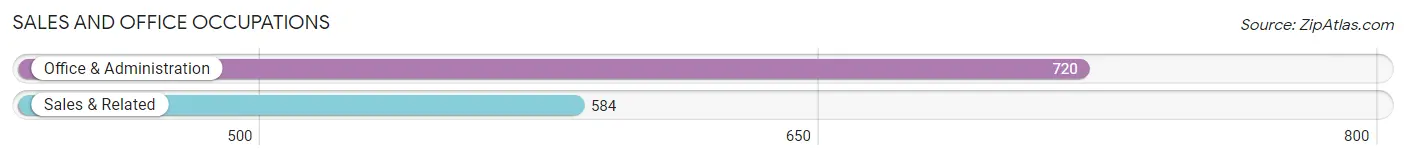
Sales and Office Occupations by Sex
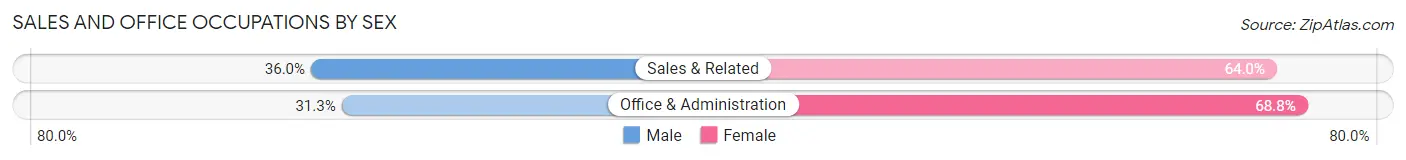
| Occupation | Male | Female |
| Sales & Related | 210 (36.0%) | 374 (64.0%) |
| Office & Administration | 225 (31.2%) | 495 (68.8%) |
| Total (Category) | 435 (33.4%) | 869 (66.6%) |
| Total (Overall) | 4,594 (52.6%) | 4,137 (47.4%) |
Natural Resources, Construction and Maintenance Occupations
The most common Natural Resources, Construction and Maintenance occupations in Anson County are Construction & Extraction (518 | 5.9%), Installation, Maintenance & Repair (312 | 3.6%), and Farming, Fishing & Forestry (114 | 1.3%).
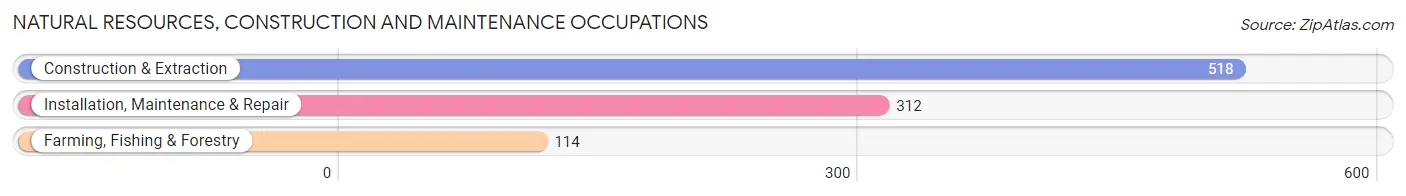
Natural Resources, Construction and Maintenance Occupations by Sex
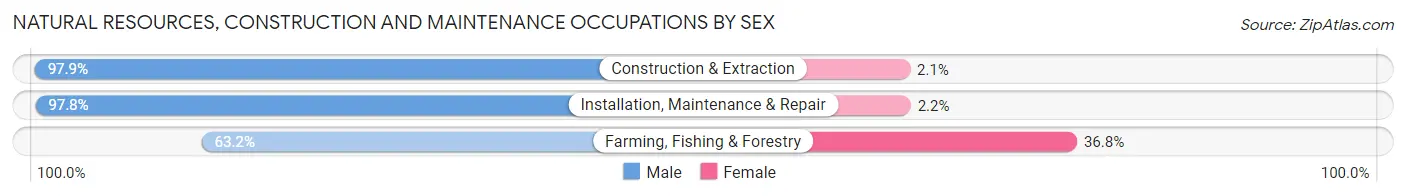
| Occupation | Male | Female |
| Farming, Fishing & Forestry | 72 (63.2%) | 42 (36.8%) |
| Construction & Extraction | 507 (97.9%) | 11 (2.1%) |
| Installation, Maintenance & Repair | 305 (97.8%) | 7 (2.2%) |
| Total (Category) | 884 (93.6%) | 60 (6.4%) |
| Total (Overall) | 4,594 (52.6%) | 4,137 (47.4%) |
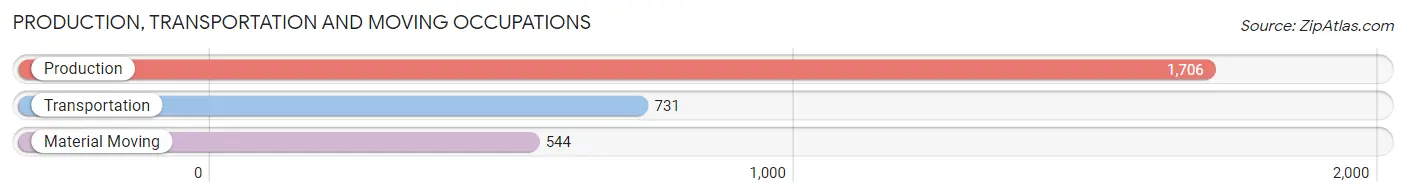
Production, Transportation and Moving Occupations
The most common Production, Transportation and Moving occupations in Anson County are Production (1,706 | 19.5%), Transportation (731 | 8.4%), and Material Moving (544 | 6.2%).
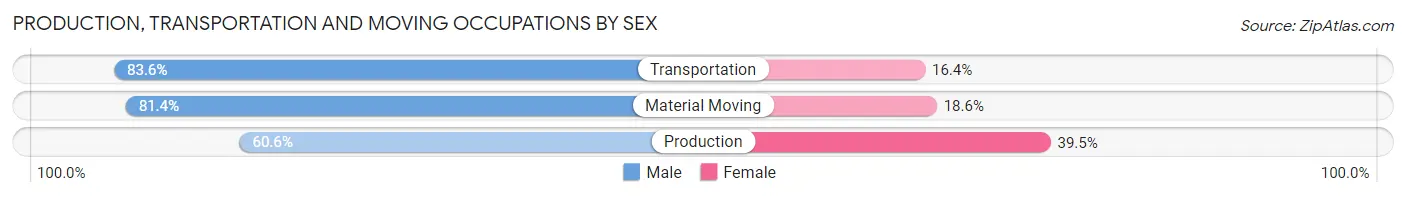
Production, Transportation and Moving Occupations by Sex
| Occupation | Male | Female |
| Production | 1,033 (60.6%) | 673 (39.5%) |
| Transportation | 611 (83.6%) | 120 (16.4%) |
| Material Moving | 443 (81.4%) | 101 (18.6%) |
| Total (Category) | 2,087 (70.0%) | 894 (30.0%) |
| Total (Overall) | 4,594 (52.6%) | 4,137 (47.4%) |
Employment Industries by Sex in Anson County
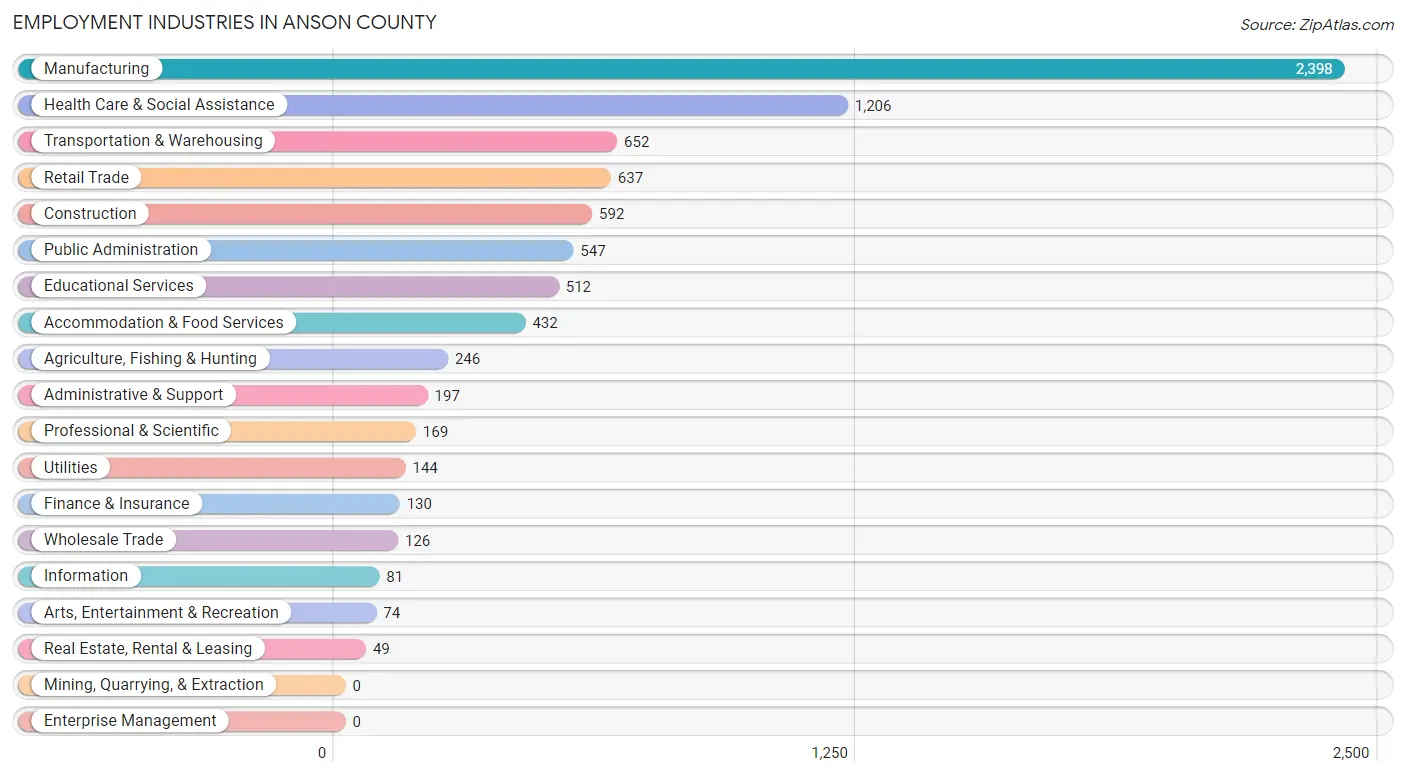
Employment Industries in Anson County
The major employment industries in Anson County include Manufacturing (2,398 | 27.5%), Health Care & Social Assistance (1,206 | 13.8%), Transportation & Warehousing (652 | 7.5%), Retail Trade (637 | 7.3%), and Construction (592 | 6.8%).
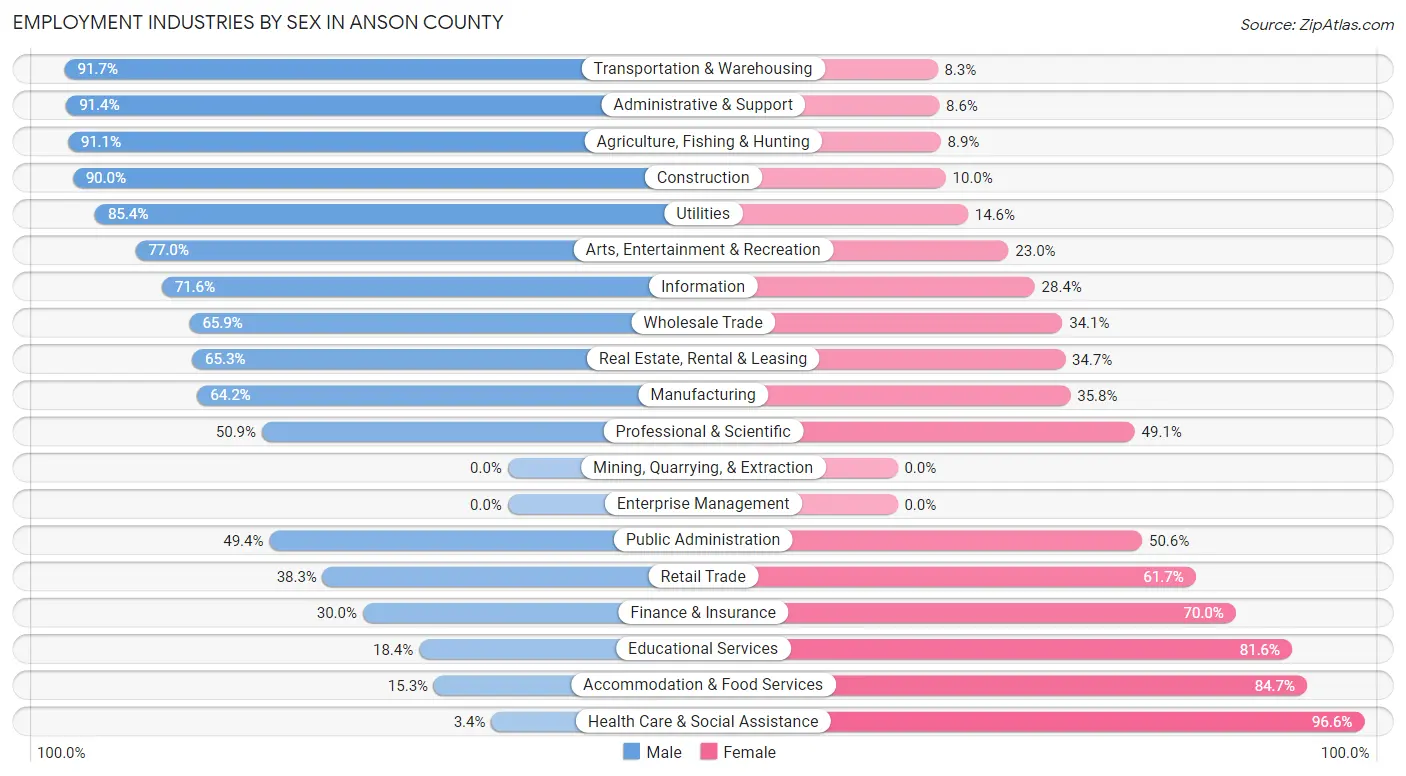
Employment Industries by Sex in Anson County
The Anson County industries that see more men than women are Transportation & Warehousing (91.7%), Administrative & Support (91.4%), and Agriculture, Fishing & Hunting (91.1%), whereas the industries that tend to have a higher number of women are Health Care & Social Assistance (96.6%), Accommodation & Food Services (84.7%), and Educational Services (81.6%).
| Industry | Male | Female |
| Agriculture, Fishing & Hunting | 224 (91.1%) | 22 (8.9%) |
| Mining, Quarrying, & Extraction | 0 (0.0%) | 0 (0.0%) |
| Construction | 533 (90.0%) | 59 (10.0%) |
| Manufacturing | 1,540 (64.2%) | 858 (35.8%) |
| Wholesale Trade | 83 (65.9%) | 43 (34.1%) |
| Retail Trade | 244 (38.3%) | 393 (61.7%) |
| Transportation & Warehousing | 598 (91.7%) | 54 (8.3%) |
| Utilities | 123 (85.4%) | 21 (14.6%) |
| Information | 58 (71.6%) | 23 (28.4%) |
| Finance & Insurance | 39 (30.0%) | 91 (70.0%) |
| Real Estate, Rental & Leasing | 32 (65.3%) | 17 (34.7%) |
| Professional & Scientific | 86 (50.9%) | 83 (49.1%) |
| Enterprise Management | 0 (0.0%) | 0 (0.0%) |
| Administrative & Support | 180 (91.4%) | 17 (8.6%) |
| Educational Services | 94 (18.4%) | 418 (81.6%) |
| Health Care & Social Assistance | 41 (3.4%) | 1,165 (96.6%) |
| Arts, Entertainment & Recreation | 57 (77.0%) | 17 (23.0%) |
| Accommodation & Food Services | 66 (15.3%) | 366 (84.7%) |
| Public Administration | 270 (49.4%) | 277 (50.6%) |
| Total | 4,594 (52.6%) | 4,137 (47.4%) |
Education in Anson County
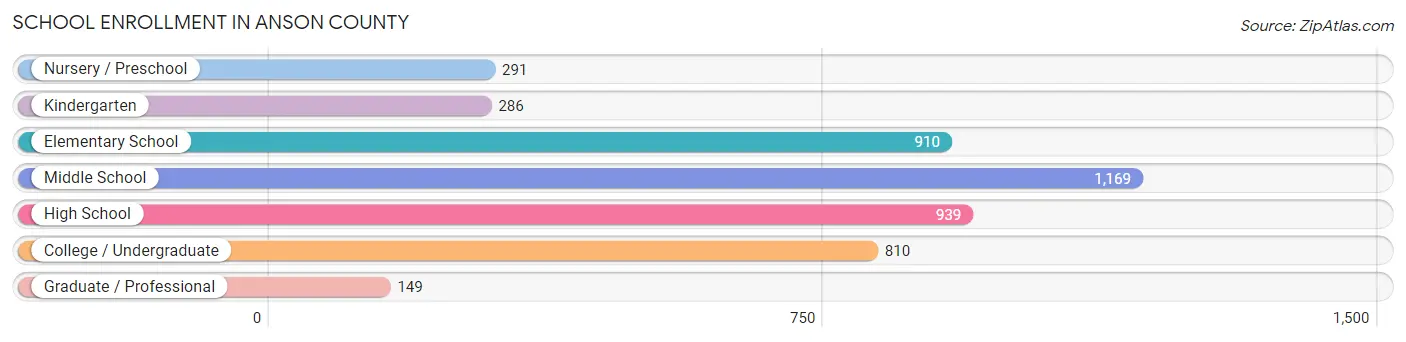
School Enrollment in Anson County
The most common levels of schooling among the 4,554 students in Anson County are middle school (1,169 | 25.7%), high school (939 | 20.6%), and elementary school (910 | 20.0%).
| School Level | # Students | % Students |
| Nursery / Preschool | 291 | 6.4% |
| Kindergarten | 286 | 6.3% |
| Elementary School | 910 | 20.0% |
| Middle School | 1,169 | 25.7% |
| High School | 939 | 20.6% |
| College / Undergraduate | 810 | 17.8% |
| Graduate / Professional | 149 | 3.3% |
| Total | 4,554 | 100.0% |
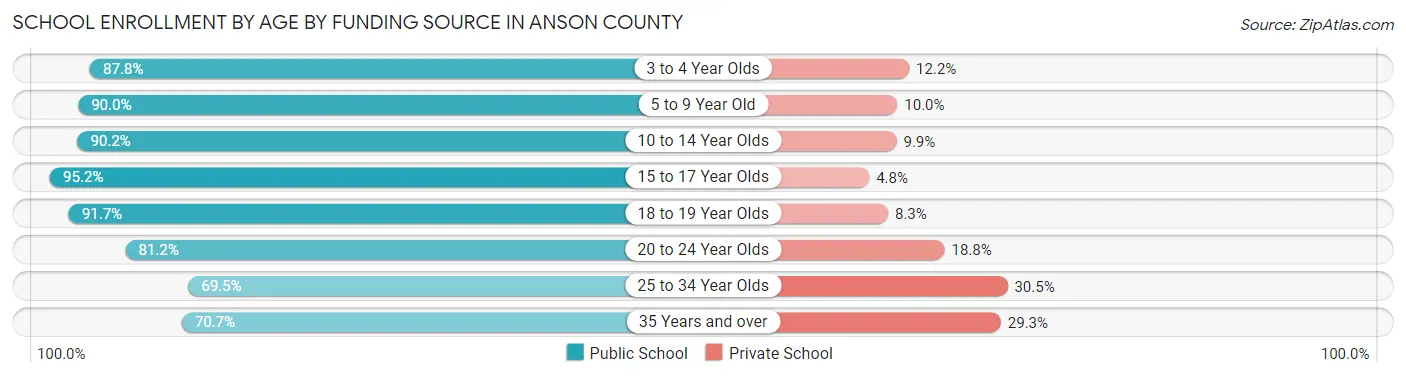
School Enrollment by Age by Funding Source in Anson County
Out of a total of 4,554 students who are enrolled in schools in Anson County, 519 (11.4%) attend a private institution, while the remaining 4,035 (88.6%) are enrolled in public schools. The age group of 25 to 34 year olds has the highest likelihood of being enrolled in private schools, with 36 (30.5% in the age bracket) enrolled. Conversely, the age group of 15 to 17 year olds has the lowest likelihood of being enrolled in a private school, with 721 (95.2% in the age bracket) attending a public institution.
| Age Bracket | Public School | Private School |
| 3 to 4 Year Olds | 223 (87.8%) | 31 (12.2%) |
| 5 to 9 Year Old | 954 (90.0%) | 106 (10.0%) |
| 10 to 14 Year Olds | 1,217 (90.1%) | 133 (9.9%) |
| 15 to 17 Year Olds | 721 (95.2%) | 36 (4.8%) |
| 18 to 19 Year Olds | 422 (91.7%) | 38 (8.3%) |
| 20 to 24 Year Olds | 190 (81.2%) | 44 (18.8%) |
| 25 to 34 Year Olds | 82 (69.5%) | 36 (30.5%) |
| 35 Years and over | 227 (70.7%) | 94 (29.3%) |
| Total | 4,035 (88.6%) | 519 (11.4%) |
Educational Attainment by Field of Study in Anson County
Education (373 | 19.9%), arts & humanities (271 | 14.5%), science & technology (238 | 12.7%), business (229 | 12.2%), and liberal arts & history (143 | 7.6%) are the most common fields of study among 1,872 individuals in Anson County who have obtained a bachelor's degree or higher.
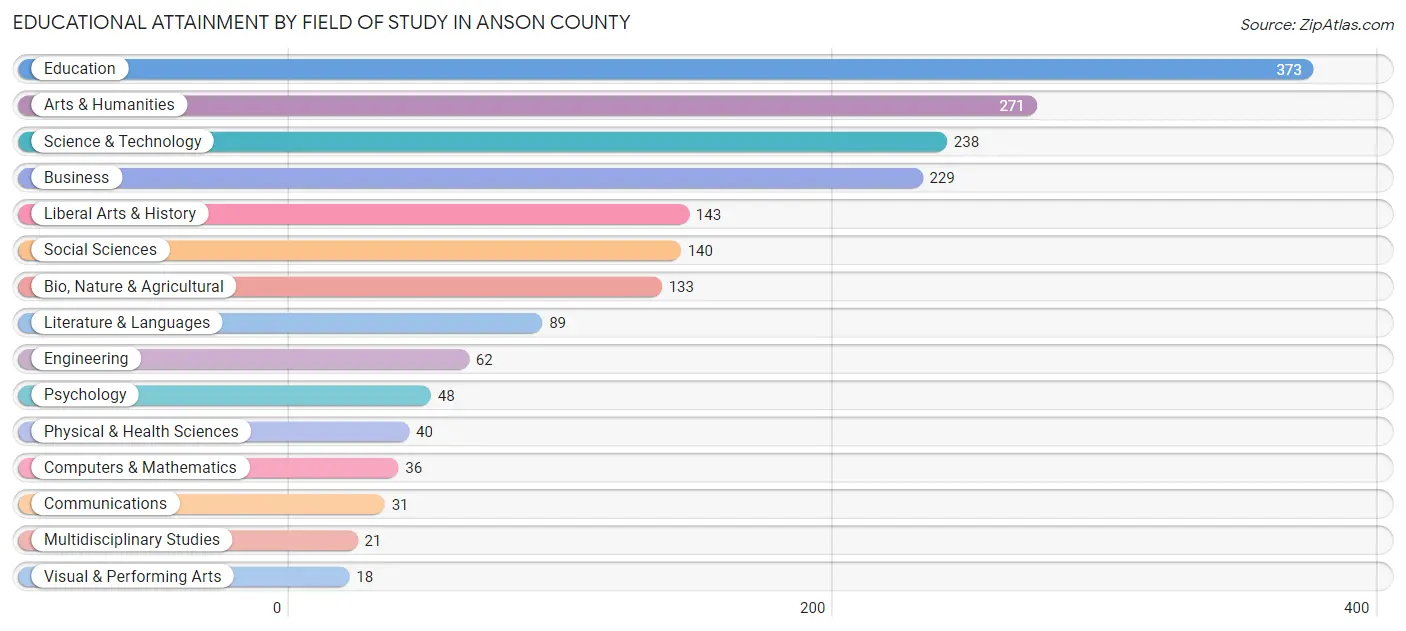
| Field of Study | # Graduates | % Graduates |
| Computers & Mathematics | 36 | 1.9% |
| Bio, Nature & Agricultural | 133 | 7.1% |
| Physical & Health Sciences | 40 | 2.1% |
| Psychology | 48 | 2.6% |
| Social Sciences | 140 | 7.5% |
| Engineering | 62 | 3.3% |
| Multidisciplinary Studies | 21 | 1.1% |
| Science & Technology | 238 | 12.7% |
| Business | 229 | 12.2% |
| Education | 373 | 19.9% |
| Literature & Languages | 89 | 4.8% |
| Liberal Arts & History | 143 | 7.6% |
| Visual & Performing Arts | 18 | 1.0% |
| Communications | 31 | 1.7% |
| Arts & Humanities | 271 | 14.5% |
| Total | 1,872 | 100.0% |
Transportation & Commute in Anson County
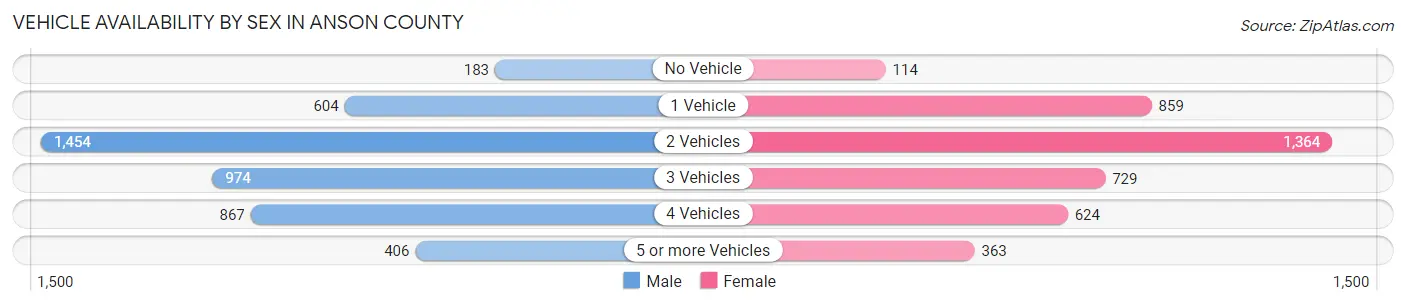
Vehicle Availability by Sex in Anson County
The most prevalent vehicle ownership categories in Anson County are males with 2 vehicles (1,454, accounting for 32.4%) and females with 2 vehicles (1,364, making up 35.9%).
| Vehicles Available | Male | Female |
| No Vehicle | 183 (4.1%) | 114 (2.8%) |
| 1 Vehicle | 604 (13.5%) | 859 (21.2%) |
| 2 Vehicles | 1,454 (32.4%) | 1,364 (33.7%) |
| 3 Vehicles | 974 (21.7%) | 729 (18.0%) |
| 4 Vehicles | 867 (19.3%) | 624 (15.4%) |
| 5 or more Vehicles | 406 (9.0%) | 363 (9.0%) |
| Total | 4,488 (100.0%) | 4,053 (100.0%) |
Commute Time in Anson County
The most frequently occuring commute durations in Anson County are 30 to 34 minutes (1,234 commuters, 15.2%), 15 to 19 minutes (1,223 commuters, 15.1%), and 45 to 59 minutes (1,197 commuters, 14.7%).
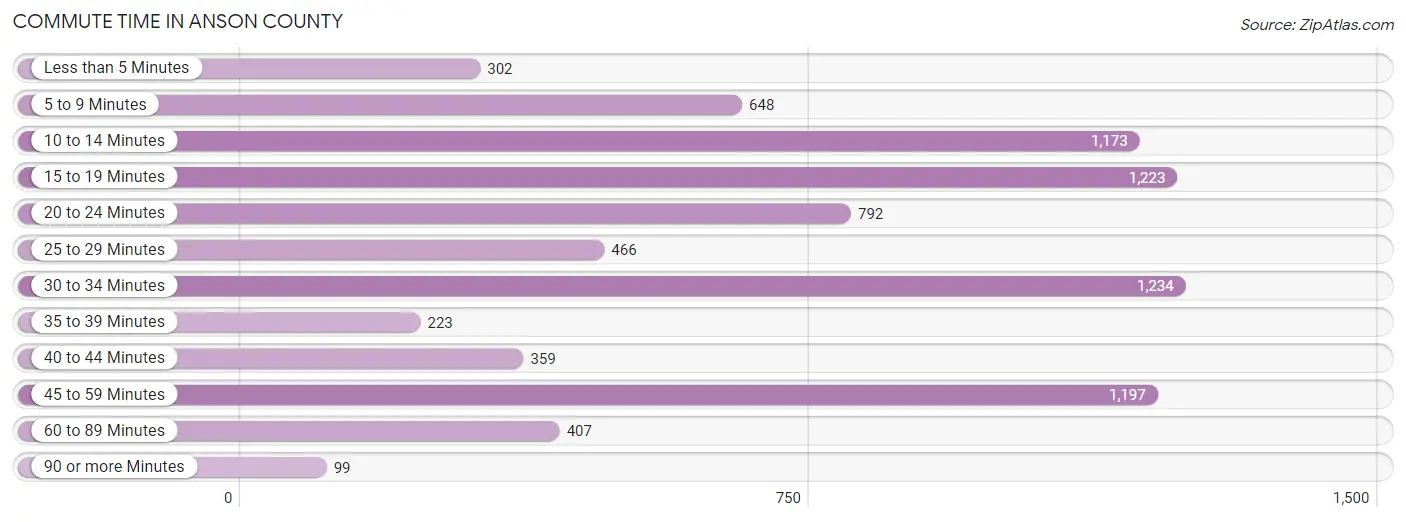
| Commute Time | # Commuters | % Commuters |
| Less than 5 Minutes | 302 | 3.7% |
| 5 to 9 Minutes | 648 | 8.0% |
| 10 to 14 Minutes | 1,173 | 14.4% |
| 15 to 19 Minutes | 1,223 | 15.1% |
| 20 to 24 Minutes | 792 | 9.8% |
| 25 to 29 Minutes | 466 | 5.7% |
| 30 to 34 Minutes | 1,234 | 15.2% |
| 35 to 39 Minutes | 223 | 2.8% |
| 40 to 44 Minutes | 359 | 4.4% |
| 45 to 59 Minutes | 1,197 | 14.7% |
| 60 to 89 Minutes | 407 | 5.0% |
| 90 or more Minutes | 99 | 1.2% |
Commute Time by Sex in Anson County
The most common commute times in Anson County are 30 to 34 minutes (778 commuters, 18.4%) for males and 15 to 19 minutes (778 commuters, 19.9%) for females.
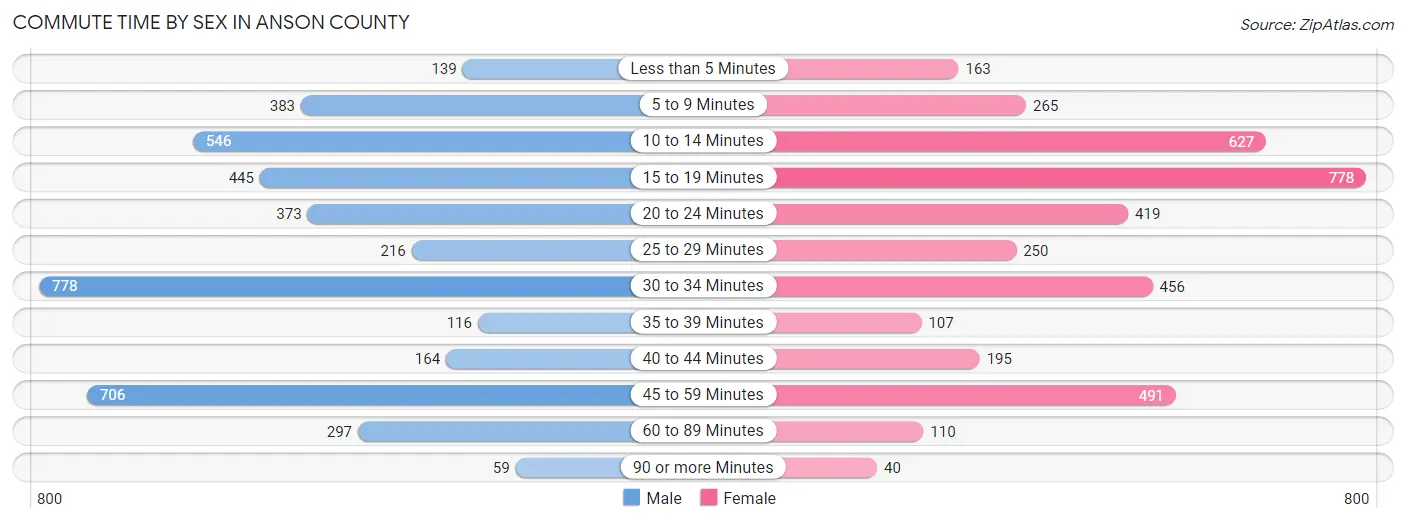
| Commute Time | Male | Female |
| Less than 5 Minutes | 139 (3.3%) | 163 (4.2%) |
| 5 to 9 Minutes | 383 (9.1%) | 265 (6.8%) |
| 10 to 14 Minutes | 546 (12.9%) | 627 (16.1%) |
| 15 to 19 Minutes | 445 (10.5%) | 778 (19.9%) |
| 20 to 24 Minutes | 373 (8.8%) | 419 (10.7%) |
| 25 to 29 Minutes | 216 (5.1%) | 250 (6.4%) |
| 30 to 34 Minutes | 778 (18.4%) | 456 (11.7%) |
| 35 to 39 Minutes | 116 (2.8%) | 107 (2.7%) |
| 40 to 44 Minutes | 164 (3.9%) | 195 (5.0%) |
| 45 to 59 Minutes | 706 (16.7%) | 491 (12.6%) |
| 60 to 89 Minutes | 297 (7.0%) | 110 (2.8%) |
| 90 or more Minutes | 59 (1.4%) | 40 (1.0%) |
Time of Departure to Work by Sex in Anson County
The most frequent times of departure to work in Anson County are 4:00 PM to 11:59 PM (555, 13.2%) for males and 6:00 AM to 6:29 AM (596, 15.3%) for females.
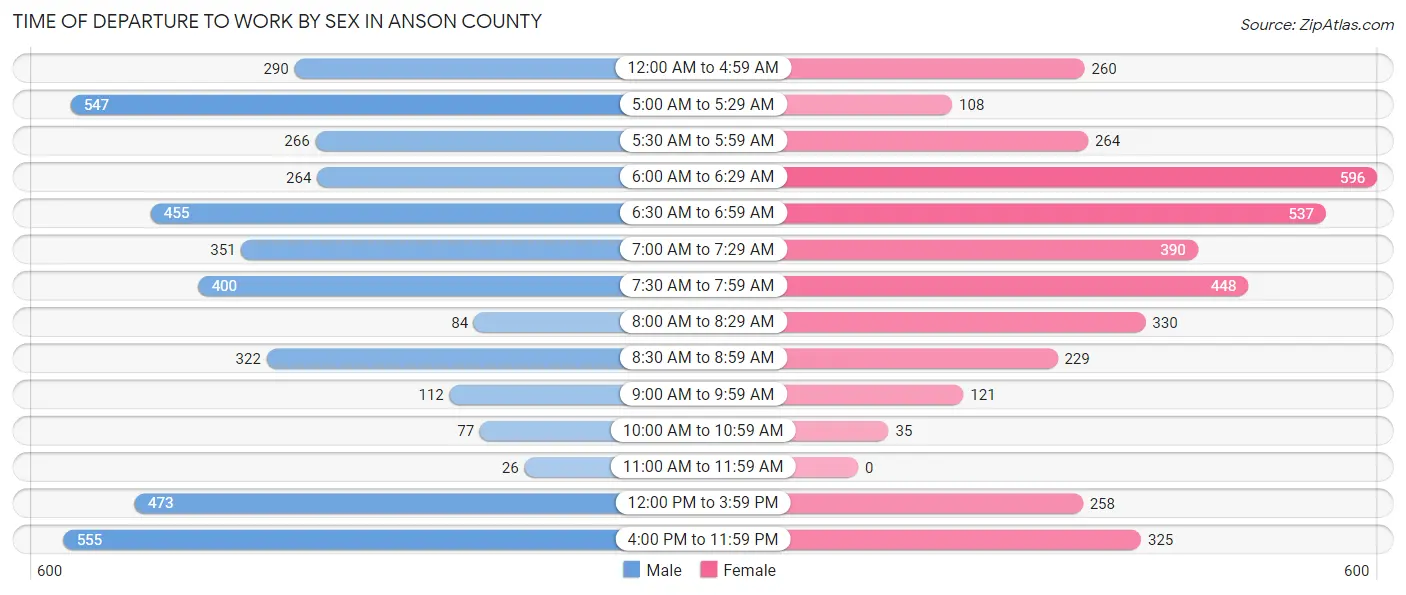
| Time of Departure | Male | Female |
| 12:00 AM to 4:59 AM | 290 (6.9%) | 260 (6.7%) |
| 5:00 AM to 5:29 AM | 547 (13.0%) | 108 (2.8%) |
| 5:30 AM to 5:59 AM | 266 (6.3%) | 264 (6.8%) |
| 6:00 AM to 6:29 AM | 264 (6.2%) | 596 (15.3%) |
| 6:30 AM to 6:59 AM | 455 (10.8%) | 537 (13.8%) |
| 7:00 AM to 7:29 AM | 351 (8.3%) | 390 (10.0%) |
| 7:30 AM to 7:59 AM | 400 (9.5%) | 448 (11.5%) |
| 8:00 AM to 8:29 AM | 84 (2.0%) | 330 (8.5%) |
| 8:30 AM to 8:59 AM | 322 (7.6%) | 229 (5.9%) |
| 9:00 AM to 9:59 AM | 112 (2.6%) | 121 (3.1%) |
| 10:00 AM to 10:59 AM | 77 (1.8%) | 35 (0.9%) |
| 11:00 AM to 11:59 AM | 26 (0.6%) | 0 (0.0%) |
| 12:00 PM to 3:59 PM | 473 (11.2%) | 258 (6.6%) |
| 4:00 PM to 11:59 PM | 555 (13.2%) | 325 (8.3%) |
| Total | 4,222 (100.0%) | 3,901 (100.0%) |
Housing Occupancy in Anson County
Occupancy by Ownership in Anson County
Of the total 8,266 dwellings in Anson County, owner-occupied units account for 5,572 (67.4%), while renter-occupied units make up 2,694 (32.6%).
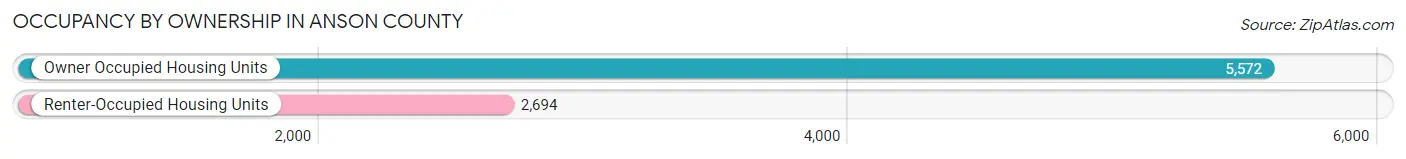
| Occupancy | # Housing Units | % Housing Units |
| Owner Occupied Housing Units | 5,572 | 67.4% |
| Renter-Occupied Housing Units | 2,694 | 32.6% |
| Total Occupied Housing Units | 8,266 | 100.0% |
Occupancy by Household Size in Anson County
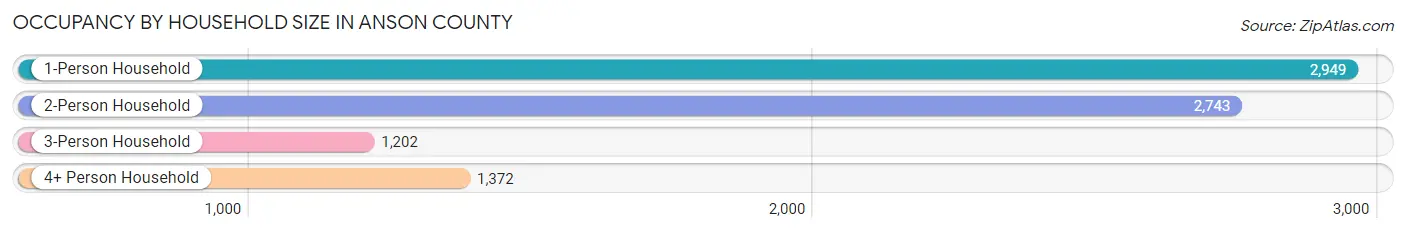
| Household Size | # Housing Units | % Housing Units |
| 1-Person Household | 2,949 | 35.7% |
| 2-Person Household | 2,743 | 33.2% |
| 3-Person Household | 1,202 | 14.5% |
| 4+ Person Household | 1,372 | 16.6% |
| Total Housing Units | 8,266 | 100.0% |
Occupancy by Ownership by Household Size in Anson County
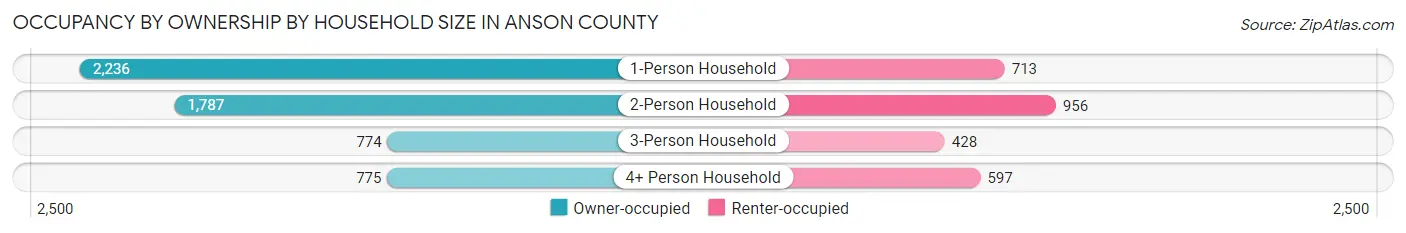
| Household Size | Owner-occupied | Renter-occupied |
| 1-Person Household | 2,236 (75.8%) | 713 (24.2%) |
| 2-Person Household | 1,787 (65.1%) | 956 (34.8%) |
| 3-Person Household | 774 (64.4%) | 428 (35.6%) |
| 4+ Person Household | 775 (56.5%) | 597 (43.5%) |
| Total Housing Units | 5,572 (67.4%) | 2,694 (32.6%) |
Occupancy by Educational Attainment in Anson County
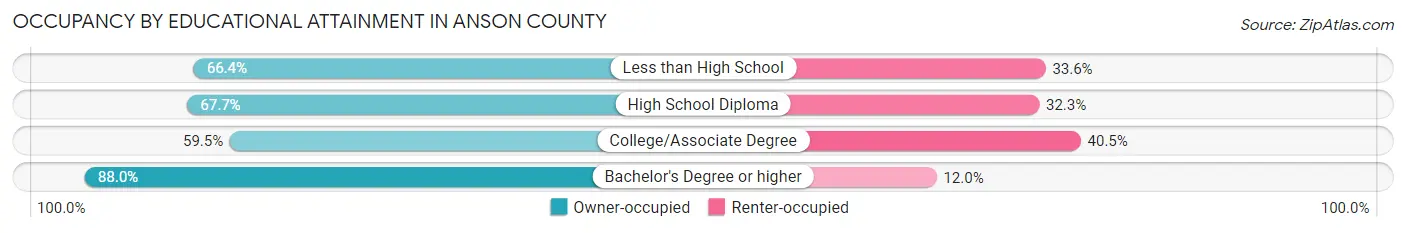
| Household Size | Owner-occupied | Renter-occupied |
| Less than High School | 879 (66.4%) | 444 (33.6%) |
| High School Diploma | 2,084 (67.7%) | 994 (32.3%) |
| College/Associate Degree | 1,652 (59.5%) | 1,126 (40.5%) |
| Bachelor's Degree or higher | 957 (88.0%) | 130 (12.0%) |
Occupancy by Age of Householder in Anson County
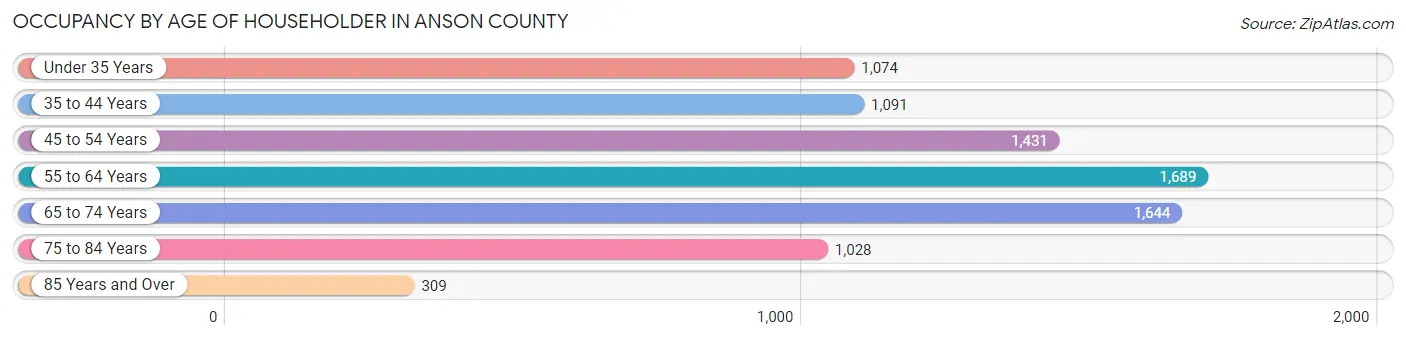
| Age Bracket | # Households | % Households |
| Under 35 Years | 1,074 | 13.0% |
| 35 to 44 Years | 1,091 | 13.2% |
| 45 to 54 Years | 1,431 | 17.3% |
| 55 to 64 Years | 1,689 | 20.4% |
| 65 to 74 Years | 1,644 | 19.9% |
| 75 to 84 Years | 1,028 | 12.4% |
| 85 Years and Over | 309 | 3.7% |
| Total | 8,266 | 100.0% |
Housing Finances in Anson County
Median Income by Occupancy in Anson County
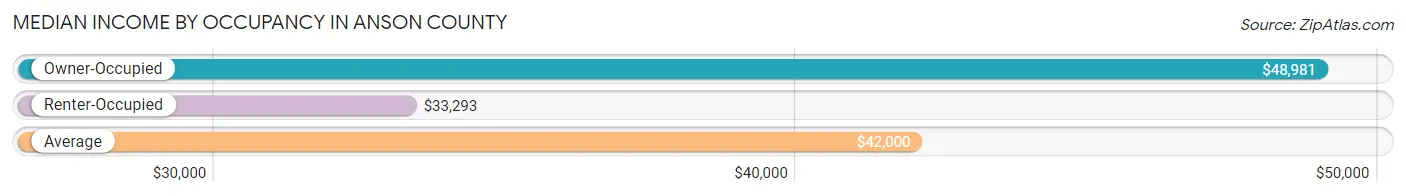
| Occupancy Type | # Households | Median Income |
| Owner-Occupied | 5,572 (67.4%) | $48,981 |
| Renter-Occupied | 2,694 (32.6%) | $33,293 |
| Average | 8,266 (100.0%) | $42,000 |
Occupancy by Householder Income Bracket in Anson County
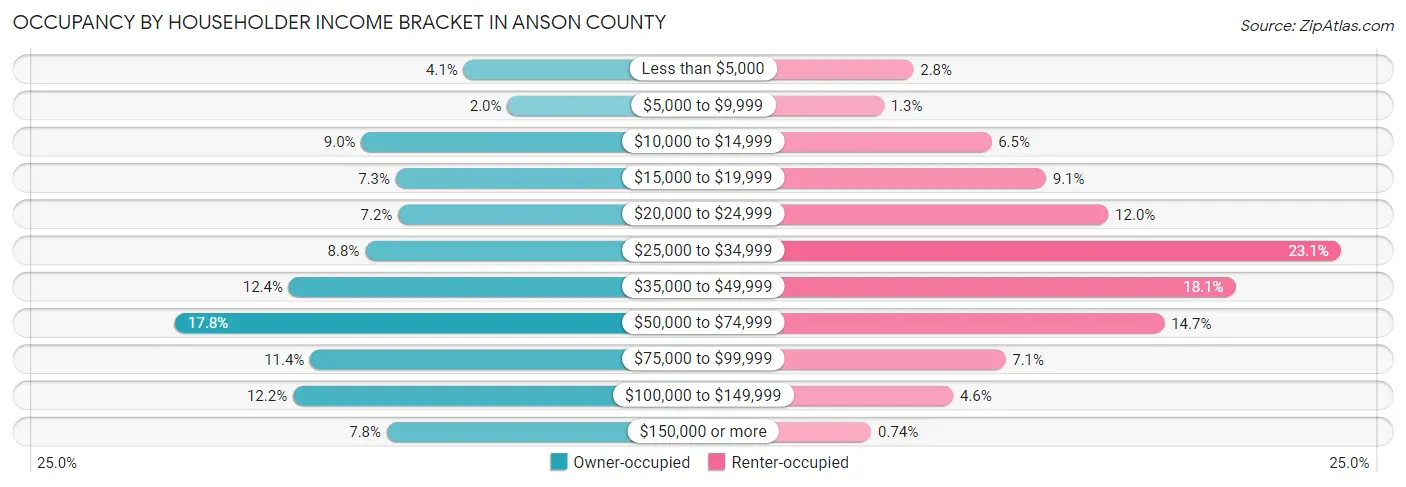
| Income Bracket | Owner-occupied | Renter-occupied |
| Less than $5,000 | 228 (4.1%) | 74 (2.8%) |
| $5,000 to $9,999 | 112 (2.0%) | 36 (1.3%) |
| $10,000 to $14,999 | 499 (9.0%) | 174 (6.5%) |
| $15,000 to $19,999 | 408 (7.3%) | 244 (9.1%) |
| $20,000 to $24,999 | 402 (7.2%) | 324 (12.0%) |
| $25,000 to $34,999 | 489 (8.8%) | 622 (23.1%) |
| $35,000 to $49,999 | 692 (12.4%) | 487 (18.1%) |
| $50,000 to $74,999 | 994 (17.8%) | 396 (14.7%) |
| $75,000 to $99,999 | 635 (11.4%) | 192 (7.1%) |
| $100,000 to $149,999 | 681 (12.2%) | 125 (4.6%) |
| $150,000 or more | 432 (7.7%) | 20 (0.7%) |
| Total | 5,572 (100.0%) | 2,694 (100.0%) |
Monthly Housing Cost Tiers in Anson County
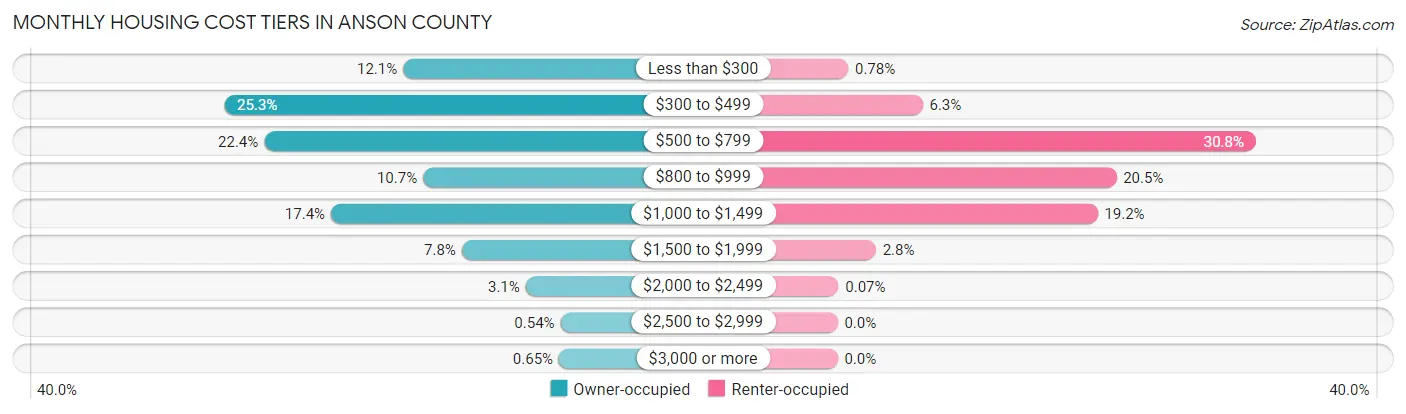
| Monthly Cost | Owner-occupied | Renter-occupied |
| Less than $300 | 676 (12.1%) | 21 (0.8%) |
| $300 to $499 | 1,410 (25.3%) | 169 (6.3%) |
| $500 to $799 | 1,246 (22.4%) | 830 (30.8%) |
| $800 to $999 | 594 (10.7%) | 553 (20.5%) |
| $1,000 to $1,499 | 972 (17.4%) | 516 (19.2%) |
| $1,500 to $1,999 | 435 (7.8%) | 76 (2.8%) |
| $2,000 to $2,499 | 173 (3.1%) | 2 (0.1%) |
| $2,500 to $2,999 | 30 (0.5%) | 0 (0.0%) |
| $3,000 or more | 36 (0.6%) | 0 (0.0%) |
| Total | 5,572 (100.0%) | 2,694 (100.0%) |
Physical Housing Characteristics in Anson County
Housing Structures in Anson County
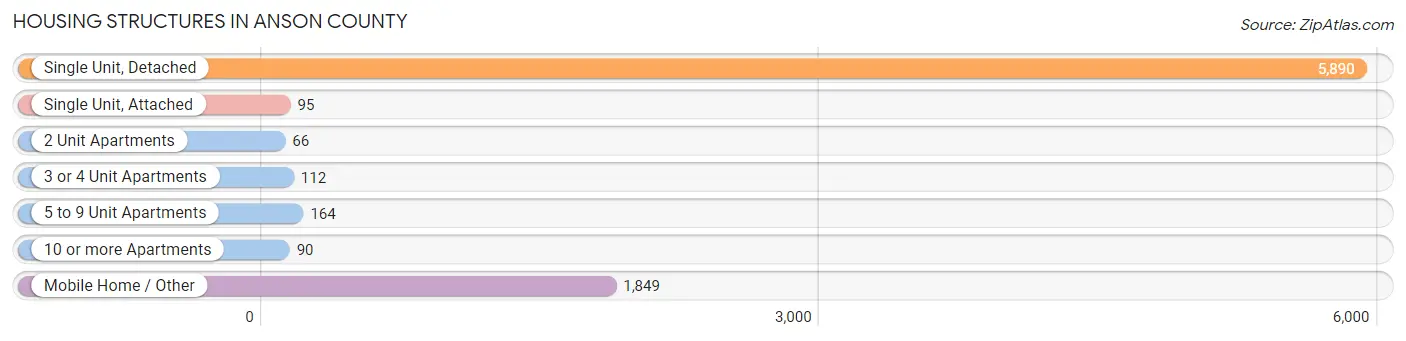
| Structure Type | # Housing Units | % Housing Units |
| Single Unit, Detached | 5,890 | 71.3% |
| Single Unit, Attached | 95 | 1.1% |
| 2 Unit Apartments | 66 | 0.8% |
| 3 or 4 Unit Apartments | 112 | 1.3% |
| 5 to 9 Unit Apartments | 164 | 2.0% |
| 10 or more Apartments | 90 | 1.1% |
| Mobile Home / Other | 1,849 | 22.4% |
| Total | 8,266 | 100.0% |
Housing Structures by Occupancy in Anson County
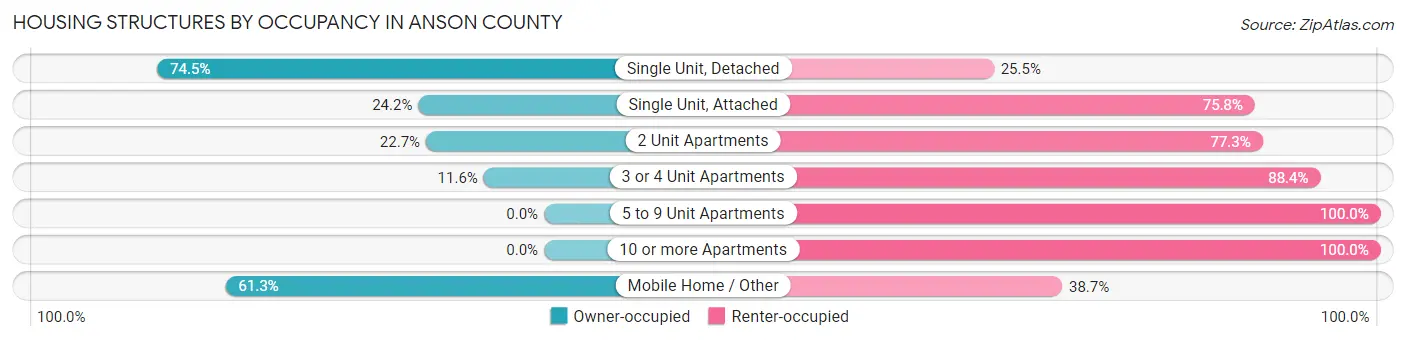
| Structure Type | Owner-occupied | Renter-occupied |
| Single Unit, Detached | 4,387 (74.5%) | 1,503 (25.5%) |
| Single Unit, Attached | 23 (24.2%) | 72 (75.8%) |
| 2 Unit Apartments | 15 (22.7%) | 51 (77.3%) |
| 3 or 4 Unit Apartments | 13 (11.6%) | 99 (88.4%) |
| 5 to 9 Unit Apartments | 0 (0.0%) | 164 (100.0%) |
| 10 or more Apartments | 0 (0.0%) | 90 (100.0%) |
| Mobile Home / Other | 1,134 (61.3%) | 715 (38.7%) |
| Total | 5,572 (67.4%) | 2,694 (32.6%) |
Housing Structures by Number of Rooms in Anson County
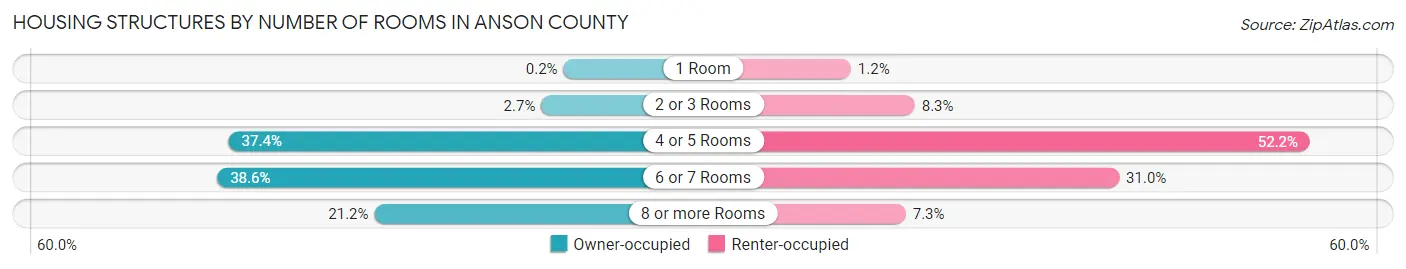
| Number of Rooms | Owner-occupied | Renter-occupied |
| 1 Room | 11 (0.2%) | 33 (1.2%) |
| 2 or 3 Rooms | 148 (2.7%) | 224 (8.3%) |
| 4 or 5 Rooms | 2,081 (37.3%) | 1,405 (52.1%) |
| 6 or 7 Rooms | 2,152 (38.6%) | 835 (31.0%) |
| 8 or more Rooms | 1,180 (21.2%) | 197 (7.3%) |
| Total | 5,572 (100.0%) | 2,694 (100.0%) |
Housing Structure by Heating Type in Anson County
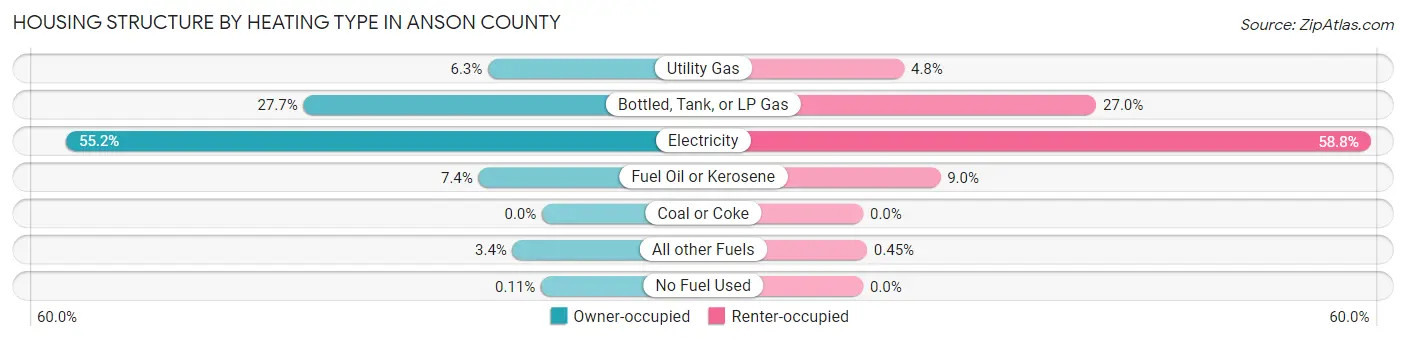
| Heating Type | Owner-occupied | Renter-occupied |
| Utility Gas | 349 (6.3%) | 128 (4.8%) |
| Bottled, Tank, or LP Gas | 1,541 (27.7%) | 728 (27.0%) |
| Electricity | 3,076 (55.2%) | 1,585 (58.8%) |
| Fuel Oil or Kerosene | 410 (7.4%) | 241 (8.9%) |
| Coal or Coke | 0 (0.0%) | 0 (0.0%) |
| All other Fuels | 190 (3.4%) | 12 (0.4%) |
| No Fuel Used | 6 (0.1%) | 0 (0.0%) |
| Total | 5,572 (100.0%) | 2,694 (100.0%) |
Household Vehicle Usage in Anson County
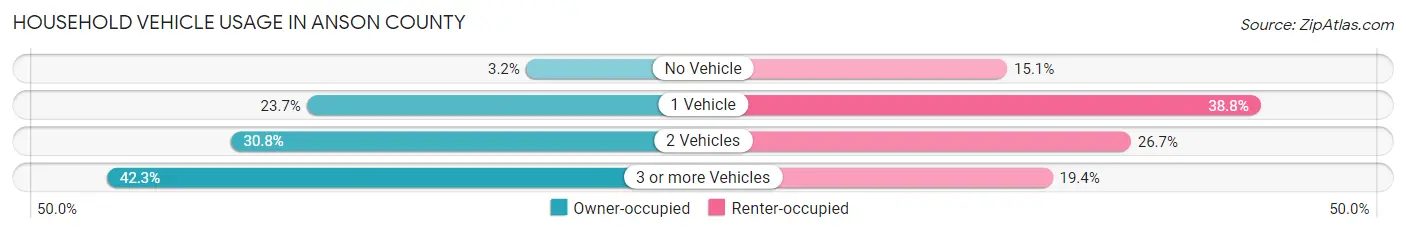
| Vehicles per Household | Owner-occupied | Renter-occupied |
| No Vehicle | 180 (3.2%) | 408 (15.1%) |
| 1 Vehicle | 1,319 (23.7%) | 1,045 (38.8%) |
| 2 Vehicles | 1,715 (30.8%) | 719 (26.7%) |
| 3 or more Vehicles | 2,358 (42.3%) | 522 (19.4%) |
| Total | 5,572 (100.0%) | 2,694 (100.0%) |
Real Estate & Mortgages in Anson County
Real Estate and Mortgage Overview in Anson County
| Characteristic | Without Mortgage | With Mortgage |
| Housing Units | 3,090 | 2,482 |
| Median Property Value | $110,400 | $124,700 |
| Median Household Income | $38,080 | $219 |
| Monthly Housing Costs | $433 | $23 |
| Real Estate Taxes | $970 | $33 |
Property Value by Mortgage Status in Anson County
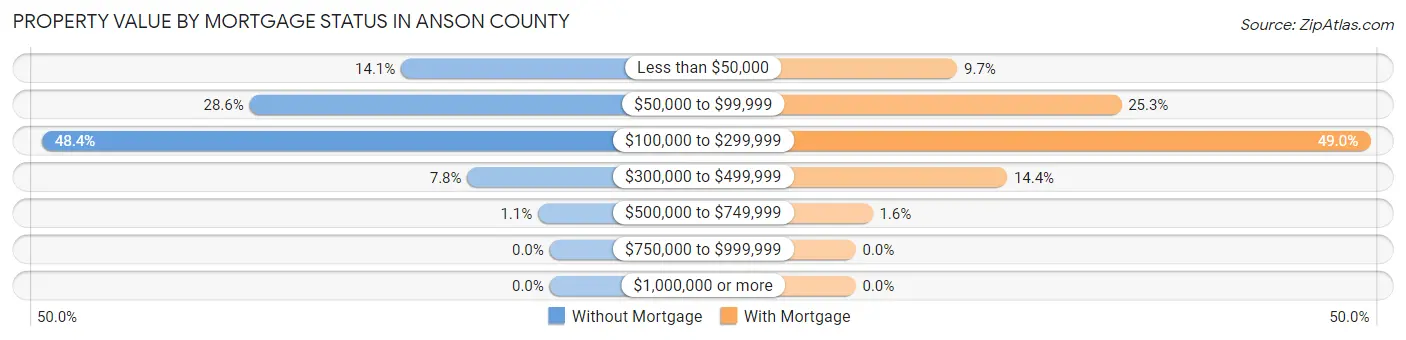
| Property Value | Without Mortgage | With Mortgage |
| Less than $50,000 | 437 (14.1%) | 240 (9.7%) |
| $50,000 to $99,999 | 883 (28.6%) | 628 (25.3%) |
| $100,000 to $299,999 | 1,494 (48.3%) | 1,216 (49.0%) |
| $300,000 to $499,999 | 242 (7.8%) | 358 (14.4%) |
| $500,000 to $749,999 | 34 (1.1%) | 40 (1.6%) |
| $750,000 to $999,999 | 0 (0.0%) | 0 (0.0%) |
| $1,000,000 or more | 0 (0.0%) | 0 (0.0%) |
| Total | 3,090 (100.0%) | 2,482 (100.0%) |
Household Income by Mortgage Status in Anson County
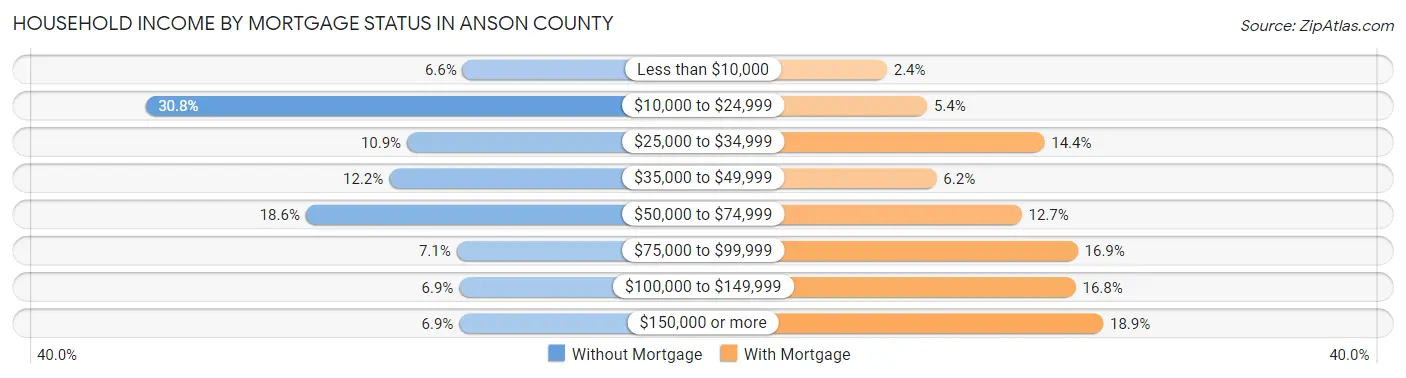
| Household Income | Without Mortgage | With Mortgage |
| Less than $10,000 | 205 (6.6%) | 59 (2.4%) |
| $10,000 to $24,999 | 952 (30.8%) | 135 (5.4%) |
| $25,000 to $34,999 | 336 (10.9%) | 357 (14.4%) |
| $35,000 to $49,999 | 378 (12.2%) | 153 (6.2%) |
| $50,000 to $74,999 | 574 (18.6%) | 314 (12.7%) |
| $75,000 to $99,999 | 219 (7.1%) | 420 (16.9%) |
| $100,000 to $149,999 | 213 (6.9%) | 416 (16.8%) |
| $150,000 or more | 213 (6.9%) | 468 (18.9%) |
| Total | 3,090 (100.0%) | 2,482 (100.0%) |
Property Value to Household Income Ratio in Anson County
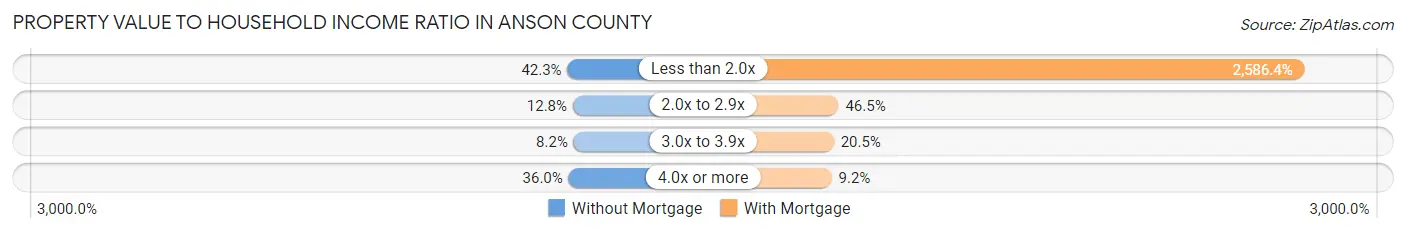
| Value-to-Income Ratio | Without Mortgage | With Mortgage |
| Less than 2.0x | 1,306 (42.3%) | 64,195 (2,586.4%) |
| 2.0x to 2.9x | 396 (12.8%) | 1,155 (46.5%) |
| 3.0x to 3.9x | 252 (8.2%) | 508 (20.5%) |
| 4.0x or more | 1,113 (36.0%) | 229 (9.2%) |
| Total | 3,090 (100.0%) | 2,482 (100.0%) |
Real Estate Taxes by Mortgage Status in Anson County
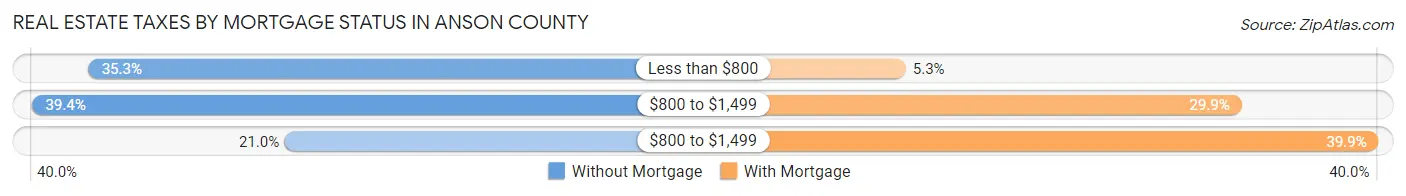
| Property Taxes | Without Mortgage | With Mortgage |
| Less than $800 | 1,091 (35.3%) | 132 (5.3%) |
| $800 to $1,499 | 1,218 (39.4%) | 741 (29.8%) |
| $800 to $1,499 | 648 (21.0%) | 989 (39.9%) |
| Total | 3,090 (100.0%) | 2,482 (100.0%) |
Health & Disability in Anson County
Health Insurance Coverage by Age in Anson County
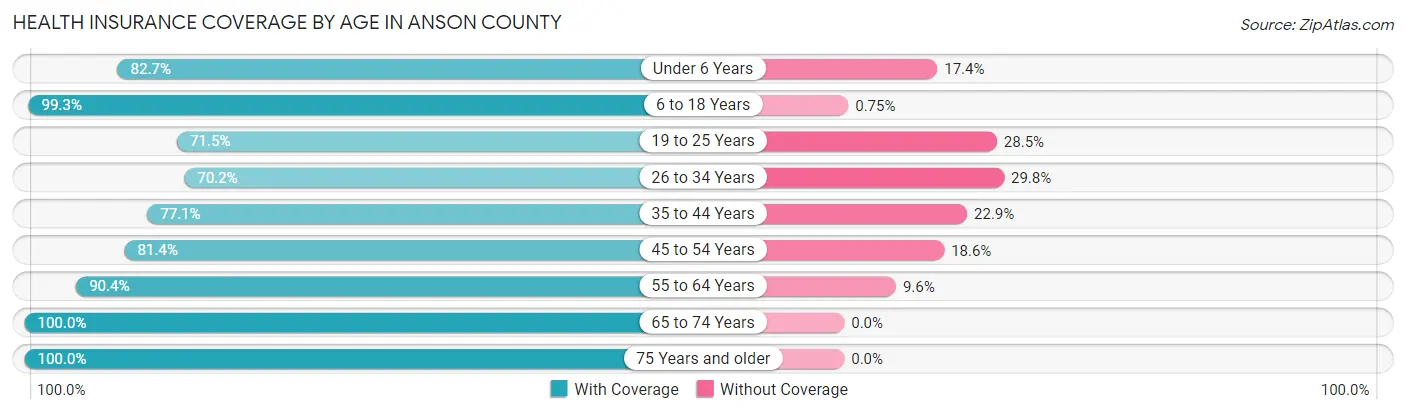
| Age Bracket | With Coverage | Without Coverage |
| Under 6 Years | 1,115 (82.7%) | 234 (17.3%) |
| 6 to 18 Years | 3,422 (99.3%) | 26 (0.7%) |
| 19 to 25 Years | 1,179 (71.5%) | 469 (28.5%) |
| 26 to 34 Years | 1,584 (70.2%) | 672 (29.8%) |
| 35 to 44 Years | 1,704 (77.1%) | 506 (22.9%) |
| 45 to 54 Years | 1,948 (81.4%) | 446 (18.6%) |
| 55 to 64 Years | 2,553 (90.4%) | 272 (9.6%) |
| 65 to 74 Years | 2,390 (100.0%) | 0 (0.0%) |
| 75 Years and older | 1,747 (100.0%) | 0 (0.0%) |
| Total | 17,642 (87.1%) | 2,625 (13.0%) |
Health Insurance Coverage by Citizenship Status in Anson County
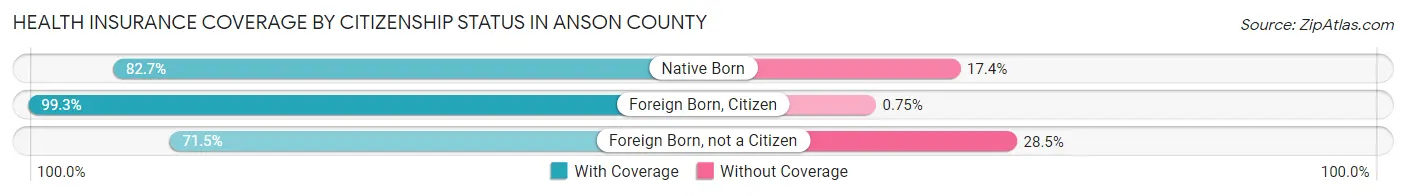
| Citizenship Status | With Coverage | Without Coverage |
| Native Born | 1,115 (82.7%) | 234 (17.3%) |
| Foreign Born, Citizen | 3,422 (99.3%) | 26 (0.7%) |
| Foreign Born, not a Citizen | 1,179 (71.5%) | 469 (28.5%) |
Health Insurance Coverage by Household Income in Anson County
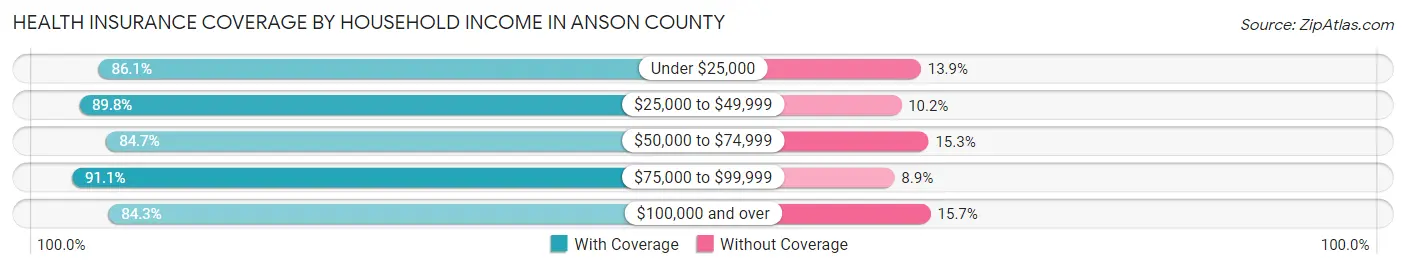
| Household Income | With Coverage | Without Coverage |
| Under $25,000 | 3,817 (86.1%) | 614 (13.9%) |
| $25,000 to $49,999 | 4,574 (89.8%) | 519 (10.2%) |
| $50,000 to $74,999 | 3,247 (84.7%) | 587 (15.3%) |
| $75,000 to $99,999 | 2,378 (91.1%) | 233 (8.9%) |
| $100,000 and over | 3,582 (84.3%) | 667 (15.7%) |
Public vs Private Health Insurance Coverage by Age in Anson County
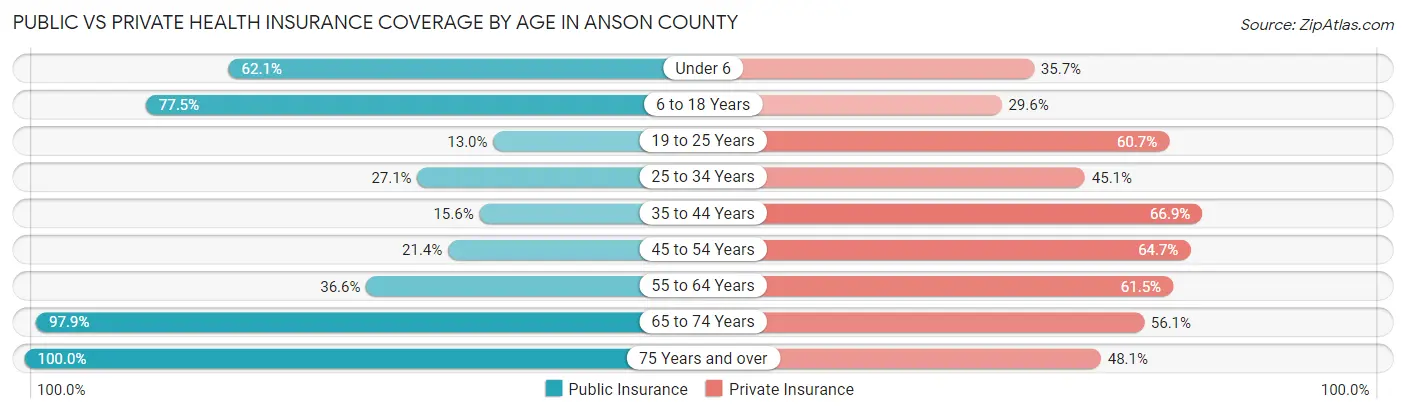
| Age Bracket | Public Insurance | Private Insurance |
| Under 6 | 838 (62.1%) | 481 (35.7%) |
| 6 to 18 Years | 2,672 (77.5%) | 1,022 (29.6%) |
| 19 to 25 Years | 214 (13.0%) | 1,001 (60.7%) |
| 25 to 34 Years | 611 (27.1%) | 1,018 (45.1%) |
| 35 to 44 Years | 344 (15.6%) | 1,478 (66.9%) |
| 45 to 54 Years | 512 (21.4%) | 1,548 (64.7%) |
| 55 to 64 Years | 1,033 (36.6%) | 1,736 (61.5%) |
| 65 to 74 Years | 2,339 (97.9%) | 1,340 (56.1%) |
| 75 Years and over | 1,747 (100.0%) | 840 (48.1%) |
| Total | 10,310 (50.9%) | 10,464 (51.6%) |
Disability Status by Sex by Age in Anson County
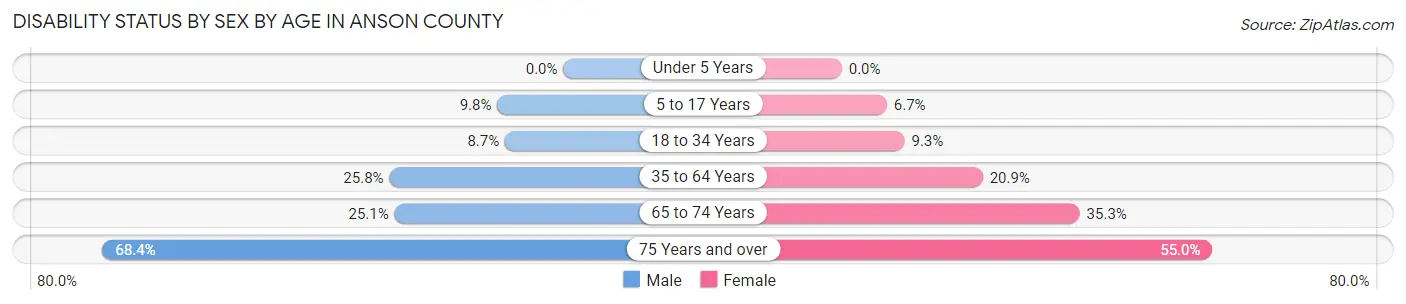
| Age Bracket | Male | Female |
| Under 5 Years | 0 (0.0%) | 0 (0.0%) |
| 5 to 17 Years | 158 (9.8%) | 115 (6.7%) |
| 18 to 34 Years | 217 (8.7%) | 164 (9.3%) |
| 35 to 64 Years | 972 (25.8%) | 767 (20.9%) |
| 65 to 74 Years | 284 (25.1%) | 444 (35.3%) |
| 75 Years and over | 438 (68.4%) | 609 (55.0%) |
Disability Class by Sex by Age in Anson County
Disability Class: Hearing Difficulty
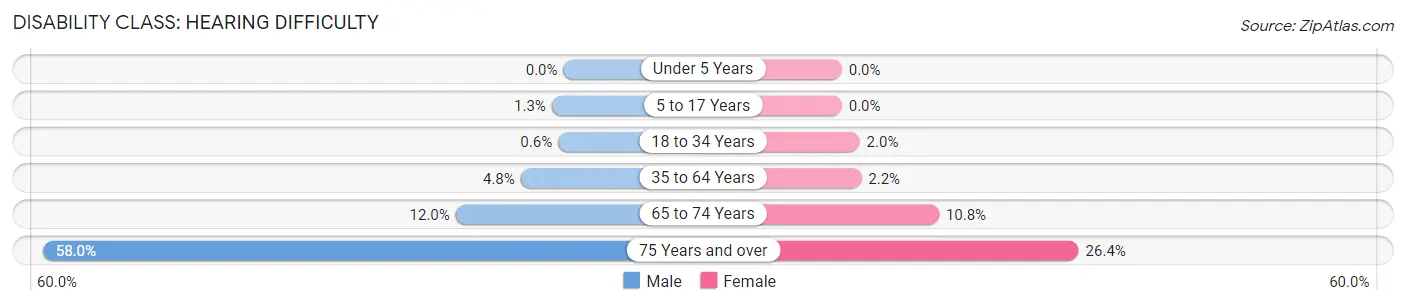
| Age Bracket | Male | Female |
| Under 5 Years | 0 (0.0%) | 0 (0.0%) |
| 5 to 17 Years | 21 (1.3%) | 0 (0.0%) |
| 18 to 34 Years | 15 (0.6%) | 35 (2.0%) |
| 35 to 64 Years | 179 (4.8%) | 80 (2.2%) |
| 65 to 74 Years | 136 (12.0%) | 136 (10.8%) |
| 75 Years and over | 371 (58.0%) | 292 (26.4%) |
Disability Class: Vision Difficulty
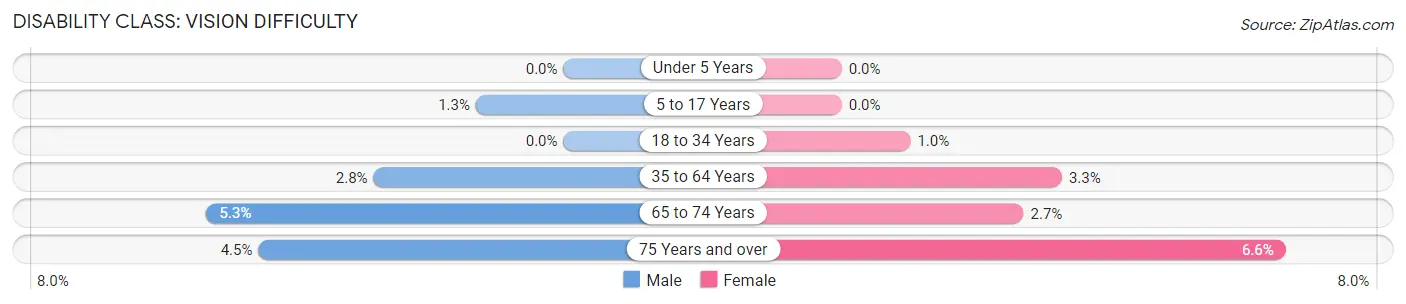
| Age Bracket | Male | Female |
| Under 5 Years | 0 (0.0%) | 0 (0.0%) |
| 5 to 17 Years | 21 (1.3%) | 0 (0.0%) |
| 18 to 34 Years | 0 (0.0%) | 18 (1.0%) |
| 35 to 64 Years | 106 (2.8%) | 120 (3.3%) |
| 65 to 74 Years | 60 (5.3%) | 34 (2.7%) |
| 75 Years and over | 29 (4.5%) | 73 (6.6%) |
Disability Class: Cognitive Difficulty
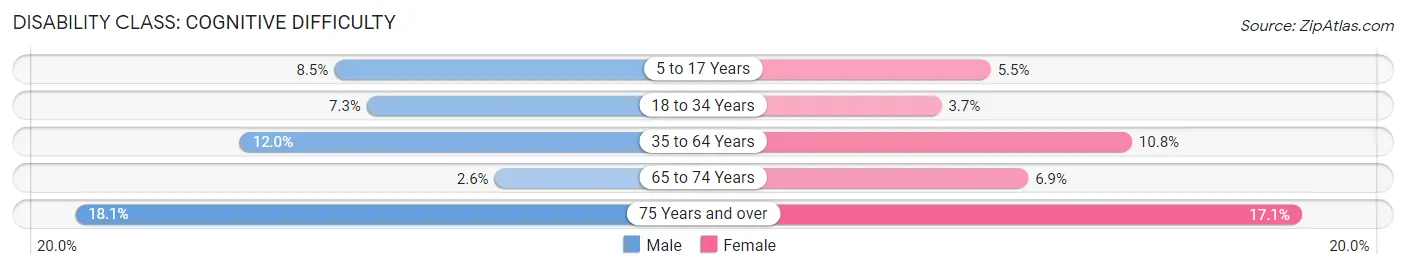
| Age Bracket | Male | Female |
| 5 to 17 Years | 137 (8.5%) | 95 (5.5%) |
| 18 to 34 Years | 183 (7.3%) | 65 (3.7%) |
| 35 to 64 Years | 452 (12.0%) | 395 (10.8%) |
| 65 to 74 Years | 29 (2.6%) | 87 (6.9%) |
| 75 Years and over | 116 (18.1%) | 189 (17.1%) |
Disability Class: Ambulatory Difficulty
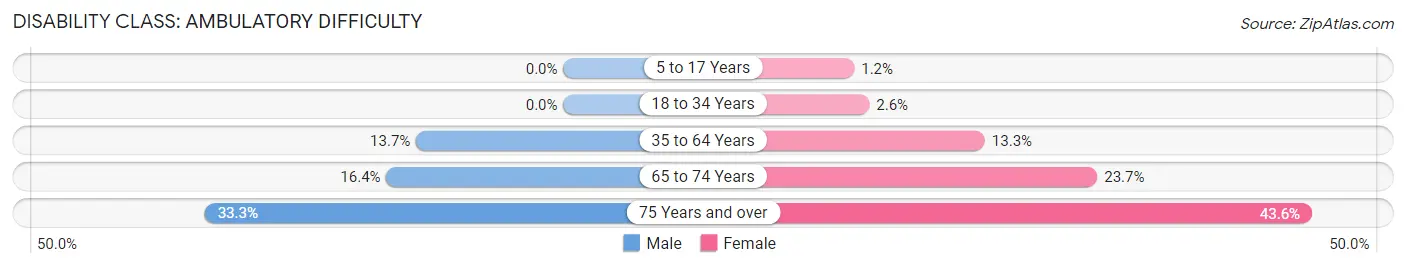
| Age Bracket | Male | Female |
| 5 to 17 Years | 0 (0.0%) | 20 (1.2%) |
| 18 to 34 Years | 0 (0.0%) | 45 (2.6%) |
| 35 to 64 Years | 514 (13.7%) | 487 (13.3%) |
| 65 to 74 Years | 186 (16.4%) | 298 (23.7%) |
| 75 Years and over | 213 (33.3%) | 483 (43.6%) |
Disability Class: Self-Care Difficulty
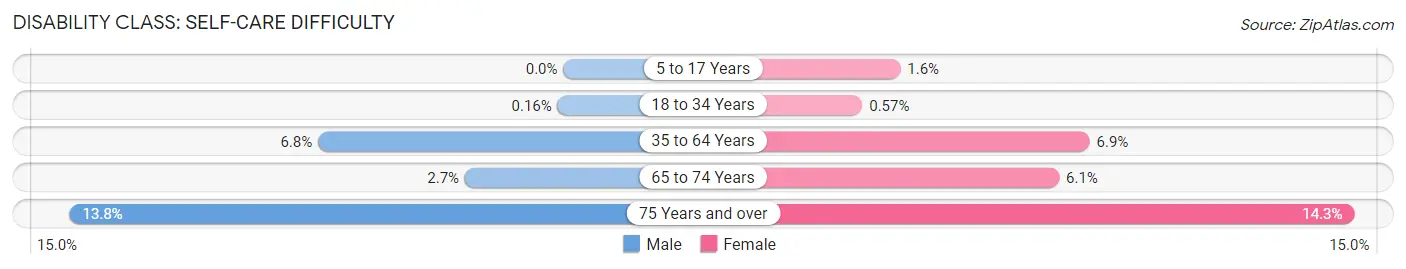
| Age Bracket | Male | Female |
| 5 to 17 Years | 0 (0.0%) | 28 (1.6%) |
| 18 to 34 Years | 4 (0.2%) | 10 (0.6%) |
| 35 to 64 Years | 257 (6.8%) | 253 (6.9%) |
| 65 to 74 Years | 31 (2.7%) | 76 (6.0%) |
| 75 Years and over | 88 (13.8%) | 158 (14.3%) |
Technology Access in Anson County
Computing Device Access in Anson County
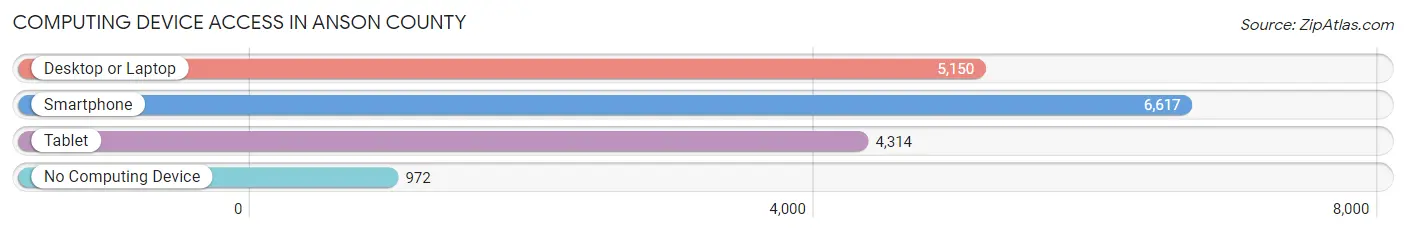
| Device Type | # Households | % Households |
| Desktop or Laptop | 5,150 | 62.3% |
| Smartphone | 6,617 | 80.0% |
| Tablet | 4,314 | 52.2% |
| No Computing Device | 972 | 11.8% |
| Total | 8,266 | 100.0% |
Internet Access in Anson County
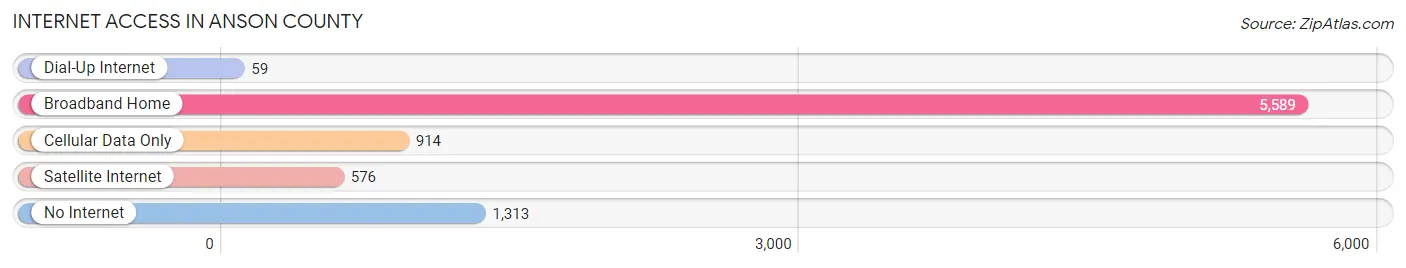
| Internet Type | # Households | % Households |
| Dial-Up Internet | 59 | 0.7% |
| Broadband Home | 5,589 | 67.6% |
| Cellular Data Only | 914 | 11.1% |
| Satellite Internet | 576 | 7.0% |
| No Internet | 1,313 | 15.9% |
| Total | 8,266 | 100.0% |
Anson County Summary
Anson County is located in the Piedmont region of North Carolina, and is part of the Charlotte-Gastonia-Concord Metropolitan Statistical Area. The county was formed in 1750 from Bladen County and named for George Anson, a British admiral who circumnavigated the globe. As of the 2010 census, the population was 26,948.
Geography
Anson County is located in the south-central part of North Carolina, and is bordered by Union County to the north, Stanly County to the east, Richmond County to the south, and Mecklenburg County to the west. The county covers an area of 545 square miles, of which 543 square miles is land and 2 square miles is water. The county is located in the Piedmont region of North Carolina, and is part of the Charlotte-Gastonia-Concord Metropolitan Statistical Area.
The county is divided into two distinct regions: the Uwharrie Mountains in the west and the flat, sandy plains of the east. The Uwharrie Mountains are part of the Appalachian Mountains and are the oldest mountain range in North America. The highest point in the county is the summit of Morrow Mountain, which has an elevation of 1,039 feet. The county is also home to several rivers, including the Pee Dee, Rocky, and Lumber Rivers.
Demographics
As of the 2010 census, there were 26,948 people, 10,717 households, and 7,541 families residing in the county. The population density was 49.5 people per square mile. The racial makeup of the county was 68.2% White, 28.2% African American, 0.4% Native American, 0.4% Asian, 0.1% Pacific Islander, 1.2% from other races, and 1.5% from two or more races. Hispanic or Latino of any race were 2.7% of the population.
The median income for a household in the county was $32,917, and the median income for a family was $40,945. The per capita income for the county was $17,845. About 17.2% of families and 21.2% of the population were below the poverty line, including 28.2% of those under age 18 and 19.2% of those age 65 or over.
Economy
Anson County's economy is largely based on agriculture, with tobacco, cotton, and soybeans being the main crops. The county is also home to several manufacturing companies, including Anson Mills, which produces flour and cornmeal, and Anson Plastics, which produces plastic products. The county is also home to several retail stores, including Walmart, Lowe's, and Food Lion.
The county is served by the Anson County Airport, which is located in Wadesboro. The airport offers general aviation services, as well as charter flights. The county is also served by the Anson County Public Library, which has branches in Wadesboro, Lilesville, and Polkton.
Conclusion
Anson County is a rural county located in the Piedmont region of North Carolina. The county is home to a diverse population, with a strong agricultural economy. The county is served by the Anson County Airport, as well as several retail stores and manufacturing companies. The county is also home to the Anson County Public Library, which serves the residents of the county.
Common Questions
What is Per Capita Income in Anson County?
Per Capita income in Anson County is $22,854.
What is the Median Family Income in Anson County?
Median Family Income in Anson County is $60,146.
What is the Median Household income in Anson County?
Median Household Income in Anson County is $42,000.
What is Income or Wage Gap in Anson County?
Income or Wage Gap in Anson County is 16.5%.
Women in Anson County earn 83.5 cents for every dollar earned by a man.
What is Family Income Deficit in Anson County?
Family Income Deficit in Anson County is $8,154.
Families that are below poverty line in Anson County earn $8,154 less on average than the poverty threshold level.
What is Inequality or Gini Index in Anson County?
Inequality or Gini Index in Anson County is 0.45.
What is the Total Population of Anson County?
Total Population of Anson County is 22,200.
What is the Total Male Population of Anson County?
Total Male Population of Anson County is 11,246.
What is the Total Female Population of Anson County?
Total Female Population of Anson County is 10,954.
What is the Ratio of Males per 100 Females in Anson County?
There are 102.67 Males per 100 Females in Anson County.
What is the Ratio of Females per 100 Males in Anson County?
There are 97.40 Females per 100 Males in Anson County.
What is the Median Population Age in Anson County?
Median Population Age in Anson County is 41.1 Years.
What is the Average Family Size in Anson County
Average Family Size in Anson County is 3.3 People.
What is the Average Household Size in Anson County
Average Household Size in Anson County is 2.5 People.
How Large is the Labor Force in Anson County?
There are 9,345 People in the Labor Forcein in Anson County.
What is the Percentage of People in the Labor Force in Anson County?
50.8% of People are in the Labor Force in Anson County.
What is the Unemployment Rate in Anson County?
Unemployment Rate in Anson County is 6.4%.