Alleghany County, NC Map & Demographics
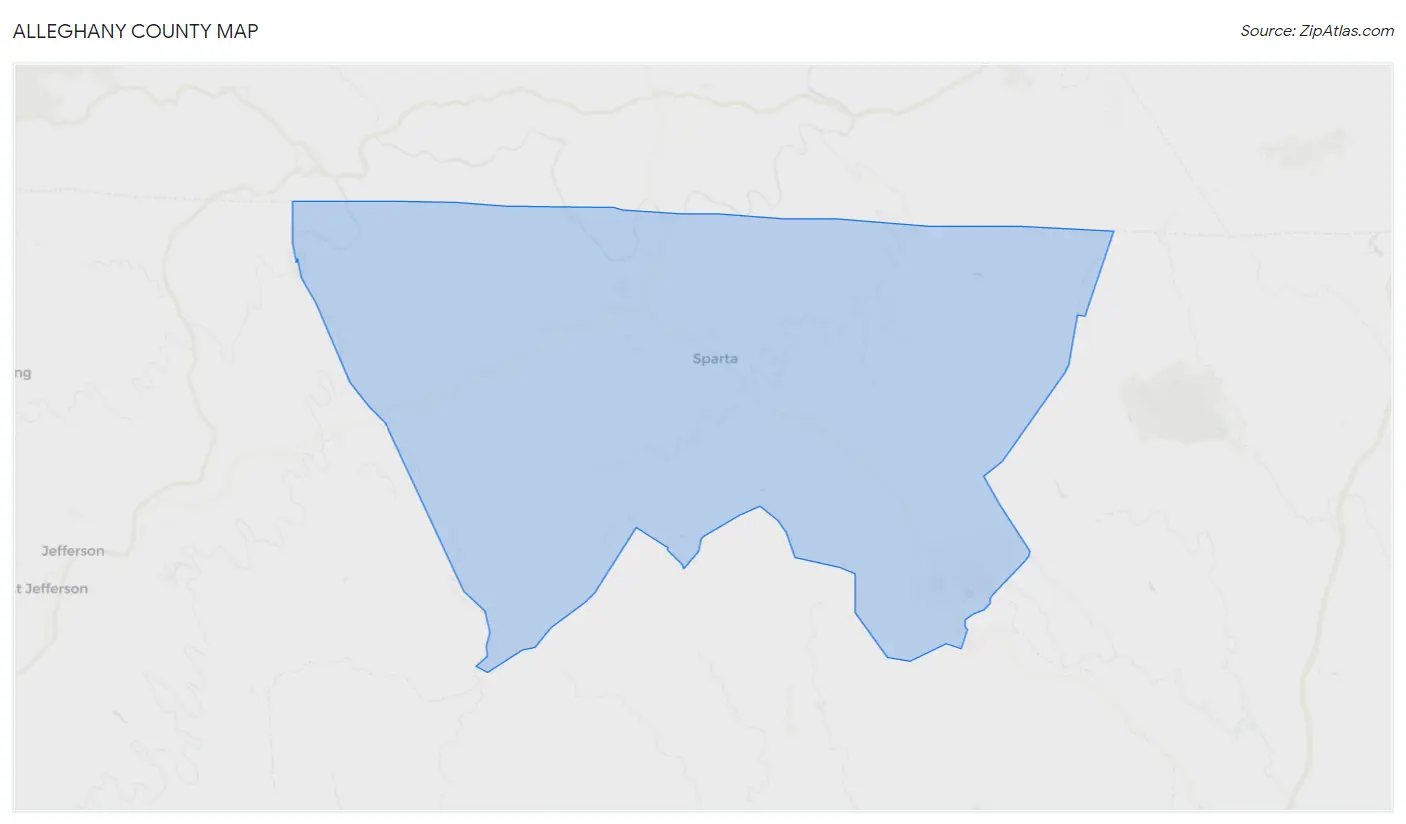
Alleghany County Map
Alleghany County Overview
$32,330
PER CAPITA INCOME
$57,432
AVG FAMILY INCOME
$42,115
AVG HOUSEHOLD INCOME
19.2%
WAGE / INCOME GAP [ % ]
80.8¢/ $1
WAGE / INCOME GAP [ $ ]
$11,892
FAMILY INCOME DEFICIT
0.52
INEQUALITY / GINI INDEX
10,989
TOTAL POPULATION
5,340
MALE POPULATION
5,649
FEMALE POPULATION
94.53
MALES / 100 FEMALES
105.79
FEMALES / 100 MALES
50.6
MEDIAN AGE
2.7
AVG FAMILY SIZE
2.2
AVG HOUSEHOLD SIZE
4,646
LABOR FORCE [ PEOPLE ]
49.4%
PERCENT IN LABOR FORCE
5.3%
UNEMPLOYMENT RATE
Alleghany County Area Codes
Income in Alleghany County
Income Overview in Alleghany County
Per Capita Income in Alleghany County is $32,330, while median incomes of families and households are $57,432 and $42,115 respectively.
| Characteristic | Number | Measure |
| Per Capita Income | 10,989 | $32,330 |
| Median Family Income | 3,204 | $57,432 |
| Mean Family Income | 3,204 | $84,940 |
| Median Household Income | 4,937 | $42,115 |
| Mean Household Income | 4,937 | $70,181 |
| Income Deficit | 3,204 | $11,892 |
| Wage / Income Gap (%) | 10,989 | 19.22% |
| Wage / Income Gap ($) | 10,989 | 80.78¢ per $1 |
| Gini / Inequality Index | 10,989 | 0.52 |
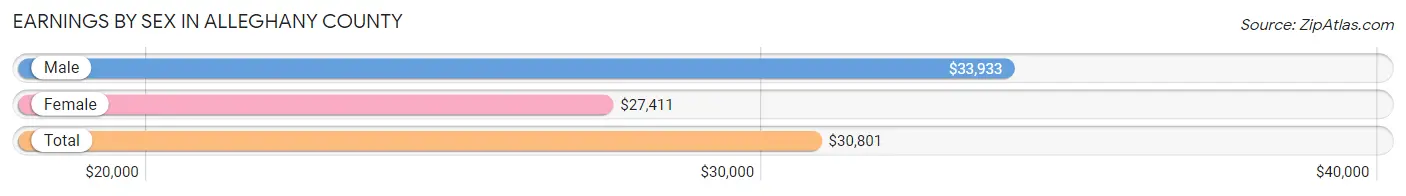
Earnings by Sex in Alleghany County
Average Earnings in Alleghany County are $30,801, $33,933 for men and $27,411 for women, a difference of 19.2%.
| Sex | Number | Average Earnings |
| Male | 2,511 (51.8%) | $33,933 |
| Female | 2,333 (48.2%) | $27,411 |
| Total | 4,844 (100.0%) | $30,801 |
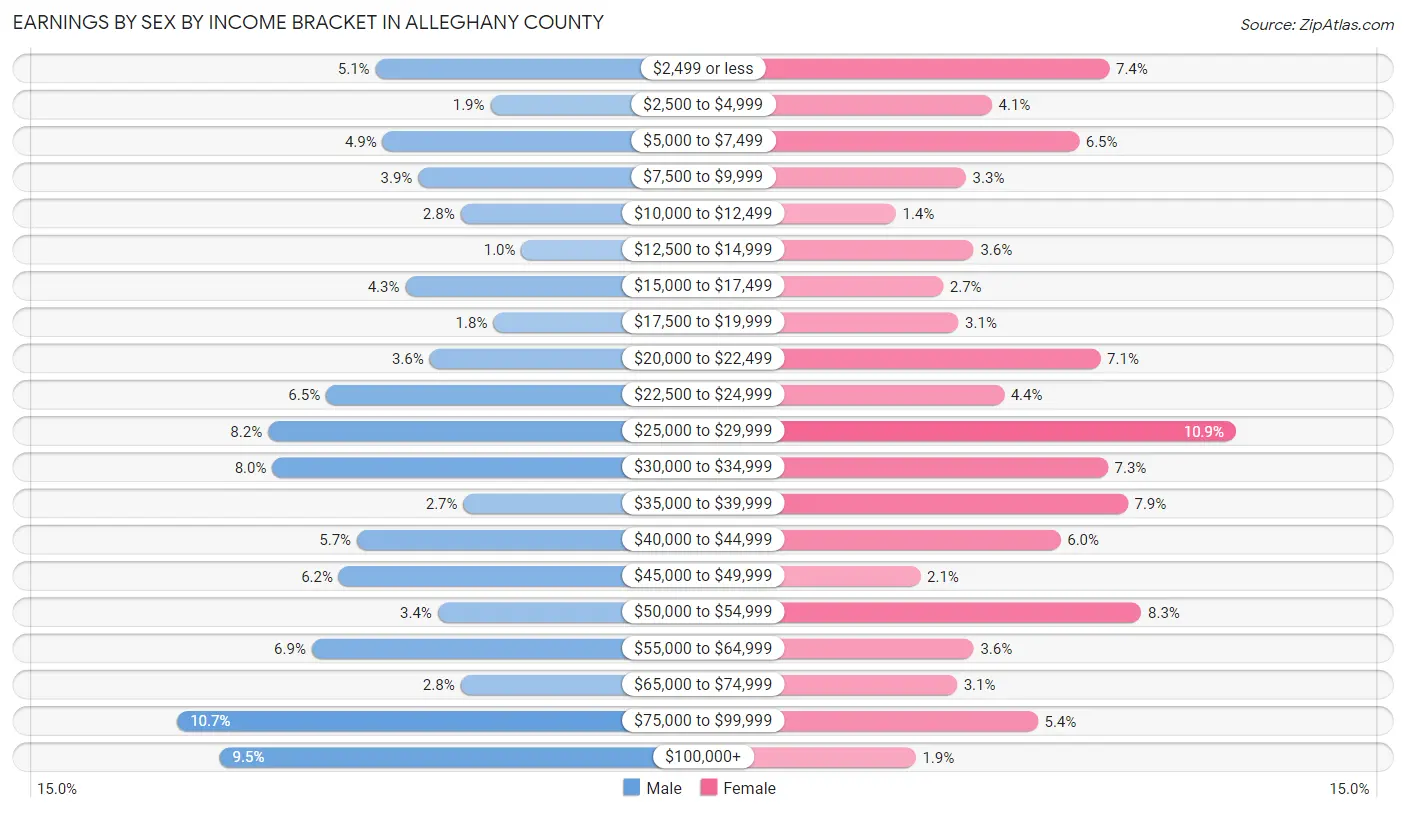
Earnings by Sex by Income Bracket in Alleghany County
The most common earnings brackets in Alleghany County are $75,000 to $99,999 for men (269 | 10.7%) and $25,000 to $29,999 for women (255 | 10.9%).
| Income | Male | Female |
| $2,499 or less | 129 (5.1%) | 172 (7.4%) |
| $2,500 to $4,999 | 48 (1.9%) | 95 (4.1%) |
| $5,000 to $7,499 | 124 (4.9%) | 152 (6.5%) |
| $7,500 to $9,999 | 99 (3.9%) | 78 (3.3%) |
| $10,000 to $12,499 | 69 (2.8%) | 32 (1.4%) |
| $12,500 to $14,999 | 26 (1.0%) | 83 (3.6%) |
| $15,000 to $17,499 | 108 (4.3%) | 63 (2.7%) |
| $17,500 to $19,999 | 46 (1.8%) | 73 (3.1%) |
| $20,000 to $22,499 | 91 (3.6%) | 166 (7.1%) |
| $22,500 to $24,999 | 164 (6.5%) | 103 (4.4%) |
| $25,000 to $29,999 | 205 (8.2%) | 255 (10.9%) |
| $30,000 to $34,999 | 202 (8.0%) | 171 (7.3%) |
| $35,000 to $39,999 | 67 (2.7%) | 184 (7.9%) |
| $40,000 to $44,999 | 142 (5.7%) | 140 (6.0%) |
| $45,000 to $49,999 | 155 (6.2%) | 48 (2.1%) |
| $50,000 to $54,999 | 85 (3.4%) | 193 (8.3%) |
| $55,000 to $64,999 | 174 (6.9%) | 83 (3.6%) |
| $65,000 to $74,999 | 69 (2.8%) | 72 (3.1%) |
| $75,000 to $99,999 | 269 (10.7%) | 125 (5.4%) |
| $100,000+ | 239 (9.5%) | 45 (1.9%) |
| Total | 2,511 (100.0%) | 2,333 (100.0%) |
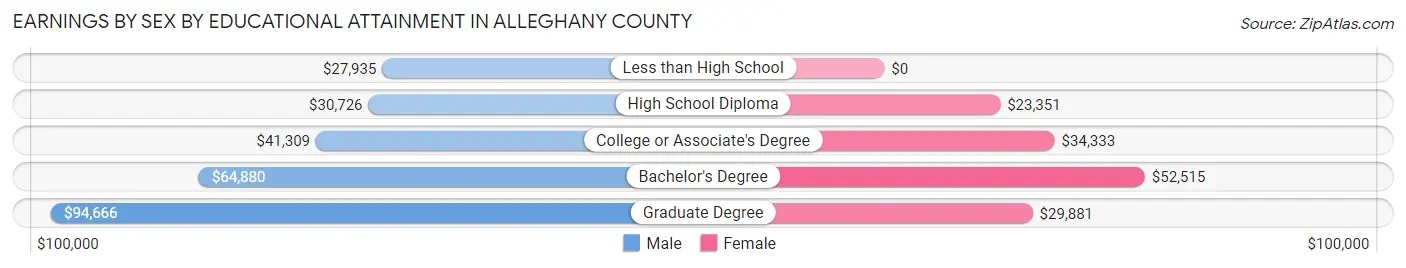
Earnings by Sex by Educational Attainment in Alleghany County
Average earnings in Alleghany County are $36,732 for men and $32,571 for women, a difference of 11.3%. Men with an educational attainment of graduate degree enjoy the highest average annual earnings of $94,666, while those with less than high school education earn the least with $27,935. Women with an educational attainment of bachelor's degree earn the most with the average annual earnings of $52,515, while those with high school diploma education have the smallest earnings of $23,351.
| Educational Attainment | Male Income | Female Income |
| Less than High School | $27,935 | $0 |
| High School Diploma | $30,726 | $23,351 |
| College or Associate's Degree | $41,309 | $34,333 |
| Bachelor's Degree | $64,880 | $52,515 |
| Graduate Degree | $94,666 | $29,881 |
| Total | $36,732 | $32,571 |
Family Income in Alleghany County
Family Income Brackets in Alleghany County
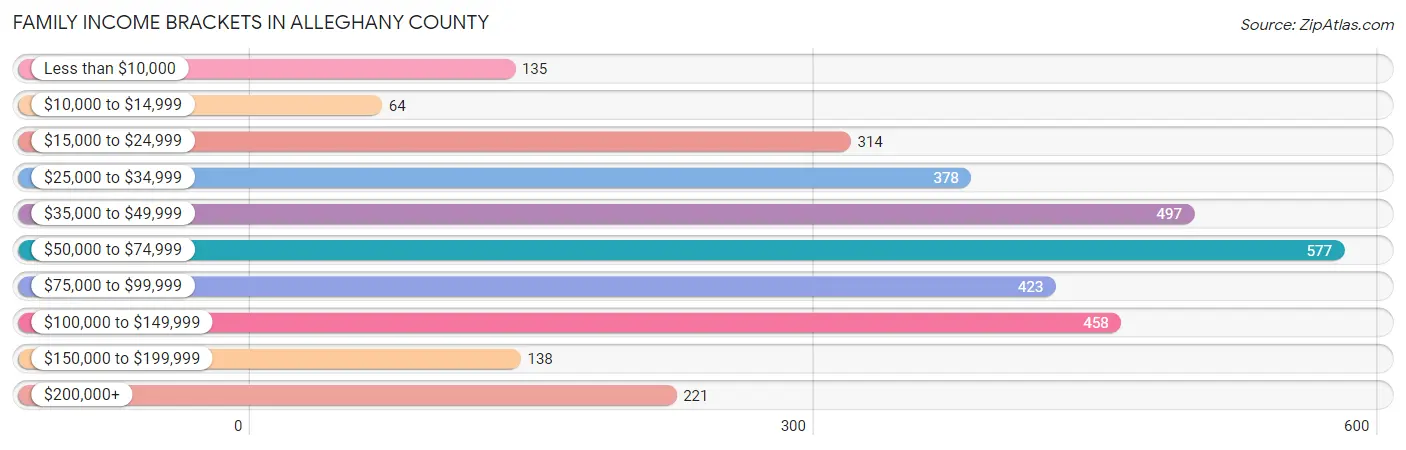
According to the Alleghany County family income data, there are 577 families falling into the $50,000 to $74,999 income range, which is the most common income bracket and makes up 18.0% of all families. Conversely, the $10,000 to $14,999 income bracket is the least frequent group with only 64 families (2.0%) belonging to this category.
| Income Bracket | # Families | % Families |
| Less than $10,000 | 135 | 4.2% |
| $10,000 to $14,999 | 64 | 2.0% |
| $15,000 to $24,999 | 314 | 9.8% |
| $25,000 to $34,999 | 378 | 11.8% |
| $35,000 to $49,999 | 497 | 15.5% |
| $50,000 to $74,999 | 577 | 18.0% |
| $75,000 to $99,999 | 423 | 13.2% |
| $100,000 to $149,999 | 458 | 14.3% |
| $150,000 to $199,999 | 138 | 4.3% |
| $200,000+ | 221 | 6.9% |
Family Income by Famaliy Size in Alleghany County
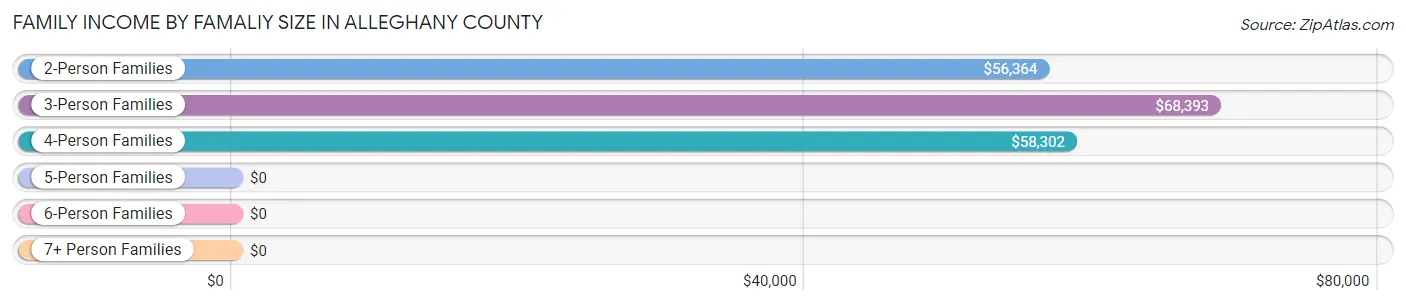
3-person families (584 | 18.2%) account for the highest median family income in Alleghany County with $68,393 per family, while 2-person families (2,012 | 62.8%) have the highest median income of $28,182 per family member.
| Income Bracket | # Families | Median Income |
| 2-Person Families | 2,012 (62.8%) | $56,364 |
| 3-Person Families | 584 (18.2%) | $68,393 |
| 4-Person Families | 396 (12.4%) | $58,302 |
| 5-Person Families | 126 (3.9%) | $0 |
| 6-Person Families | 81 (2.5%) | $0 |
| 7+ Person Families | 5 (0.2%) | $0 |
| Total | 3,204 (100.0%) | $57,432 |
Family Income by Number of Earners in Alleghany County
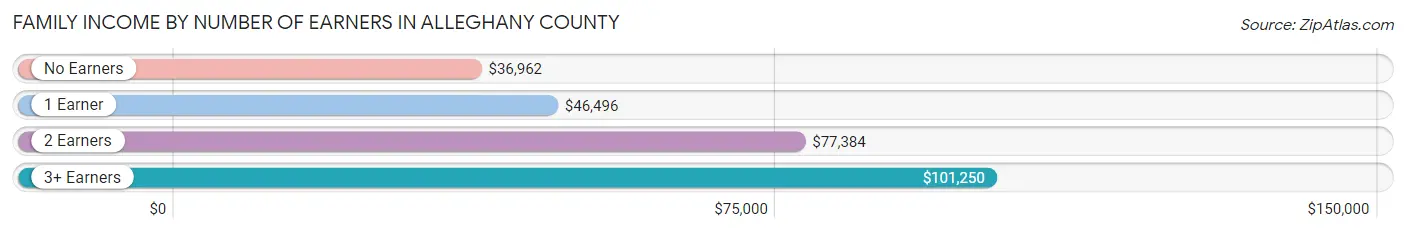
The median family income in Alleghany County is $57,432, with families comprising 3+ earners (175) having the highest median family income of $101,250, while families with no earners (846) have the lowest median family income of $36,962, accounting for 5.5% and 26.4% of families, respectively.
| Number of Earners | # Families | Median Income |
| No Earners | 846 (26.4%) | $36,962 |
| 1 Earner | 1,043 (32.6%) | $46,496 |
| 2 Earners | 1,140 (35.6%) | $77,384 |
| 3+ Earners | 175 (5.5%) | $101,250 |
| Total | 3,204 (100.0%) | $57,432 |
Household Income in Alleghany County
Household Income Brackets in Alleghany County
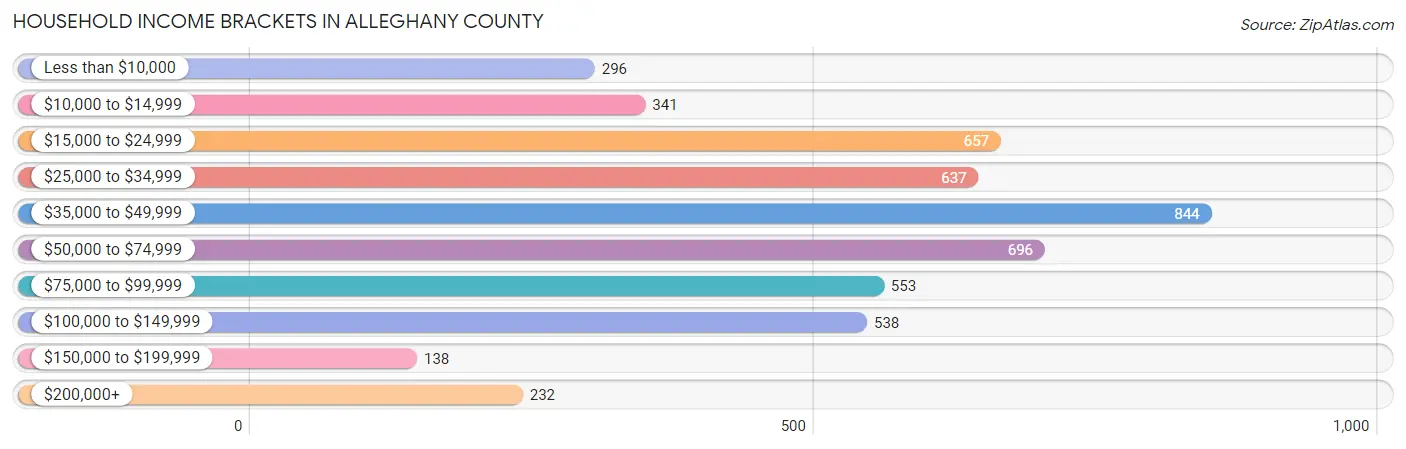
With 844 households falling in the category, the $35,000 to $49,999 income range is the most frequent in Alleghany County, accounting for 17.1% of all households. In contrast, only 138 households (2.8%) fall into the $150,000 to $199,999 income bracket, making it the least populous group.
| Income Bracket | # Households | % Households |
| Less than $10,000 | 296 | 6.0% |
| $10,000 to $14,999 | 341 | 6.9% |
| $15,000 to $24,999 | 657 | 13.3% |
| $25,000 to $34,999 | 637 | 12.9% |
| $35,000 to $49,999 | 844 | 17.1% |
| $50,000 to $74,999 | 696 | 14.1% |
| $75,000 to $99,999 | 553 | 11.2% |
| $100,000 to $149,999 | 538 | 10.9% |
| $150,000 to $199,999 | 138 | 2.8% |
| $200,000+ | 232 | 4.7% |
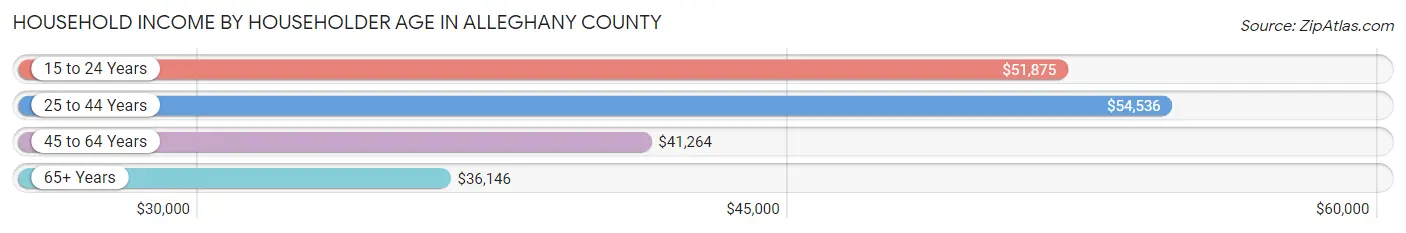
Household Income by Householder Age in Alleghany County
The median household income in Alleghany County is $42,115, with the highest median household income of $54,536 found in the 25 to 44 years age bracket for the primary householder. A total of 1,103 households (22.3%) fall into this category. Meanwhile, the 65+ years age bracket for the primary householder has the lowest median household income of $36,146, with 1,942 households (39.3%) in this group.
| Income Bracket | # Households | Median Income |
| 15 to 24 Years | 158 (3.2%) | $51,875 |
| 25 to 44 Years | 1,103 (22.3%) | $54,536 |
| 45 to 64 Years | 1,734 (35.1%) | $41,264 |
| 65+ Years | 1,942 (39.3%) | $36,146 |
| Total | 4,937 (100.0%) | $42,115 |
Poverty in Alleghany County
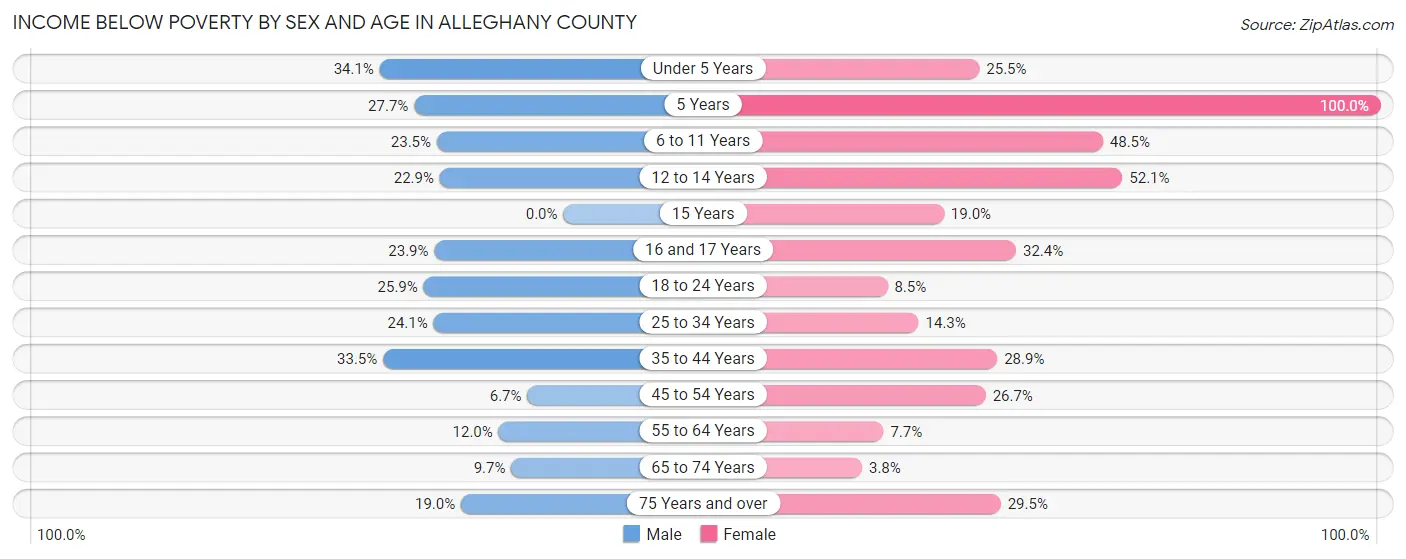
Income Below Poverty by Sex and Age in Alleghany County
With 18.2% poverty level for males and 20.8% for females among the residents of Alleghany County, under 5 year old males and 5 year old females are the most vulnerable to poverty, with 75 males (34.1%) and 59 females (100.0%) in their respective age groups living below the poverty level.
| Age Bracket | Male | Female |
| Under 5 Years | 75 (34.1%) | 59 (25.5%) |
| 5 Years | 18 (27.7%) | 59 (100.0%) |
| 6 to 11 Years | 77 (23.5%) | 126 (48.5%) |
| 12 to 14 Years | 25 (22.9%) | 100 (52.1%) |
| 15 Years | 0 (0.0%) | 18 (19.0%) |
| 16 and 17 Years | 17 (23.9%) | 44 (32.4%) |
| 18 to 24 Years | 90 (25.9%) | 29 (8.5%) |
| 25 to 34 Years | 147 (24.1%) | 79 (14.3%) |
| 35 to 44 Years | 174 (33.5%) | 161 (28.8%) |
| 45 to 54 Years | 47 (6.7%) | 184 (26.7%) |
| 55 to 64 Years | 104 (12.0%) | 69 (7.7%) |
| 65 to 74 Years | 84 (9.7%) | 34 (3.8%) |
| 75 Years and over | 102 (19.0%) | 205 (29.5%) |
| Total | 960 (18.2%) | 1,167 (20.8%) |
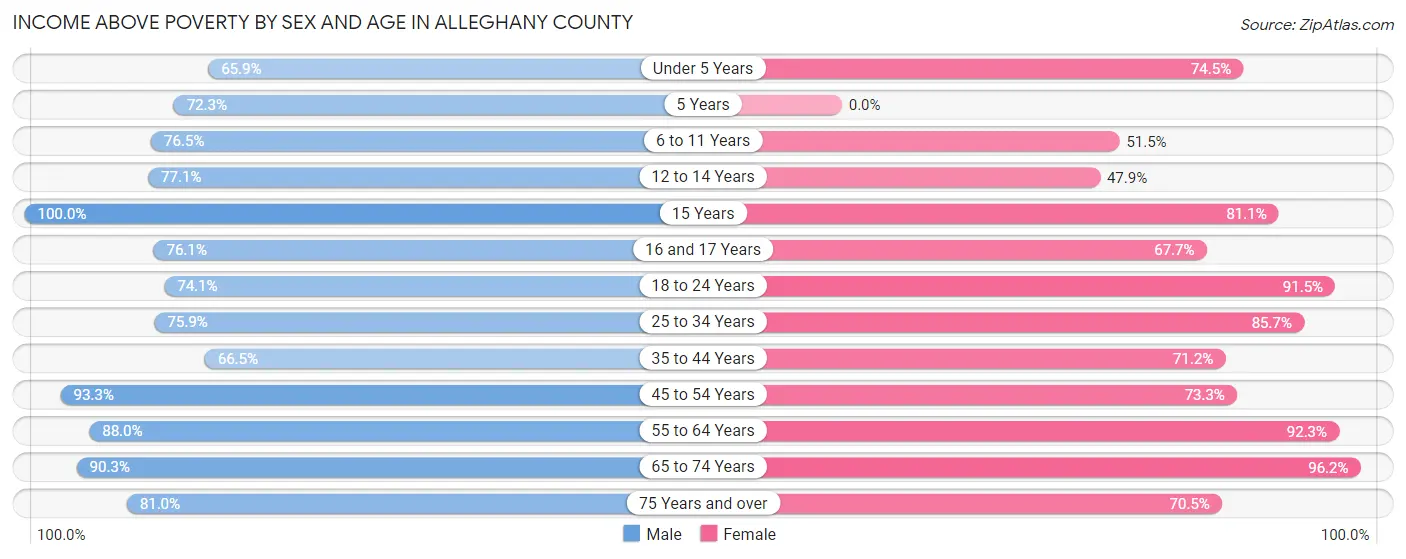
Income Above Poverty by Sex and Age in Alleghany County
According to the poverty statistics in Alleghany County, males aged 15 years and females aged 65 to 74 years are the age groups that are most secure financially, with 100.0% of males and 96.2% of females in these age groups living above the poverty line.
| Age Bracket | Male | Female |
| Under 5 Years | 145 (65.9%) | 172 (74.5%) |
| 5 Years | 47 (72.3%) | 0 (0.0%) |
| 6 to 11 Years | 251 (76.5%) | 134 (51.5%) |
| 12 to 14 Years | 84 (77.1%) | 92 (47.9%) |
| 15 Years | 26 (100.0%) | 77 (81.0%) |
| 16 and 17 Years | 54 (76.1%) | 92 (67.6%) |
| 18 to 24 Years | 257 (74.1%) | 313 (91.5%) |
| 25 to 34 Years | 463 (75.9%) | 475 (85.7%) |
| 35 to 44 Years | 346 (66.5%) | 397 (71.2%) |
| 45 to 54 Years | 657 (93.3%) | 505 (73.3%) |
| 55 to 64 Years | 761 (88.0%) | 823 (92.3%) |
| 65 to 74 Years | 786 (90.3%) | 871 (96.2%) |
| 75 Years and over | 435 (81.0%) | 490 (70.5%) |
| Total | 4,312 (81.8%) | 4,441 (79.2%) |
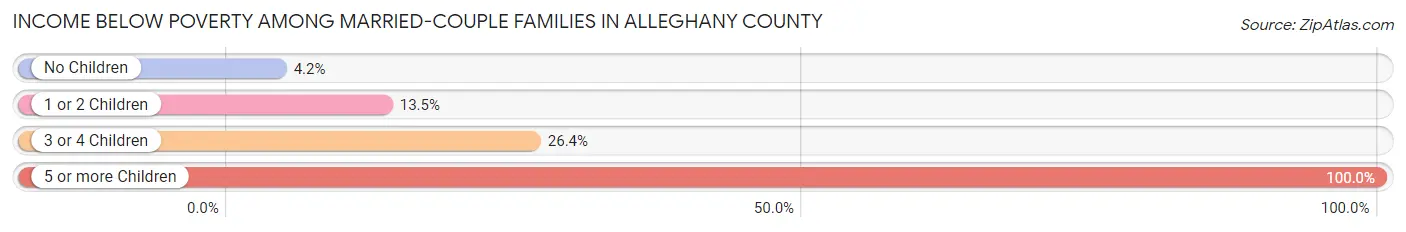
Income Below Poverty Among Married-Couple Families in Alleghany County
The poverty statistics for married-couple families in Alleghany County show that 7.7% or 210 of the total 2,711 families live below the poverty line. Families with 5 or more children have the highest poverty rate of 100.0%, comprising of 5 families. On the other hand, families with no children have the lowest poverty rate of 4.2%, which includes 81 families.
| Children | Above Poverty | Below Poverty |
| No Children | 1,828 (95.8%) | 81 (4.2%) |
| 1 or 2 Children | 578 (86.5%) | 90 (13.5%) |
| 3 or 4 Children | 95 (73.6%) | 34 (26.4%) |
| 5 or more Children | 0 (0.0%) | 5 (100.0%) |
| Total | 2,501 (92.2%) | 210 (7.7%) |
Income Below Poverty Among Single-Parent Households in Alleghany County
According to the poverty data in Alleghany County, 29.1% or 44 single-father households and 38.6% or 132 single-mother households are living below the poverty line. Among single-father households, those with 1 or 2 children have the highest poverty rate, with 22 households (66.7%) experiencing poverty. Likewise, among single-mother households, those with 3 or 4 children have the highest poverty rate, with 69 households (100.0%) falling below the poverty line.
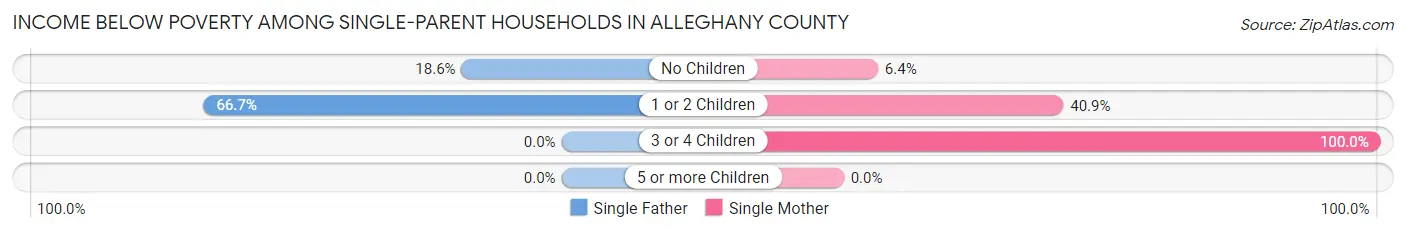
| Children | Single Father | Single Mother |
| No Children | 22 (18.6%) | 9 (6.4%) |
| 1 or 2 Children | 22 (66.7%) | 54 (40.9%) |
| 3 or 4 Children | 0 (0.0%) | 69 (100.0%) |
| 5 or more Children | 0 (0.0%) | 0 (0.0%) |
| Total | 44 (29.1%) | 132 (38.6%) |
Income Below Poverty Among Married-Couple vs Single-Parent Households in Alleghany County
The poverty data for Alleghany County shows that 210 of the married-couple family households (7.7%) and 176 of the single-parent households (35.7%) are living below the poverty level. Within the married-couple family households, those with 5 or more children have the highest poverty rate, with 5 households (100.0%) falling below the poverty line. Among the single-parent households, those with 3 or 4 children have the highest poverty rate, with 69 household (100.0%) living below poverty.
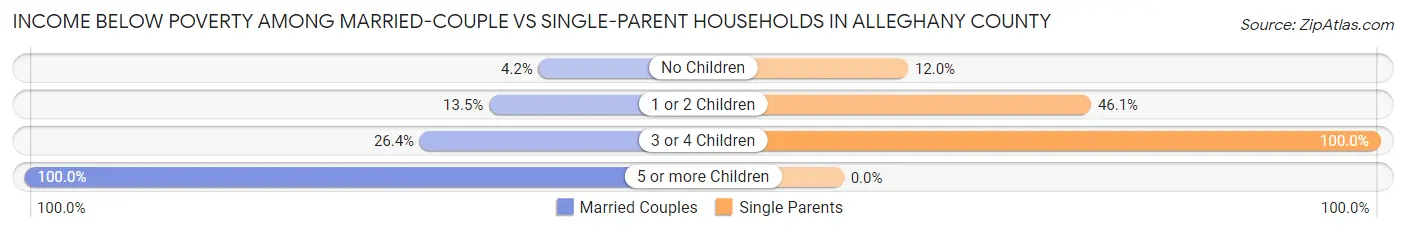
| Children | Married-Couple Families | Single-Parent Households |
| No Children | 81 (4.2%) | 31 (12.0%) |
| 1 or 2 Children | 90 (13.5%) | 76 (46.1%) |
| 3 or 4 Children | 34 (26.4%) | 69 (100.0%) |
| 5 or more Children | 5 (100.0%) | 0 (0.0%) |
| Total | 210 (7.7%) | 176 (35.7%) |
Race in Alleghany County
The most populous races in Alleghany County are White / Caucasian (10,270 | 93.5%), Hispanic or Latino (1,103 | 10.0%), and Two or more Races (412 | 3.7%).
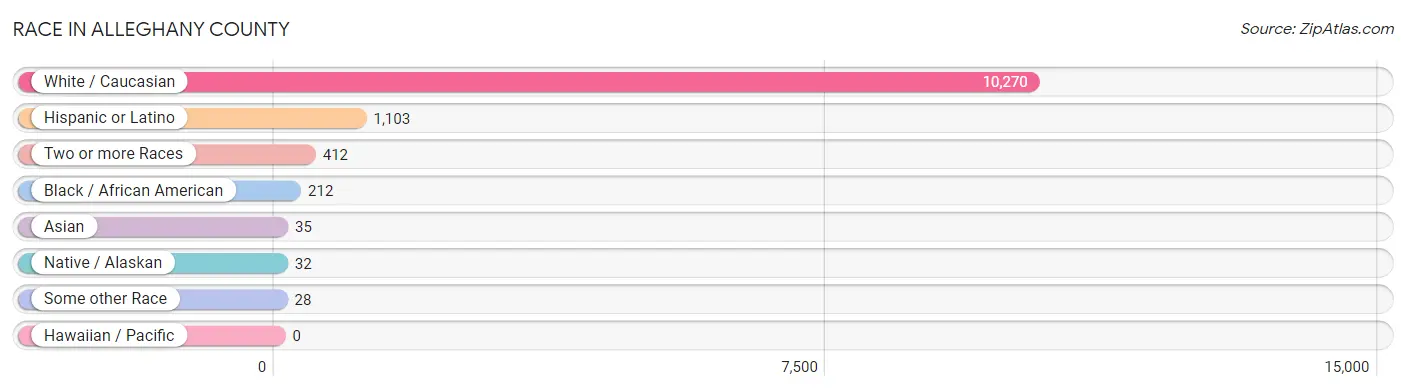
| Race | # Population | % Population |
| Asian | 35 | 0.3% |
| Black / African American | 212 | 1.9% |
| Hawaiian / Pacific | 0 | 0.0% |
| Hispanic or Latino | 1,103 | 10.0% |
| Native / Alaskan | 32 | 0.3% |
| White / Caucasian | 10,270 | 93.5% |
| Two or more Races | 412 | 3.7% |
| Some other Race | 28 | 0.3% |
| Total | 10,989 | 100.0% |
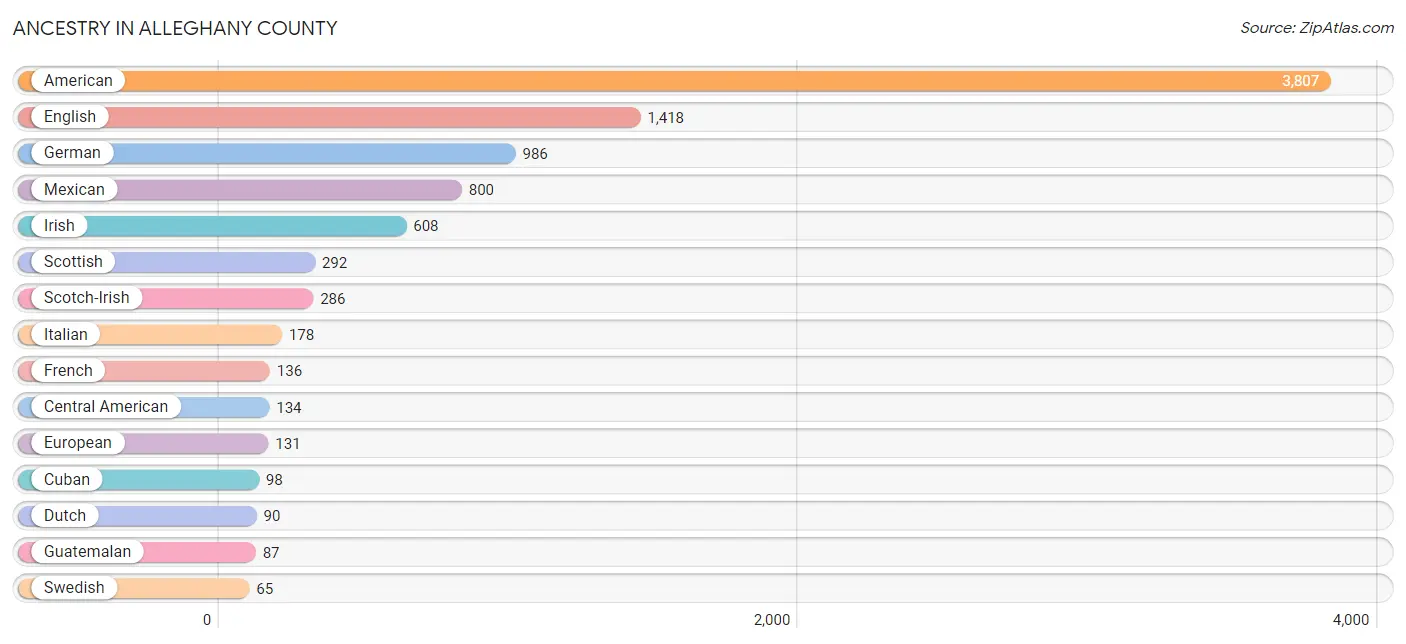
Ancestry in Alleghany County
The most populous ancestries reported in Alleghany County are American (3,807 | 34.6%), English (1,418 | 12.9%), German (986 | 9.0%), Mexican (800 | 7.3%), and Irish (608 | 5.5%), together accounting for 69.3% of all Alleghany County residents.
| Ancestry | # Population | % Population |
| African | 19 | 0.2% |
| Aleut | 15 | 0.1% |
| American | 3,807 | 34.6% |
| Bhutanese | 12 | 0.1% |
| Blackfeet | 9 | 0.1% |
| British | 16 | 0.2% |
| Canadian | 8 | 0.1% |
| Central American | 134 | 1.2% |
| Cherokee | 24 | 0.2% |
| Colombian | 5 | 0.1% |
| Cuban | 98 | 0.9% |
| Dutch | 90 | 0.8% |
| Eastern European | 4 | 0.0% |
| English | 1,418 | 12.9% |
| European | 131 | 1.2% |
| French | 136 | 1.2% |
| German | 986 | 9.0% |
| Guatemalan | 87 | 0.8% |
| Hungarian | 45 | 0.4% |
| Irish | 608 | 5.5% |
| Italian | 178 | 1.6% |
| Korean | 21 | 0.2% |
| Lithuanian | 7 | 0.1% |
| Mexican | 800 | 7.3% |
| Navajo | 3 | 0.0% |
| Norwegian | 14 | 0.1% |
| Polish | 46 | 0.4% |
| Puerto Rican | 24 | 0.2% |
| Romanian | 20 | 0.2% |
| Salvadoran | 47 | 0.4% |
| Scandinavian | 8 | 0.1% |
| Scotch-Irish | 286 | 2.6% |
| Scottish | 292 | 2.7% |
| Sioux | 12 | 0.1% |
| South American | 5 | 0.1% |
| Spaniard | 35 | 0.3% |
| Sri Lankan | 2 | 0.0% |
| Subsaharan African | 19 | 0.2% |
| Swedish | 65 | 0.6% |
| Swiss | 58 | 0.5% |
| Ukrainian | 21 | 0.2% |
| Welsh | 39 | 0.4% | View All 42 Rows |
Immigrants in Alleghany County
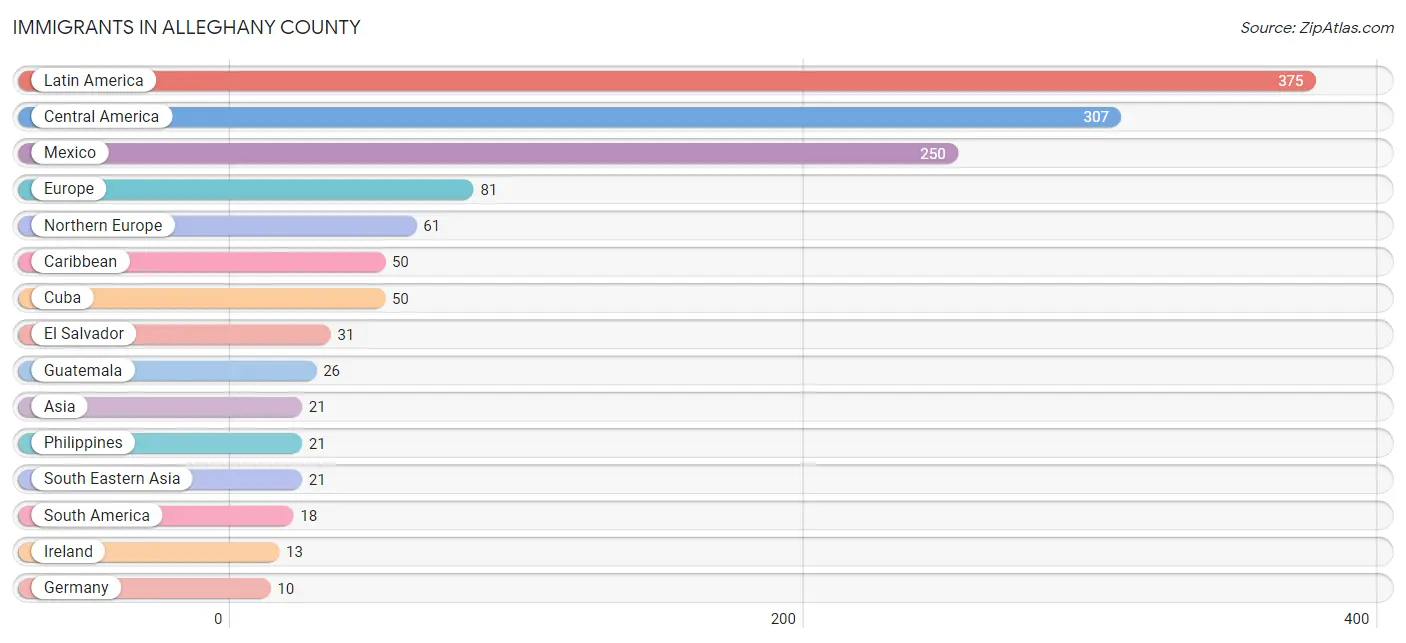
The most numerous immigrant groups reported in Alleghany County came from Latin America (375 | 3.4%), Central America (307 | 2.8%), Mexico (250 | 2.3%), Europe (81 | 0.7%), and Northern Europe (61 | 0.6%), together accounting for 9.8% of all Alleghany County residents.
| Immigration Origin | # Population | % Population |
| Asia | 21 | 0.2% |
| Bolivia | 5 | 0.1% |
| Canada | 7 | 0.1% |
| Caribbean | 50 | 0.5% |
| Central America | 307 | 2.8% |
| Cuba | 50 | 0.5% |
| Ecuador | 2 | 0.0% |
| El Salvador | 31 | 0.3% |
| England | 3 | 0.0% |
| Europe | 81 | 0.7% |
| Germany | 10 | 0.1% |
| Guatemala | 26 | 0.2% |
| Ireland | 13 | 0.1% |
| Latin America | 375 | 3.4% |
| Mexico | 250 | 2.3% |
| Northern Europe | 61 | 0.6% |
| Philippines | 21 | 0.2% |
| South America | 18 | 0.2% |
| South Eastern Asia | 21 | 0.2% |
| Southern Europe | 10 | 0.1% |
| Spain | 10 | 0.1% |
| Western Europe | 10 | 0.1% | View All 22 Rows |
Sex and Age in Alleghany County
Sex and Age in Alleghany County
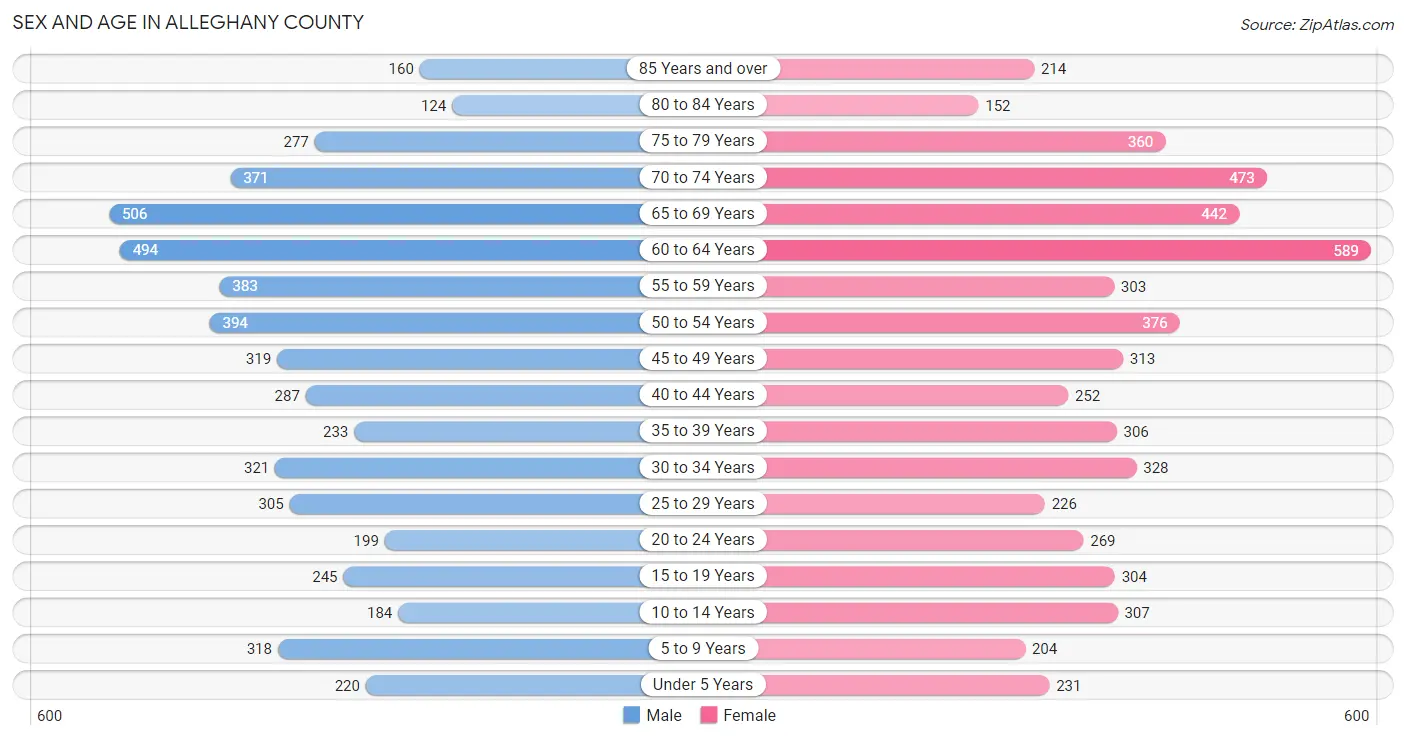
The most populous age groups in Alleghany County are 65 to 69 Years (506 | 9.5%) for men and 60 to 64 Years (589 | 10.4%) for women.
| Age Bracket | Male | Female |
| Under 5 Years | 220 (4.1%) | 231 (4.1%) |
| 5 to 9 Years | 318 (6.0%) | 204 (3.6%) |
| 10 to 14 Years | 184 (3.5%) | 307 (5.4%) |
| 15 to 19 Years | 245 (4.6%) | 304 (5.4%) |
| 20 to 24 Years | 199 (3.7%) | 269 (4.8%) |
| 25 to 29 Years | 305 (5.7%) | 226 (4.0%) |
| 30 to 34 Years | 321 (6.0%) | 328 (5.8%) |
| 35 to 39 Years | 233 (4.4%) | 306 (5.4%) |
| 40 to 44 Years | 287 (5.4%) | 252 (4.5%) |
| 45 to 49 Years | 319 (6.0%) | 313 (5.5%) |
| 50 to 54 Years | 394 (7.4%) | 376 (6.7%) |
| 55 to 59 Years | 383 (7.2%) | 303 (5.4%) |
| 60 to 64 Years | 494 (9.2%) | 589 (10.4%) |
| 65 to 69 Years | 506 (9.5%) | 442 (7.8%) |
| 70 to 74 Years | 371 (7.0%) | 473 (8.4%) |
| 75 to 79 Years | 277 (5.2%) | 360 (6.4%) |
| 80 to 84 Years | 124 (2.3%) | 152 (2.7%) |
| 85 Years and over | 160 (3.0%) | 214 (3.8%) |
| Total | 5,340 (100.0%) | 5,649 (100.0%) |
Families and Households in Alleghany County
Median Family Size in Alleghany County
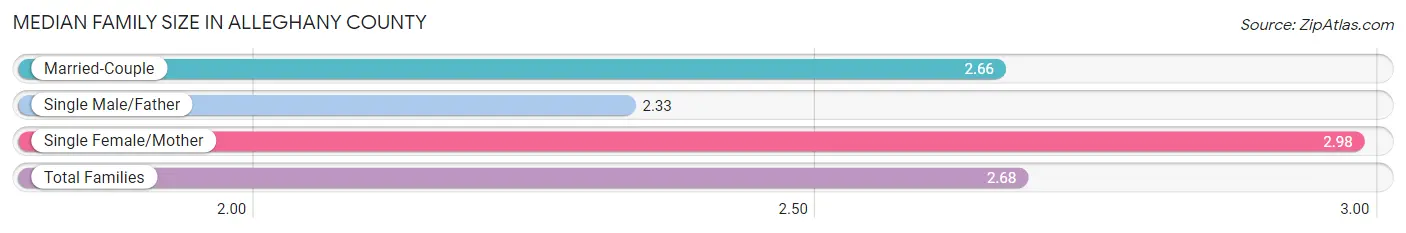
The median family size in Alleghany County is 2.68 persons per family, with single female/mother families (342 | 10.7%) accounting for the largest median family size of 2.98 persons per family. On the other hand, single male/father families (151 | 4.7%) represent the smallest median family size with 2.33 persons per family.
| Family Type | # Families | Family Size |
| Married-Couple | 2,711 (84.6%) | 2.66 |
| Single Male/Father | 151 (4.7%) | 2.33 |
| Single Female/Mother | 342 (10.7%) | 2.98 |
| Total Families | 3,204 (100.0%) | 2.68 |
Median Household Size in Alleghany County
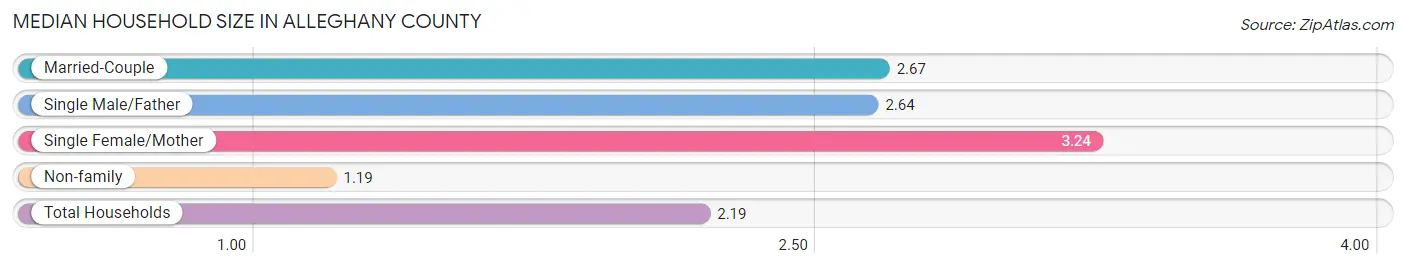
The median household size in Alleghany County is 2.19 persons per household, with single female/mother households (342 | 6.9%) accounting for the largest median household size of 3.24 persons per household. non-family households (1,733 | 35.1%) represent the smallest median household size with 1.19 persons per household.
| Household Type | # Households | Household Size |
| Married-Couple | 2,711 (54.9%) | 2.67 |
| Single Male/Father | 151 (3.1%) | 2.64 |
| Single Female/Mother | 342 (6.9%) | 3.24 |
| Non-family | 1,733 (35.1%) | 1.19 |
| Total Households | 4,937 (100.0%) | 2.19 |
Household Size by Marriage Status in Alleghany County
Out of a total of 4,937 households in Alleghany County, 3,204 (64.9%) are family households, while 1,733 (35.1%) are nonfamily households. The most numerous type of family households are 2-person households, comprising 1,968, and the most common type of nonfamily households are 1-person households, comprising 1,461.
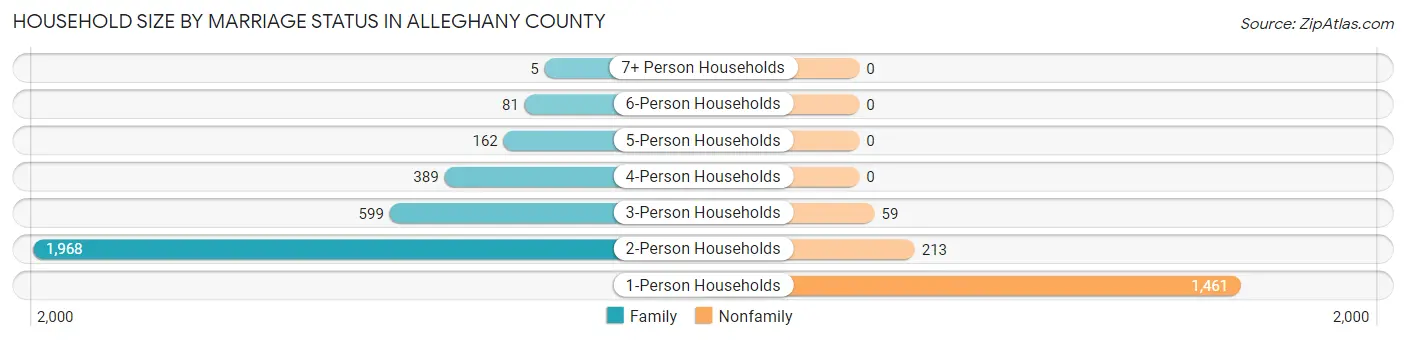
| Household Size | Family Households | Nonfamily Households |
| 1-Person Households | - | 1,461 (29.6%) |
| 2-Person Households | 1,968 (39.9%) | 213 (4.3%) |
| 3-Person Households | 599 (12.1%) | 59 (1.2%) |
| 4-Person Households | 389 (7.9%) | 0 (0.0%) |
| 5-Person Households | 162 (3.3%) | 0 (0.0%) |
| 6-Person Households | 81 (1.6%) | 0 (0.0%) |
| 7+ Person Households | 5 (0.1%) | 0 (0.0%) |
| Total | 3,204 (64.9%) | 1,733 (35.1%) |
Female Fertility in Alleghany County
Fertility by Age in Alleghany County
Average fertility rate in Alleghany County is 78.0 births per 1,000 women. Women in the age bracket of 20 to 34 years have the highest fertility rate with 156.0 births per 1,000 women. Women in the age bracket of 20 to 34 years acount for 79.5% of all women with births.
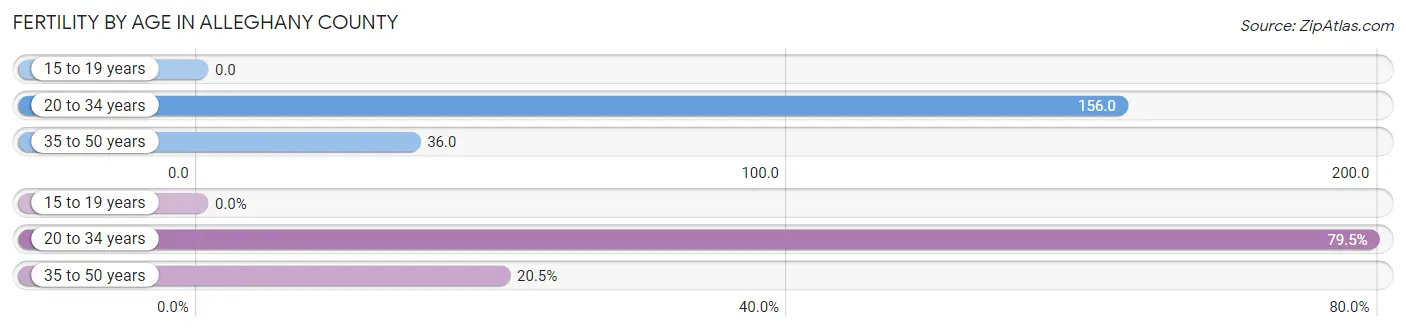
| Age Bracket | Women with Births | Births / 1,000 Women |
| 15 to 19 years | 0 (0.0%) | 0.0 |
| 20 to 34 years | 128 (79.5%) | 156.0 |
| 35 to 50 years | 33 (20.5%) | 36.0 |
| Total | 161 (100.0%) | 78.0 |
Fertility by Age by Marriage Status in Alleghany County
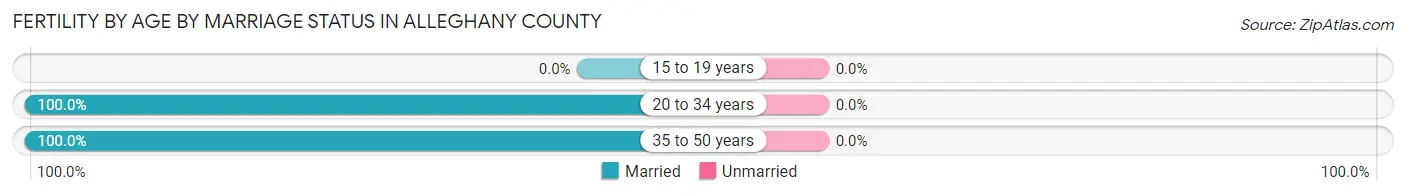
| Age Bracket | Married | Unmarried |
| 15 to 19 years | 0 (0.0%) | 0 (0.0%) |
| 20 to 34 years | 128 (100.0%) | 0 (0.0%) |
| 35 to 50 years | 33 (100.0%) | 0 (0.0%) |
| Total | 161 (100.0%) | 0 (0.0%) |
Fertility by Education in Alleghany County
Average fertility rate in Alleghany County is 78.0 births per 1,000 women. Women with the education attainment of bachelor's degree have the highest fertility rate of 173.0 births per 1,000 women, while women with the education attainment of high school diploma have the lowest fertility at 20.0 births per 1,000 women. Women with the education attainment of college or associate's degree represent 39.8% of all women with births.
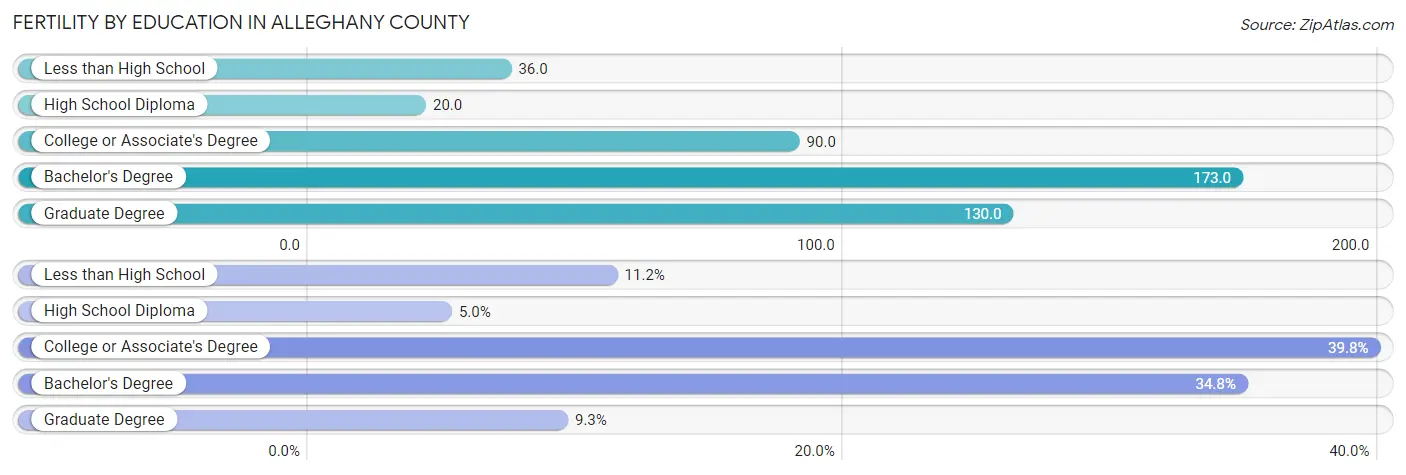
| Educational Attainment | Women with Births | Births / 1,000 Women |
| Less than High School | 18 (11.2%) | 36.0 |
| High School Diploma | 8 (5.0%) | 20.0 |
| College or Associate's Degree | 64 (39.8%) | 90.0 |
| Bachelor's Degree | 56 (34.8%) | 173.0 |
| Graduate Degree | 15 (9.3%) | 130.0 |
| Total | 161 (100.0%) | 78.0 |
Fertility by Education by Marriage Status in Alleghany County
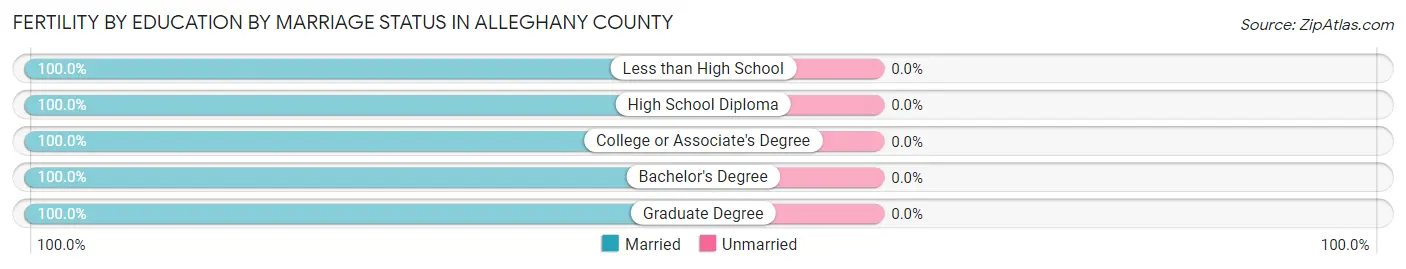
| Educational Attainment | Married | Unmarried |
| Less than High School | 18 (100.0%) | 0 (0.0%) |
| High School Diploma | 8 (100.0%) | 0 (0.0%) |
| College or Associate's Degree | 64 (100.0%) | 0 (0.0%) |
| Bachelor's Degree | 56 (100.0%) | 0 (0.0%) |
| Graduate Degree | 15 (100.0%) | 0 (0.0%) |
| Total | 161 (100.0%) | 0 (0.0%) |
Employment Characteristics in Alleghany County
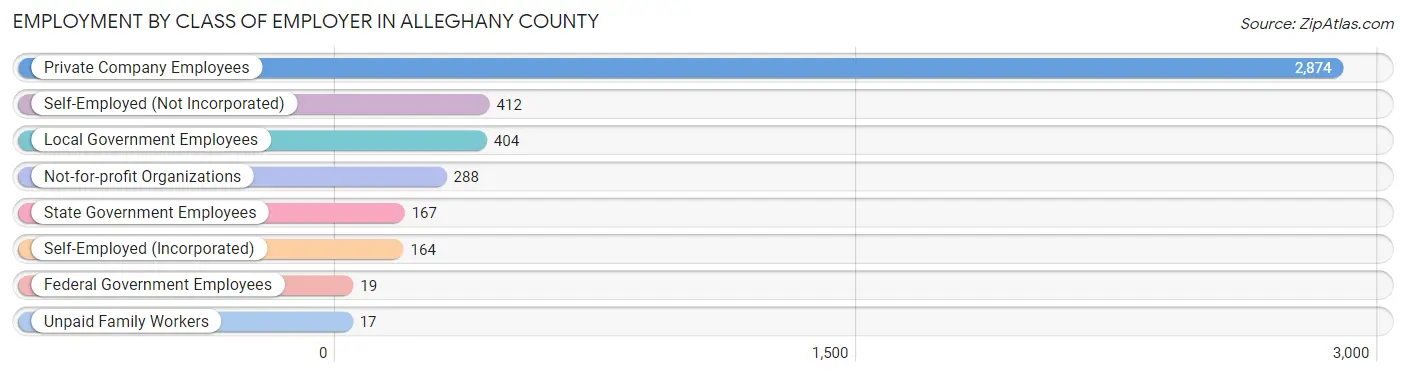
Employment by Class of Employer in Alleghany County
Among the 4,345 employed individuals in Alleghany County, private company employees (2,874 | 66.1%), self-employed (not incorporated) (412 | 9.5%), and local government employees (404 | 9.3%) make up the most common classes of employment.
| Employer Class | # Employees | % Employees |
| Private Company Employees | 2,874 | 66.1% |
| Self-Employed (Incorporated) | 164 | 3.8% |
| Self-Employed (Not Incorporated) | 412 | 9.5% |
| Not-for-profit Organizations | 288 | 6.6% |
| Local Government Employees | 404 | 9.3% |
| State Government Employees | 167 | 3.8% |
| Federal Government Employees | 19 | 0.4% |
| Unpaid Family Workers | 17 | 0.4% |
| Total | 4,345 | 100.0% |
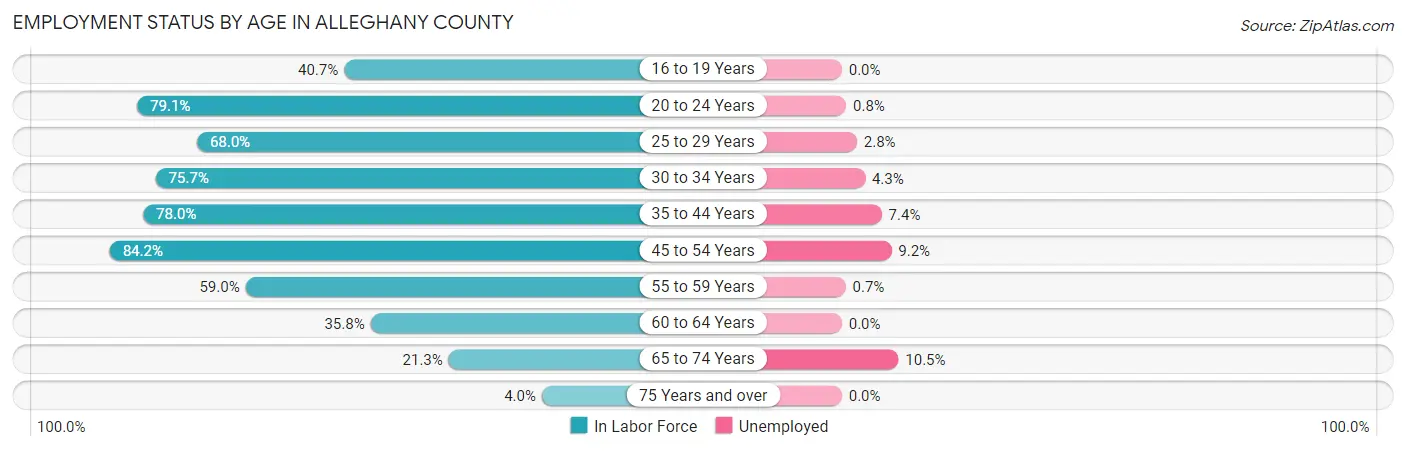
Employment Status by Age in Alleghany County
According to the labor force statistics for Alleghany County, out of the total population over 16 years of age (9,404), 49.4% or 4,646 individuals are in the labor force, with 5.3% or 246 of them unemployed. The age group with the highest labor force participation rate is 45 to 54 years, with 84.2% or 1,180 individuals in the labor force. Within the labor force, the 65 to 74 years age range has the highest percentage of unemployed individuals, with 10.5% or 40 of them being unemployed.
| Age Bracket | In Labor Force | Unemployed |
| 16 to 19 Years | 174 (40.7%) | 0 (0.0%) |
| 20 to 24 Years | 370 (79.1%) | 3 (0.8%) |
| 25 to 29 Years | 361 (68.0%) | 10 (2.8%) |
| 30 to 34 Years | 491 (75.7%) | 21 (4.3%) |
| 35 to 44 Years | 841 (78.0%) | 62 (7.4%) |
| 45 to 54 Years | 1,180 (84.2%) | 109 (9.2%) |
| 55 to 59 Years | 405 (59.0%) | 3 (0.7%) |
| 60 to 64 Years | 388 (35.8%) | 0 (0.0%) |
| 65 to 74 Years | 382 (21.3%) | 40 (10.5%) |
| 75 Years and over | 51 (4.0%) | 0 (0.0%) |
| Total | 4,646 (49.4%) | 246 (5.3%) |
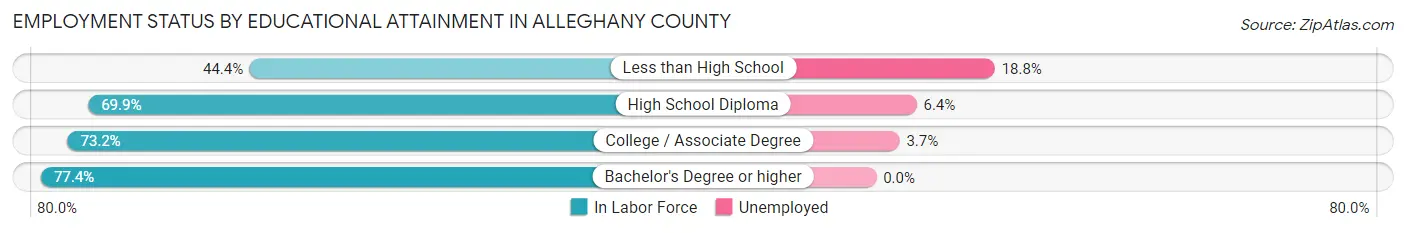
Employment Status by Educational Attainment in Alleghany County
According to labor force statistics for Alleghany County, 67.5% of individuals (3,665) out of the total population between 25 and 64 years of age (5,429) are in the labor force, with 5.6% or 205 of them being unemployed. The group with the highest labor force participation rate are those with the educational attainment of bachelor's degree or higher, with 77.4% or 823 individuals in the labor force. Within the labor force, individuals with less than high school education have the highest percentage of unemployment, with 18.8% or 88 of them being unemployed.
| Educational Attainment | In Labor Force | Unemployed |
| Less than High School | 468 (44.4%) | 198 (18.8%) |
| High School Diploma | 1,055 (69.9%) | 97 (6.4%) |
| College / Associate Degree | 1,320 (73.2%) | 67 (3.7%) |
| Bachelor's Degree or higher | 823 (77.4%) | 0 (0.0%) |
| Total | 3,665 (67.5%) | 304 (5.6%) |
Employment Occupations by Sex in Alleghany County
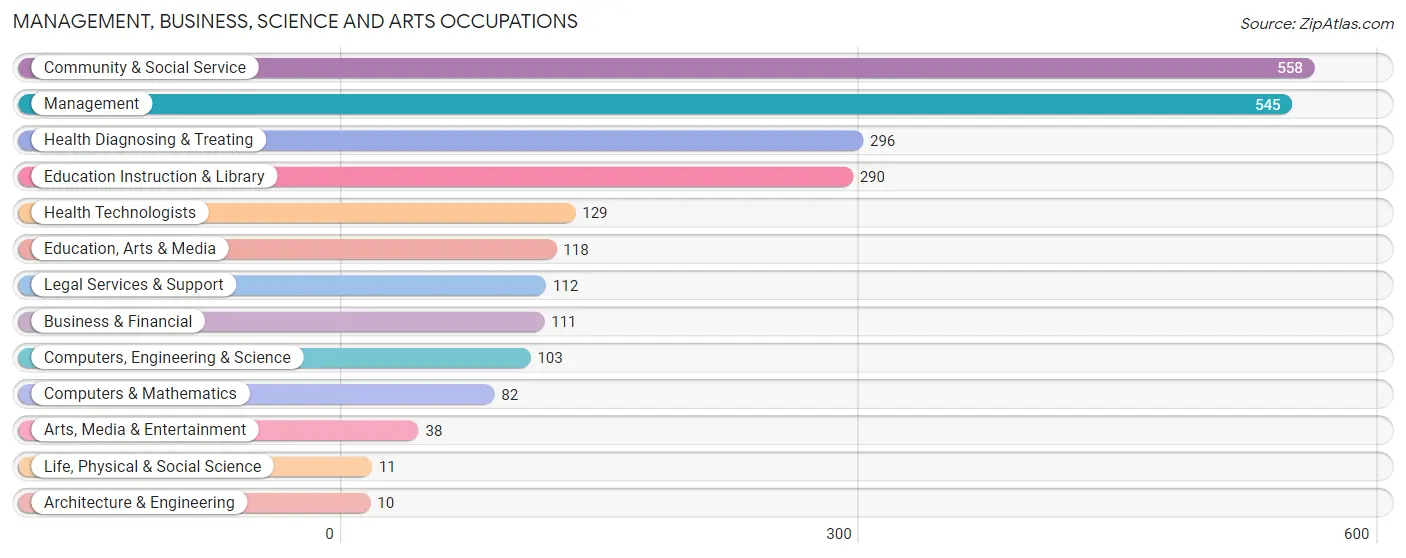
Management, Business, Science and Arts Occupations
The most common Management, Business, Science and Arts occupations in Alleghany County are Community & Social Service (558 | 12.7%), Management (545 | 12.4%), Health Diagnosing & Treating (296 | 6.7%), Education Instruction & Library (290 | 6.6%), and Health Technologists (129 | 2.9%).
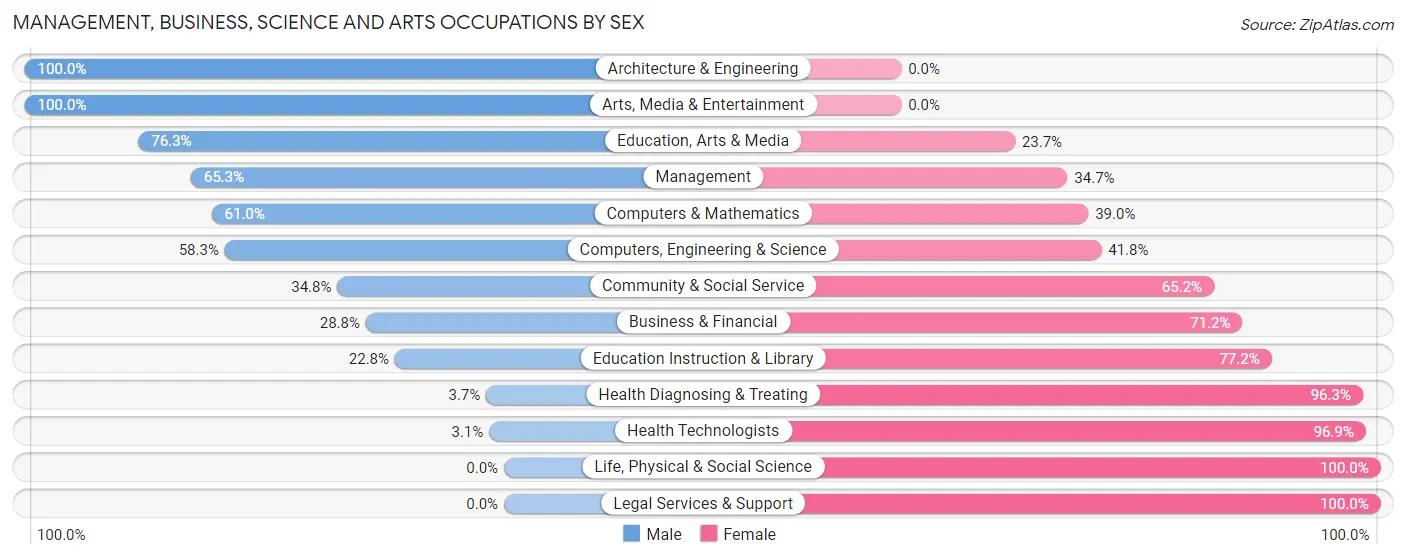
Management, Business, Science and Arts Occupations by Sex
Within the Management, Business, Science and Arts occupations in Alleghany County, the most male-oriented occupations are Architecture & Engineering (100.0%), Arts, Media & Entertainment (100.0%), and Education, Arts & Media (76.3%), while the most female-oriented occupations are Life, Physical & Social Science (100.0%), Legal Services & Support (100.0%), and Health Technologists (96.9%).
| Occupation | Male | Female |
| Management | 356 (65.3%) | 189 (34.7%) |
| Business & Financial | 32 (28.8%) | 79 (71.2%) |
| Computers, Engineering & Science | 60 (58.3%) | 43 (41.7%) |
| Computers & Mathematics | 50 (61.0%) | 32 (39.0%) |
| Architecture & Engineering | 10 (100.0%) | 0 (0.0%) |
| Life, Physical & Social Science | 0 (0.0%) | 11 (100.0%) |
| Community & Social Service | 194 (34.8%) | 364 (65.2%) |
| Education, Arts & Media | 90 (76.3%) | 28 (23.7%) |
| Legal Services & Support | 0 (0.0%) | 112 (100.0%) |
| Education Instruction & Library | 66 (22.8%) | 224 (77.2%) |
| Arts, Media & Entertainment | 38 (100.0%) | 0 (0.0%) |
| Health Diagnosing & Treating | 11 (3.7%) | 285 (96.3%) |
| Health Technologists | 4 (3.1%) | 125 (96.9%) |
| Total (Category) | 653 (40.5%) | 960 (59.5%) |
| Total (Overall) | 2,292 (52.1%) | 2,104 (47.9%) |
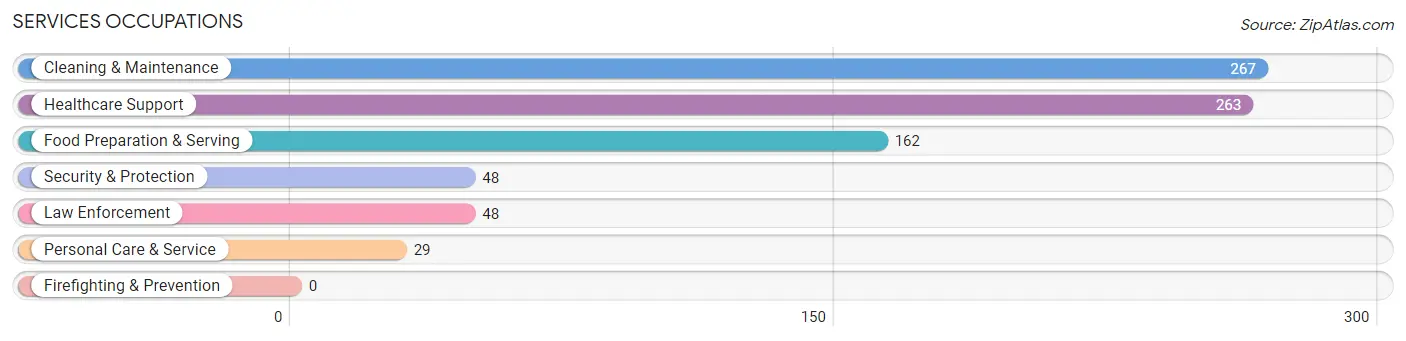
Services Occupations
The most common Services occupations in Alleghany County are Cleaning & Maintenance (267 | 6.1%), Healthcare Support (263 | 6.0%), Food Preparation & Serving (162 | 3.7%), Security & Protection (48 | 1.1%), and Law Enforcement (48 | 1.1%).
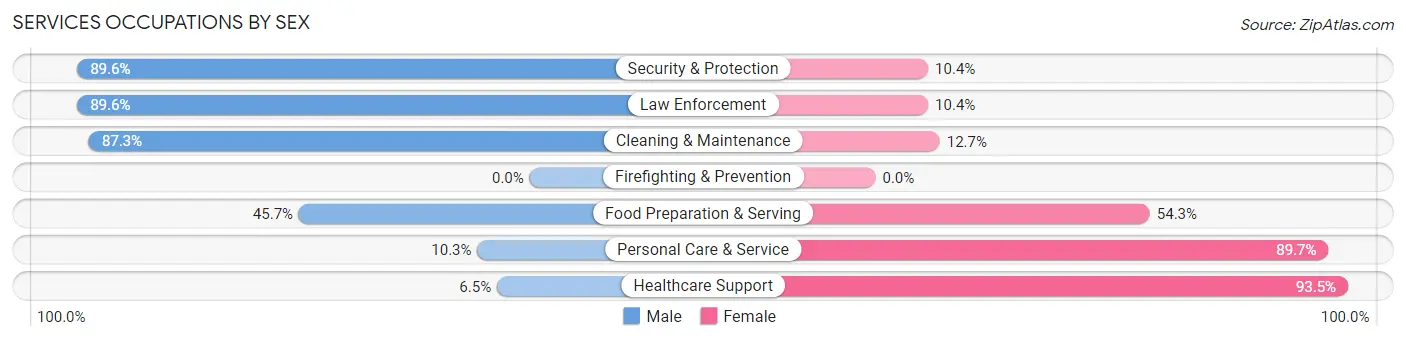
Services Occupations by Sex
Within the Services occupations in Alleghany County, the most male-oriented occupations are Security & Protection (89.6%), Law Enforcement (89.6%), and Cleaning & Maintenance (87.3%), while the most female-oriented occupations are Healthcare Support (93.5%), Personal Care & Service (89.7%), and Food Preparation & Serving (54.3%).
| Occupation | Male | Female |
| Healthcare Support | 17 (6.5%) | 246 (93.5%) |
| Security & Protection | 43 (89.6%) | 5 (10.4%) |
| Firefighting & Prevention | 0 (0.0%) | 0 (0.0%) |
| Law Enforcement | 43 (89.6%) | 5 (10.4%) |
| Food Preparation & Serving | 74 (45.7%) | 88 (54.3%) |
| Cleaning & Maintenance | 233 (87.3%) | 34 (12.7%) |
| Personal Care & Service | 3 (10.3%) | 26 (89.7%) |
| Total (Category) | 370 (48.1%) | 399 (51.9%) |
| Total (Overall) | 2,292 (52.1%) | 2,104 (47.9%) |
Sales and Office Occupations
The most common Sales and Office occupations in Alleghany County are Sales & Related (456 | 10.4%), and Office & Administration (366 | 8.3%).

Sales and Office Occupations by Sex

| Occupation | Male | Female |
| Sales & Related | 152 (33.3%) | 304 (66.7%) |
| Office & Administration | 50 (13.7%) | 316 (86.3%) |
| Total (Category) | 202 (24.6%) | 620 (75.4%) |
| Total (Overall) | 2,292 (52.1%) | 2,104 (47.9%) |
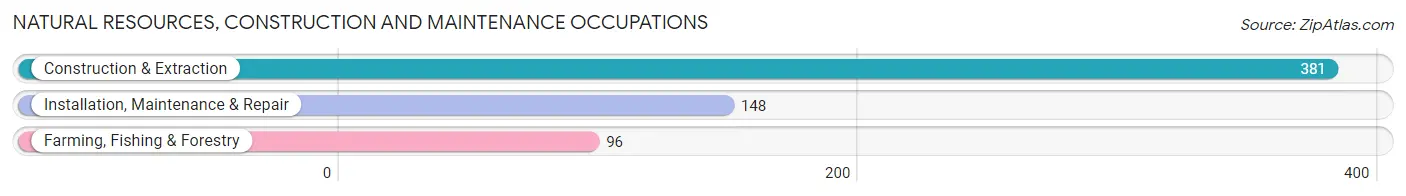
Natural Resources, Construction and Maintenance Occupations
The most common Natural Resources, Construction and Maintenance occupations in Alleghany County are Construction & Extraction (381 | 8.7%), Installation, Maintenance & Repair (148 | 3.4%), and Farming, Fishing & Forestry (96 | 2.2%).
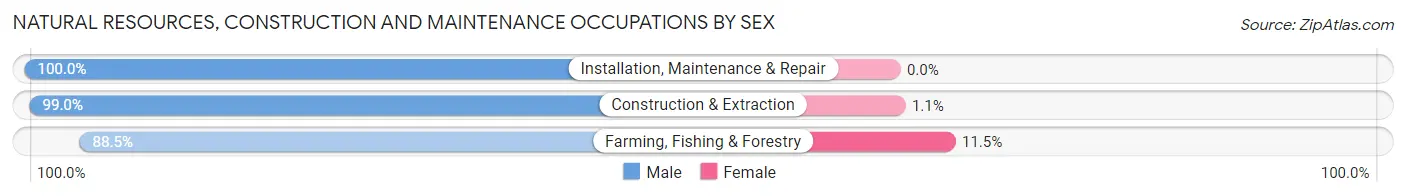
Natural Resources, Construction and Maintenance Occupations by Sex
| Occupation | Male | Female |
| Farming, Fishing & Forestry | 85 (88.5%) | 11 (11.5%) |
| Construction & Extraction | 377 (99.0%) | 4 (1.1%) |
| Installation, Maintenance & Repair | 148 (100.0%) | 0 (0.0%) |
| Total (Category) | 610 (97.6%) | 15 (2.4%) |
| Total (Overall) | 2,292 (52.1%) | 2,104 (47.9%) |
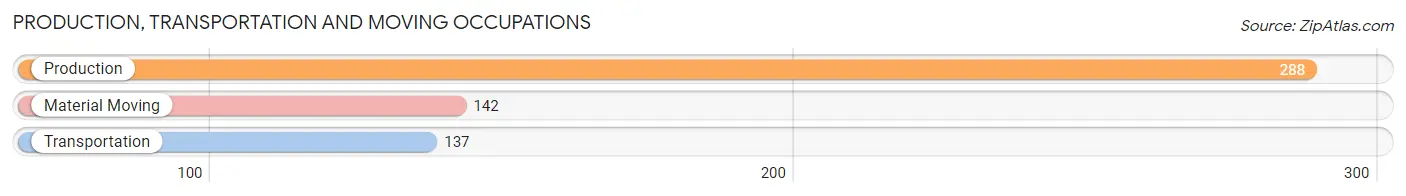
Production, Transportation and Moving Occupations
The most common Production, Transportation and Moving occupations in Alleghany County are Production (288 | 6.6%), Material Moving (142 | 3.2%), and Transportation (137 | 3.1%).
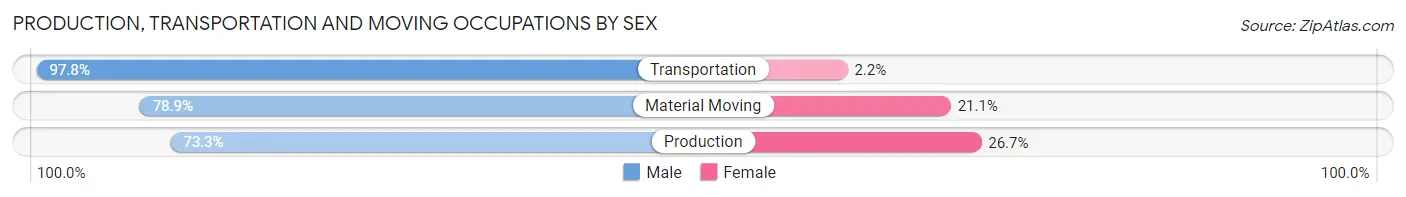
Production, Transportation and Moving Occupations by Sex
| Occupation | Male | Female |
| Production | 211 (73.3%) | 77 (26.7%) |
| Transportation | 134 (97.8%) | 3 (2.2%) |
| Material Moving | 112 (78.9%) | 30 (21.1%) |
| Total (Category) | 457 (80.6%) | 110 (19.4%) |
| Total (Overall) | 2,292 (52.1%) | 2,104 (47.9%) |
Employment Industries by Sex in Alleghany County
Employment Industries in Alleghany County
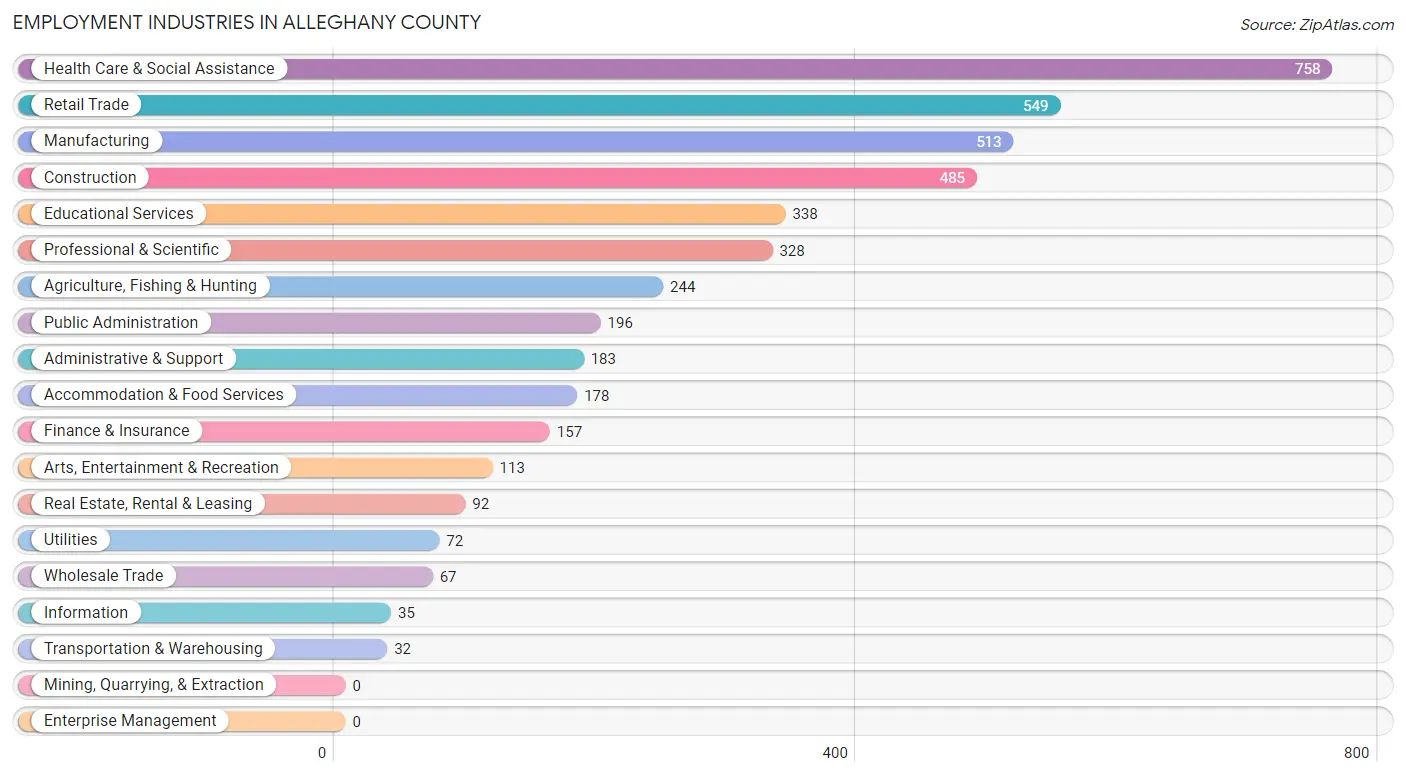
The major employment industries in Alleghany County include Health Care & Social Assistance (758 | 17.2%), Retail Trade (549 | 12.5%), Manufacturing (513 | 11.7%), Construction (485 | 11.0%), and Educational Services (338 | 7.7%).
Employment Industries by Sex in Alleghany County
The Alleghany County industries that see more men than women are Utilities (100.0%), Construction (99.2%), and Administrative & Support (79.8%), whereas the industries that tend to have a higher number of women are Information (100.0%), Health Care & Social Assistance (91.8%), and Educational Services (77.5%).
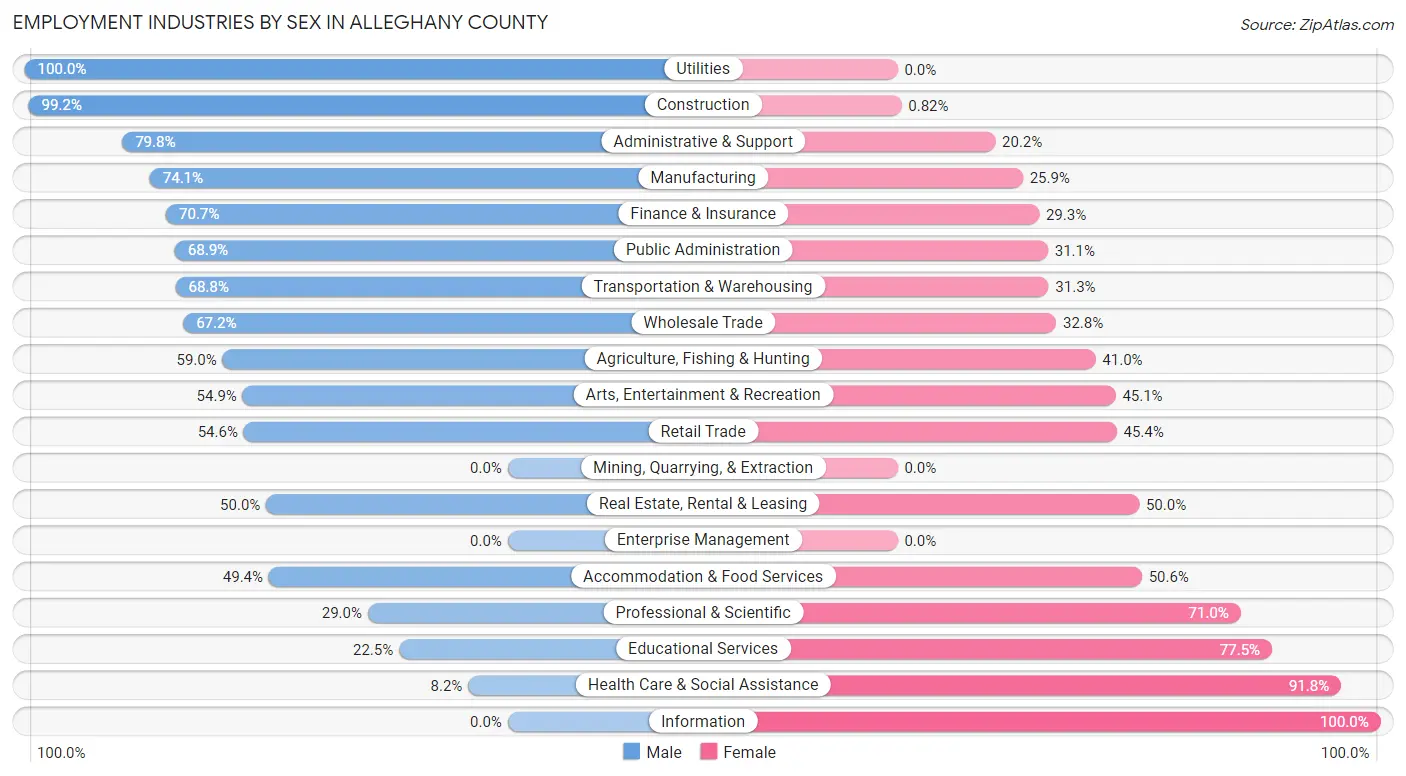
| Industry | Male | Female |
| Agriculture, Fishing & Hunting | 144 (59.0%) | 100 (41.0%) |
| Mining, Quarrying, & Extraction | 0 (0.0%) | 0 (0.0%) |
| Construction | 481 (99.2%) | 4 (0.8%) |
| Manufacturing | 380 (74.1%) | 133 (25.9%) |
| Wholesale Trade | 45 (67.2%) | 22 (32.8%) |
| Retail Trade | 300 (54.6%) | 249 (45.4%) |
| Transportation & Warehousing | 22 (68.8%) | 10 (31.2%) |
| Utilities | 72 (100.0%) | 0 (0.0%) |
| Information | 0 (0.0%) | 35 (100.0%) |
| Finance & Insurance | 111 (70.7%) | 46 (29.3%) |
| Real Estate, Rental & Leasing | 46 (50.0%) | 46 (50.0%) |
| Professional & Scientific | 95 (29.0%) | 233 (71.0%) |
| Enterprise Management | 0 (0.0%) | 0 (0.0%) |
| Administrative & Support | 146 (79.8%) | 37 (20.2%) |
| Educational Services | 76 (22.5%) | 262 (77.5%) |
| Health Care & Social Assistance | 62 (8.2%) | 696 (91.8%) |
| Arts, Entertainment & Recreation | 62 (54.9%) | 51 (45.1%) |
| Accommodation & Food Services | 88 (49.4%) | 90 (50.6%) |
| Public Administration | 135 (68.9%) | 61 (31.1%) |
| Total | 2,292 (52.1%) | 2,104 (47.9%) |
Education in Alleghany County
School Enrollment in Alleghany County
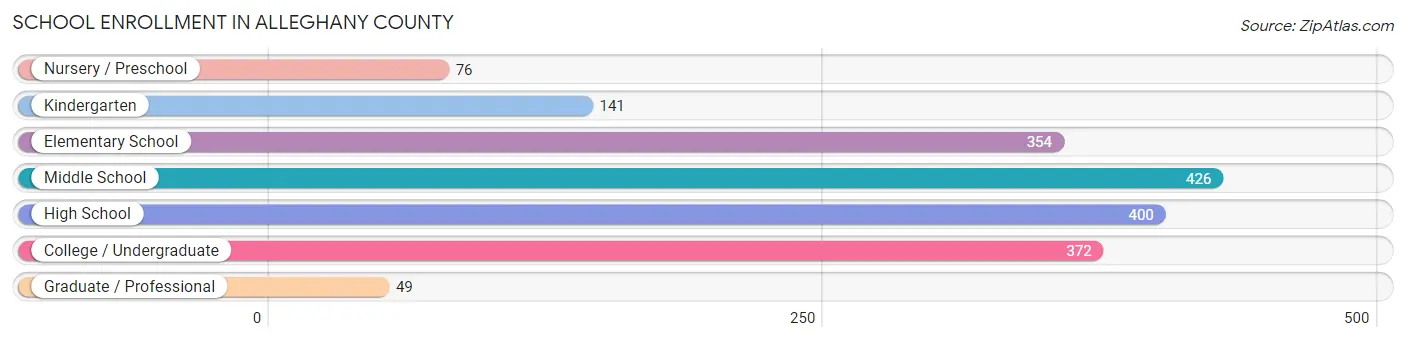
The most common levels of schooling among the 1,818 students in Alleghany County are middle school (426 | 23.4%), high school (400 | 22.0%), and college / undergraduate (372 | 20.5%).
| School Level | # Students | % Students |
| Nursery / Preschool | 76 | 4.2% |
| Kindergarten | 141 | 7.8% |
| Elementary School | 354 | 19.5% |
| Middle School | 426 | 23.4% |
| High School | 400 | 22.0% |
| College / Undergraduate | 372 | 20.5% |
| Graduate / Professional | 49 | 2.7% |
| Total | 1,818 | 100.0% |
School Enrollment by Age by Funding Source in Alleghany County
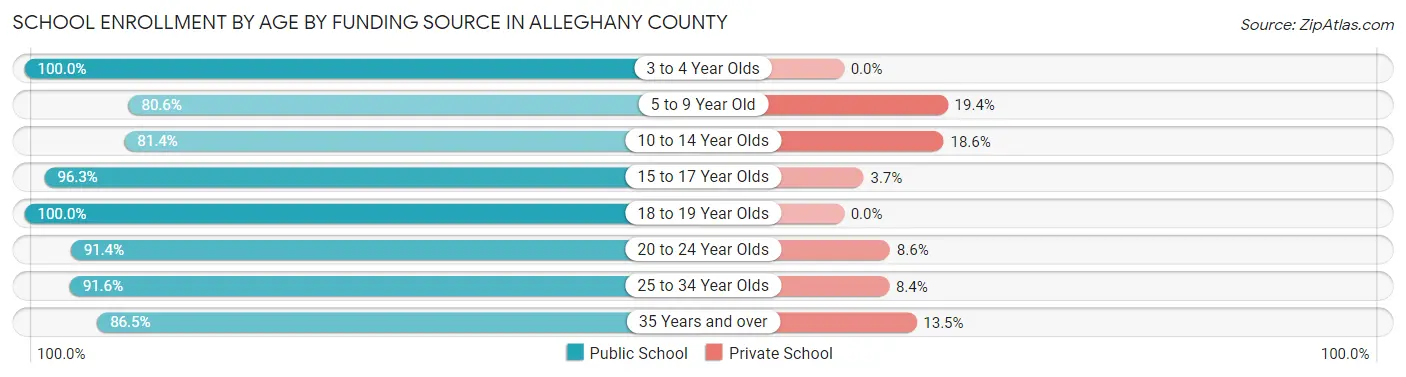
Out of a total of 1,818 students who are enrolled in schools in Alleghany County, 233 (12.8%) attend a private institution, while the remaining 1,585 (87.2%) are enrolled in public schools. The age group of 5 to 9 year old has the highest likelihood of being enrolled in private schools, with 99 (19.4% in the age bracket) enrolled. Conversely, the age group of 3 to 4 year olds has the lowest likelihood of being enrolled in a private school, with 51 (100.0% in the age bracket) attending a public institution.
| Age Bracket | Public School | Private School |
| 3 to 4 Year Olds | 51 (100.0%) | 0 (0.0%) |
| 5 to 9 Year Old | 412 (80.6%) | 99 (19.4%) |
| 10 to 14 Year Olds | 385 (81.4%) | 88 (18.6%) |
| 15 to 17 Year Olds | 312 (96.3%) | 12 (3.7%) |
| 18 to 19 Year Olds | 129 (100.0%) | 0 (0.0%) |
| 20 to 24 Year Olds | 138 (91.4%) | 13 (8.6%) |
| 25 to 34 Year Olds | 76 (91.6%) | 7 (8.4%) |
| 35 Years and over | 83 (86.5%) | 13 (13.5%) |
| Total | 1,585 (87.2%) | 233 (12.8%) |
Educational Attainment by Field of Study in Alleghany County
Business (367 | 19.7%), education (271 | 14.5%), social sciences (226 | 12.1%), science & technology (198 | 10.6%), and arts & humanities (152 | 8.2%) are the most common fields of study among 1,862 individuals in Alleghany County who have obtained a bachelor's degree or higher.
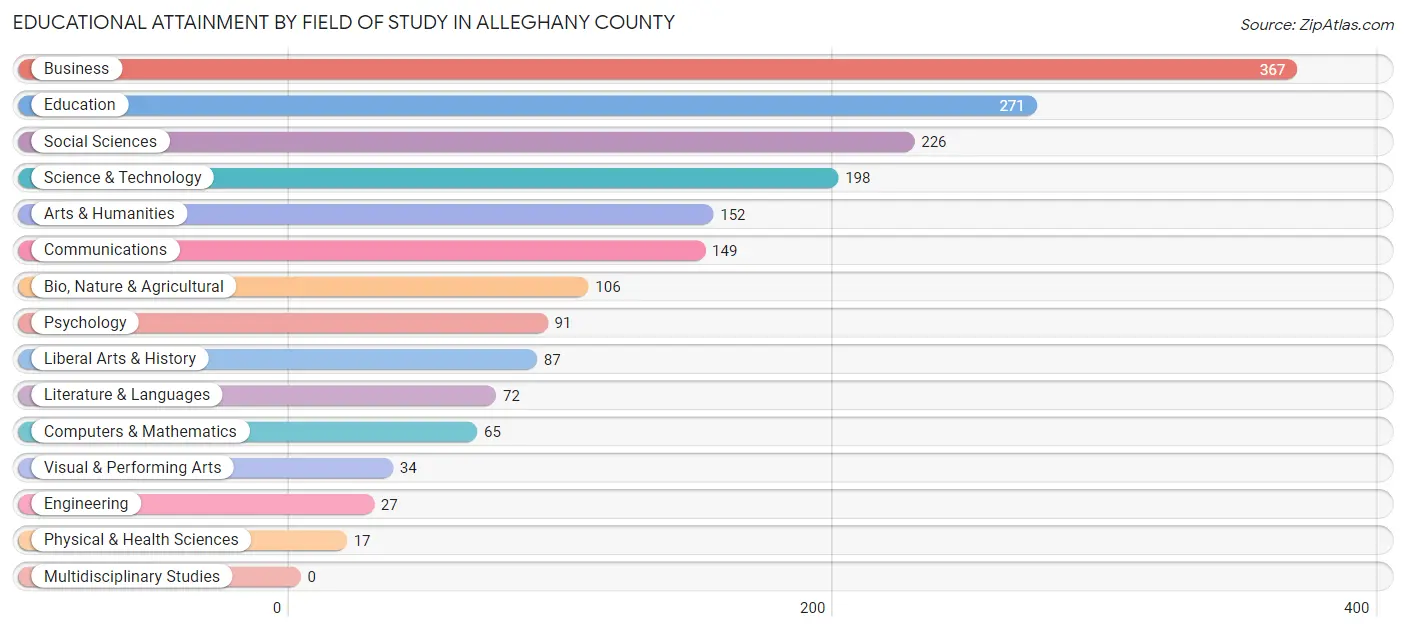
| Field of Study | # Graduates | % Graduates |
| Computers & Mathematics | 65 | 3.5% |
| Bio, Nature & Agricultural | 106 | 5.7% |
| Physical & Health Sciences | 17 | 0.9% |
| Psychology | 91 | 4.9% |
| Social Sciences | 226 | 12.1% |
| Engineering | 27 | 1.5% |
| Multidisciplinary Studies | 0 | 0.0% |
| Science & Technology | 198 | 10.6% |
| Business | 367 | 19.7% |
| Education | 271 | 14.5% |
| Literature & Languages | 72 | 3.9% |
| Liberal Arts & History | 87 | 4.7% |
| Visual & Performing Arts | 34 | 1.8% |
| Communications | 149 | 8.0% |
| Arts & Humanities | 152 | 8.2% |
| Total | 1,862 | 100.0% |
Transportation & Commute in Alleghany County
Vehicle Availability by Sex in Alleghany County
The most prevalent vehicle ownership categories in Alleghany County are males with 2 vehicles (823, accounting for 36.6%) and females with 2 vehicles (673, making up 39.8%).
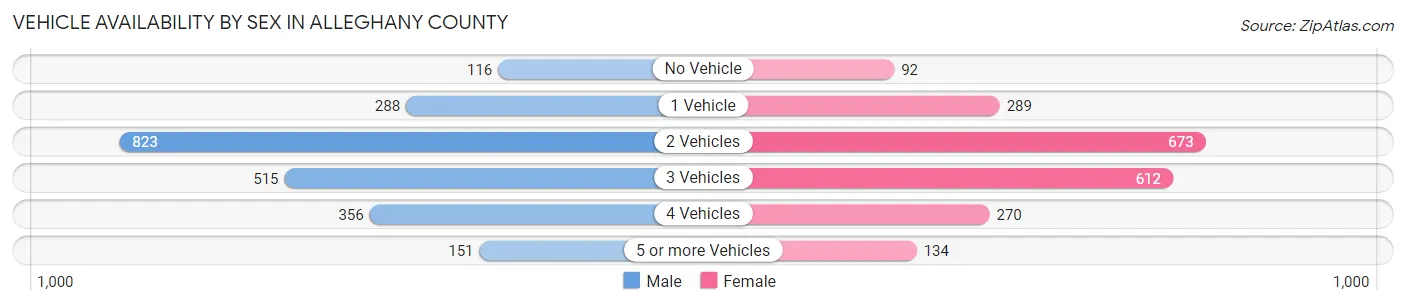
| Vehicles Available | Male | Female |
| No Vehicle | 116 (5.2%) | 92 (4.4%) |
| 1 Vehicle | 288 (12.8%) | 289 (14.0%) |
| 2 Vehicles | 823 (36.6%) | 673 (32.5%) |
| 3 Vehicles | 515 (22.9%) | 612 (29.6%) |
| 4 Vehicles | 356 (15.8%) | 270 (13.0%) |
| 5 or more Vehicles | 151 (6.7%) | 134 (6.5%) |
| Total | 2,249 (100.0%) | 2,070 (100.0%) |
Commute Time in Alleghany County
The most frequently occuring commute durations in Alleghany County are 15 to 19 minutes (924 commuters, 23.1%), 5 to 9 minutes (561 commuters, 14.1%), and 20 to 24 minutes (466 commuters, 11.7%).
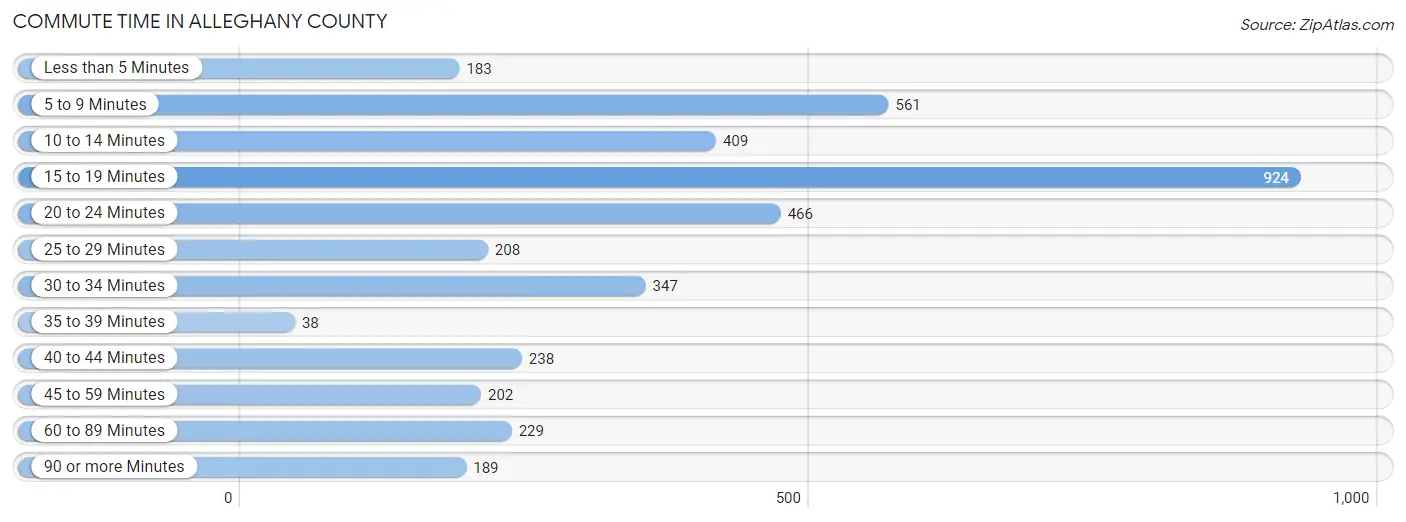
| Commute Time | # Commuters | % Commuters |
| Less than 5 Minutes | 183 | 4.6% |
| 5 to 9 Minutes | 561 | 14.1% |
| 10 to 14 Minutes | 409 | 10.2% |
| 15 to 19 Minutes | 924 | 23.1% |
| 20 to 24 Minutes | 466 | 11.7% |
| 25 to 29 Minutes | 208 | 5.2% |
| 30 to 34 Minutes | 347 | 8.7% |
| 35 to 39 Minutes | 38 | 0.9% |
| 40 to 44 Minutes | 238 | 6.0% |
| 45 to 59 Minutes | 202 | 5.1% |
| 60 to 89 Minutes | 229 | 5.7% |
| 90 or more Minutes | 189 | 4.7% |
Commute Time by Sex in Alleghany County
The most common commute times in Alleghany County are 15 to 19 minutes (456 commuters, 21.4%) for males and 15 to 19 minutes (468 commuters, 25.2%) for females.
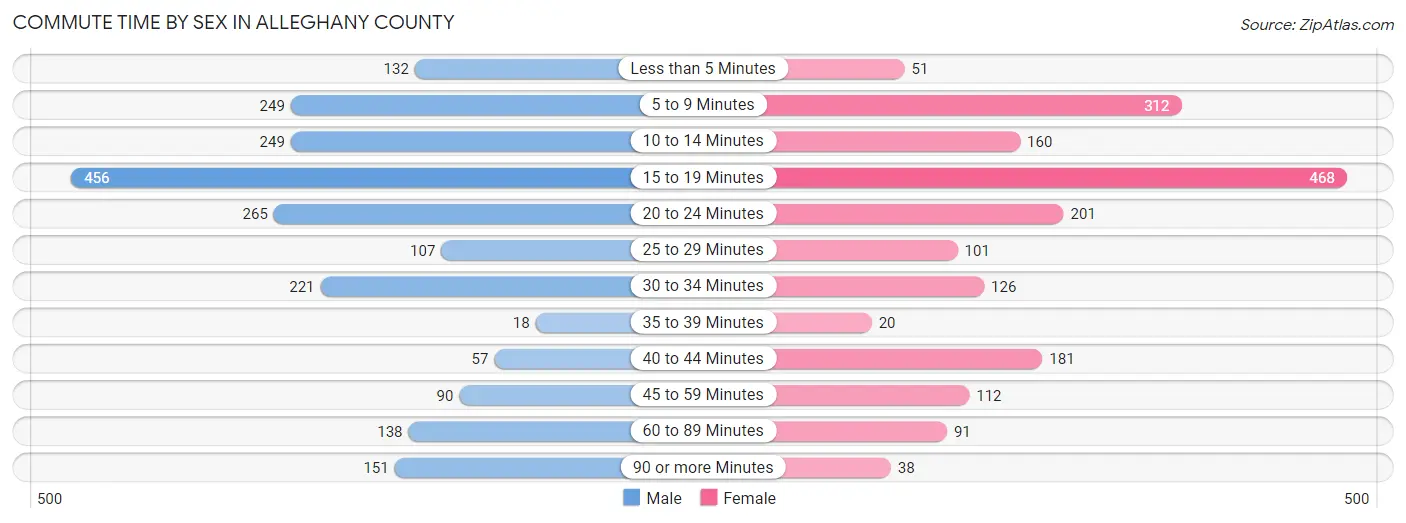
| Commute Time | Male | Female |
| Less than 5 Minutes | 132 (6.2%) | 51 (2.7%) |
| 5 to 9 Minutes | 249 (11.7%) | 312 (16.8%) |
| 10 to 14 Minutes | 249 (11.7%) | 160 (8.6%) |
| 15 to 19 Minutes | 456 (21.4%) | 468 (25.2%) |
| 20 to 24 Minutes | 265 (12.4%) | 201 (10.8%) |
| 25 to 29 Minutes | 107 (5.0%) | 101 (5.4%) |
| 30 to 34 Minutes | 221 (10.4%) | 126 (6.8%) |
| 35 to 39 Minutes | 18 (0.8%) | 20 (1.1%) |
| 40 to 44 Minutes | 57 (2.7%) | 181 (9.7%) |
| 45 to 59 Minutes | 90 (4.2%) | 112 (6.0%) |
| 60 to 89 Minutes | 138 (6.5%) | 91 (4.9%) |
| 90 or more Minutes | 151 (7.1%) | 38 (2.0%) |
Time of Departure to Work by Sex in Alleghany County
The most frequent times of departure to work in Alleghany County are 7:00 AM to 7:29 AM (326, 15.3%) for males and 7:30 AM to 7:59 AM (384, 20.6%) for females.
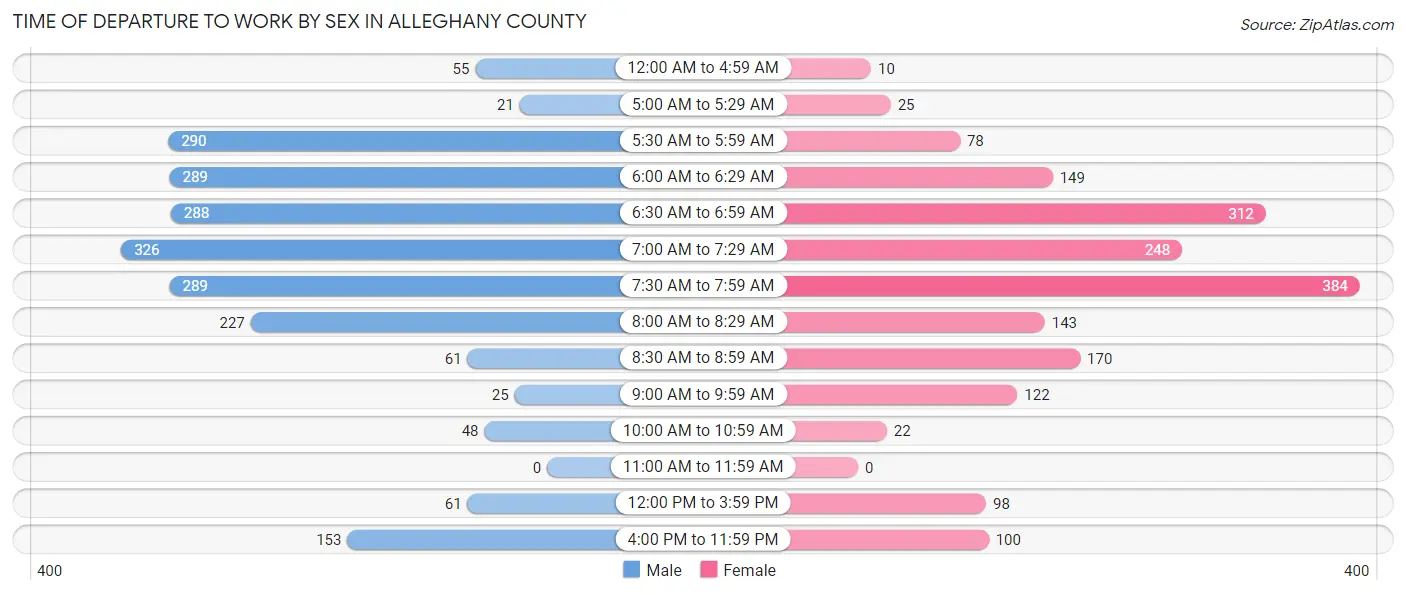
| Time of Departure | Male | Female |
| 12:00 AM to 4:59 AM | 55 (2.6%) | 10 (0.5%) |
| 5:00 AM to 5:29 AM | 21 (1.0%) | 25 (1.3%) |
| 5:30 AM to 5:59 AM | 290 (13.6%) | 78 (4.2%) |
| 6:00 AM to 6:29 AM | 289 (13.6%) | 149 (8.0%) |
| 6:30 AM to 6:59 AM | 288 (13.5%) | 312 (16.8%) |
| 7:00 AM to 7:29 AM | 326 (15.3%) | 248 (13.3%) |
| 7:30 AM to 7:59 AM | 289 (13.6%) | 384 (20.6%) |
| 8:00 AM to 8:29 AM | 227 (10.6%) | 143 (7.7%) |
| 8:30 AM to 8:59 AM | 61 (2.9%) | 170 (9.1%) |
| 9:00 AM to 9:59 AM | 25 (1.2%) | 122 (6.6%) |
| 10:00 AM to 10:59 AM | 48 (2.2%) | 22 (1.2%) |
| 11:00 AM to 11:59 AM | 0 (0.0%) | 0 (0.0%) |
| 12:00 PM to 3:59 PM | 61 (2.9%) | 98 (5.3%) |
| 4:00 PM to 11:59 PM | 153 (7.2%) | 100 (5.4%) |
| Total | 2,133 (100.0%) | 1,861 (100.0%) |
Housing Occupancy in Alleghany County
Occupancy by Ownership in Alleghany County
Of the total 4,937 dwellings in Alleghany County, owner-occupied units account for 3,975 (80.5%), while renter-occupied units make up 962 (19.5%).
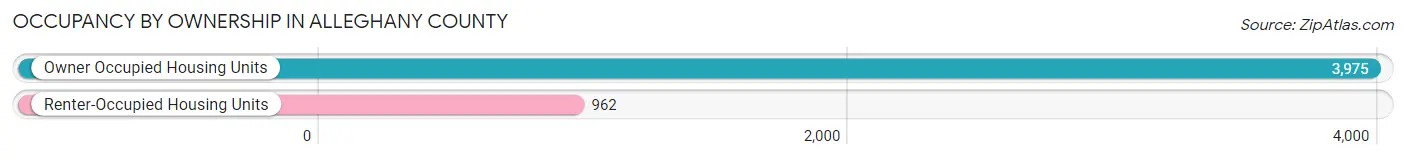
| Occupancy | # Housing Units | % Housing Units |
| Owner Occupied Housing Units | 3,975 | 80.5% |
| Renter-Occupied Housing Units | 962 | 19.5% |
| Total Occupied Housing Units | 4,937 | 100.0% |
Occupancy by Household Size in Alleghany County
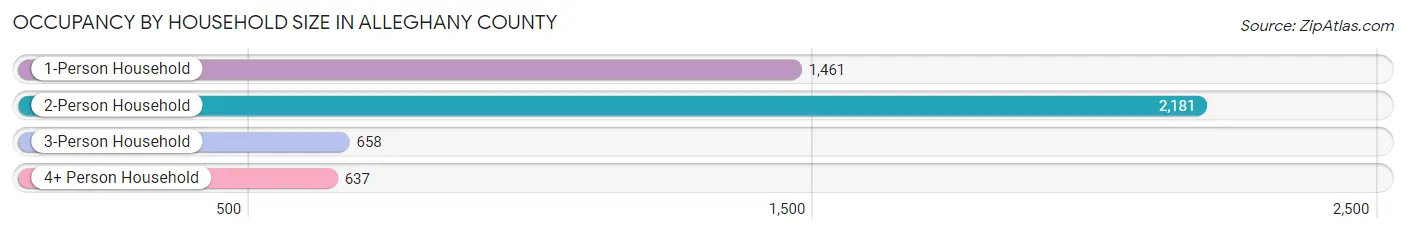
| Household Size | # Housing Units | % Housing Units |
| 1-Person Household | 1,461 | 29.6% |
| 2-Person Household | 2,181 | 44.2% |
| 3-Person Household | 658 | 13.3% |
| 4+ Person Household | 637 | 12.9% |
| Total Housing Units | 4,937 | 100.0% |
Occupancy by Ownership by Household Size in Alleghany County
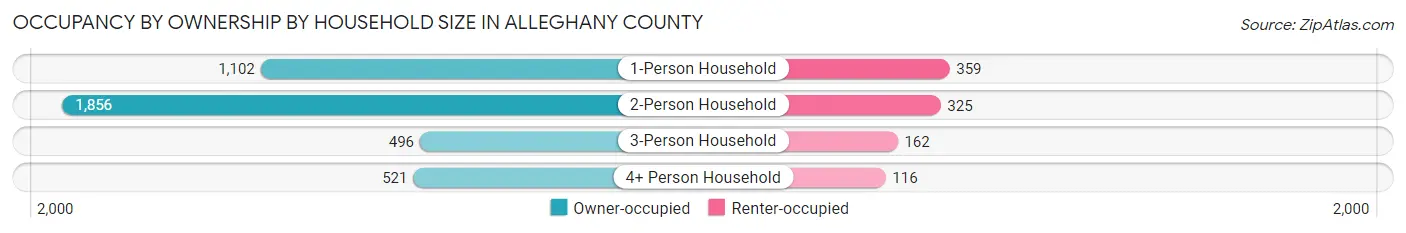
| Household Size | Owner-occupied | Renter-occupied |
| 1-Person Household | 1,102 (75.4%) | 359 (24.6%) |
| 2-Person Household | 1,856 (85.1%) | 325 (14.9%) |
| 3-Person Household | 496 (75.4%) | 162 (24.6%) |
| 4+ Person Household | 521 (81.8%) | 116 (18.2%) |
| Total Housing Units | 3,975 (80.5%) | 962 (19.5%) |
Occupancy by Educational Attainment in Alleghany County
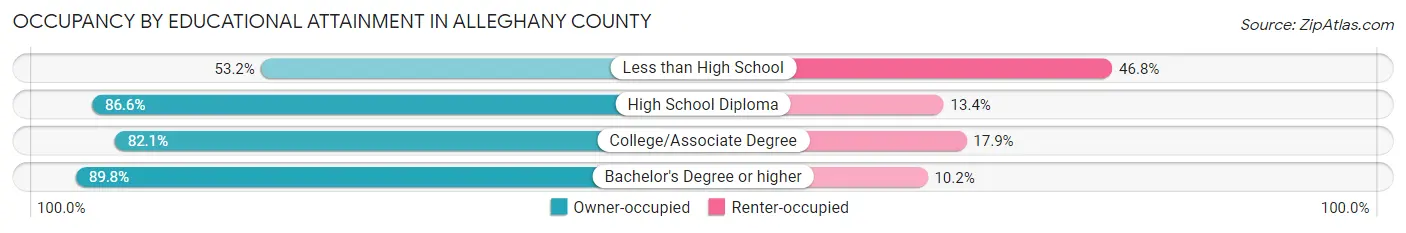
| Household Size | Owner-occupied | Renter-occupied |
| Less than High School | 431 (53.2%) | 379 (46.8%) |
| High School Diploma | 1,217 (86.6%) | 188 (13.4%) |
| College/Associate Degree | 1,258 (82.1%) | 274 (17.9%) |
| Bachelor's Degree or higher | 1,069 (89.8%) | 121 (10.2%) |
Occupancy by Age of Householder in Alleghany County
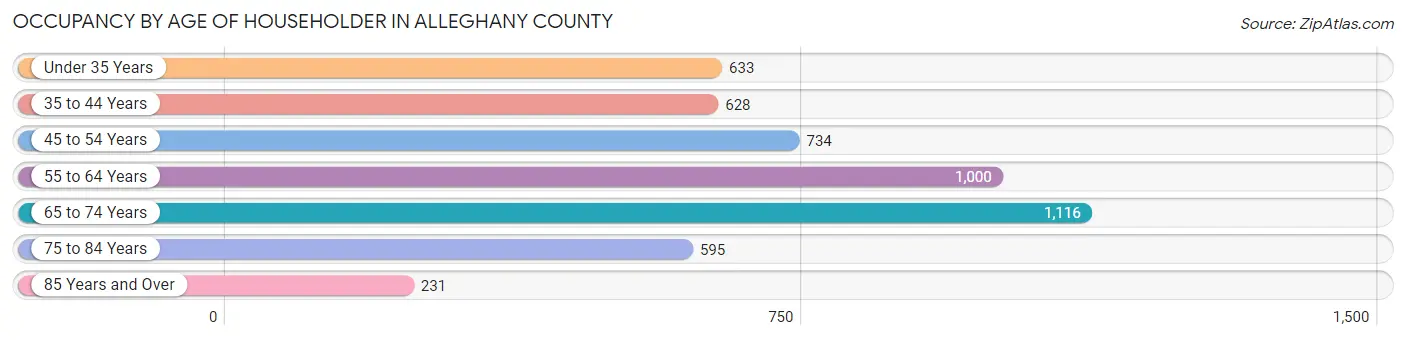
| Age Bracket | # Households | % Households |
| Under 35 Years | 633 | 12.8% |
| 35 to 44 Years | 628 | 12.7% |
| 45 to 54 Years | 734 | 14.9% |
| 55 to 64 Years | 1,000 | 20.3% |
| 65 to 74 Years | 1,116 | 22.6% |
| 75 to 84 Years | 595 | 12.0% |
| 85 Years and Over | 231 | 4.7% |
| Total | 4,937 | 100.0% |
Housing Finances in Alleghany County
Median Income by Occupancy in Alleghany County
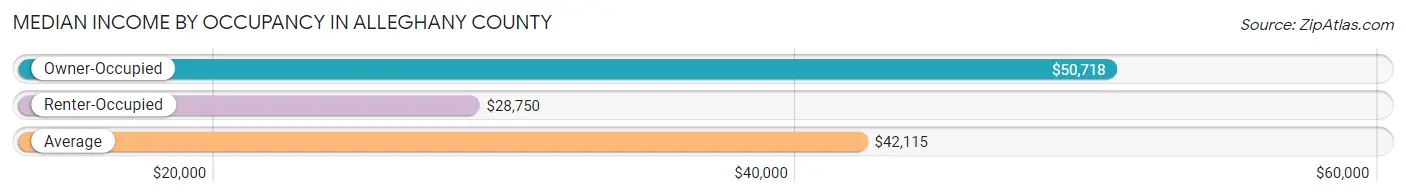
| Occupancy Type | # Households | Median Income |
| Owner-Occupied | 3,975 (80.5%) | $50,718 |
| Renter-Occupied | 962 (19.5%) | $28,750 |
| Average | 4,937 (100.0%) | $42,115 |
Occupancy by Householder Income Bracket in Alleghany County
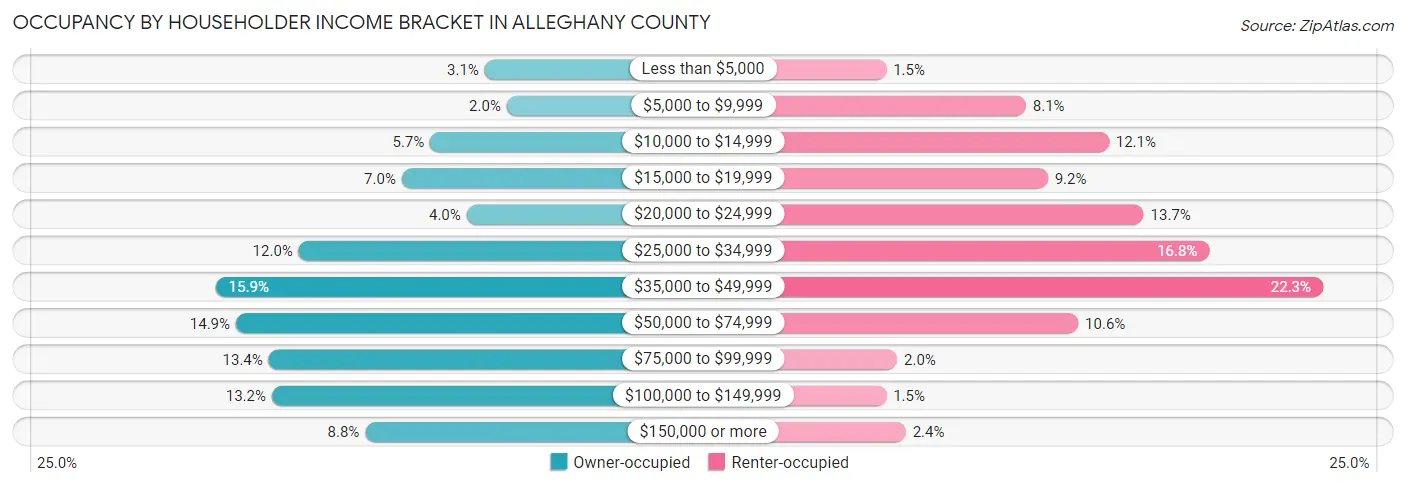
| Income Bracket | Owner-occupied | Renter-occupied |
| Less than $5,000 | 123 (3.1%) | 14 (1.5%) |
| $5,000 to $9,999 | 81 (2.0%) | 78 (8.1%) |
| $10,000 to $14,999 | 226 (5.7%) | 116 (12.1%) |
| $15,000 to $19,999 | 280 (7.0%) | 88 (9.1%) |
| $20,000 to $24,999 | 157 (4.0%) | 132 (13.7%) |
| $25,000 to $34,999 | 475 (11.9%) | 162 (16.8%) |
| $35,000 to $49,999 | 632 (15.9%) | 214 (22.3%) |
| $50,000 to $74,999 | 594 (14.9%) | 102 (10.6%) |
| $75,000 to $99,999 | 532 (13.4%) | 19 (2.0%) |
| $100,000 to $149,999 | 526 (13.2%) | 14 (1.5%) |
| $150,000 or more | 349 (8.8%) | 23 (2.4%) |
| Total | 3,975 (100.0%) | 962 (100.0%) |
Monthly Housing Cost Tiers in Alleghany County
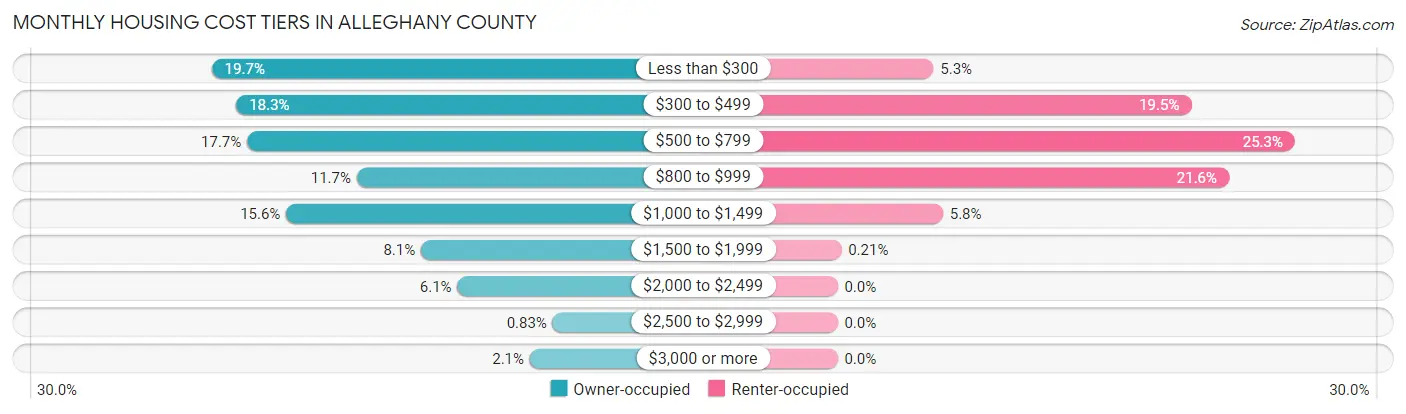
| Monthly Cost | Owner-occupied | Renter-occupied |
| Less than $300 | 782 (19.7%) | 51 (5.3%) |
| $300 to $499 | 728 (18.3%) | 188 (19.5%) |
| $500 to $799 | 704 (17.7%) | 243 (25.3%) |
| $800 to $999 | 463 (11.7%) | 208 (21.6%) |
| $1,000 to $1,499 | 618 (15.5%) | 56 (5.8%) |
| $1,500 to $1,999 | 322 (8.1%) | 2 (0.2%) |
| $2,000 to $2,499 | 242 (6.1%) | 0 (0.0%) |
| $2,500 to $2,999 | 33 (0.8%) | 0 (0.0%) |
| $3,000 or more | 83 (2.1%) | 0 (0.0%) |
| Total | 3,975 (100.0%) | 962 (100.0%) |
Physical Housing Characteristics in Alleghany County
Housing Structures in Alleghany County
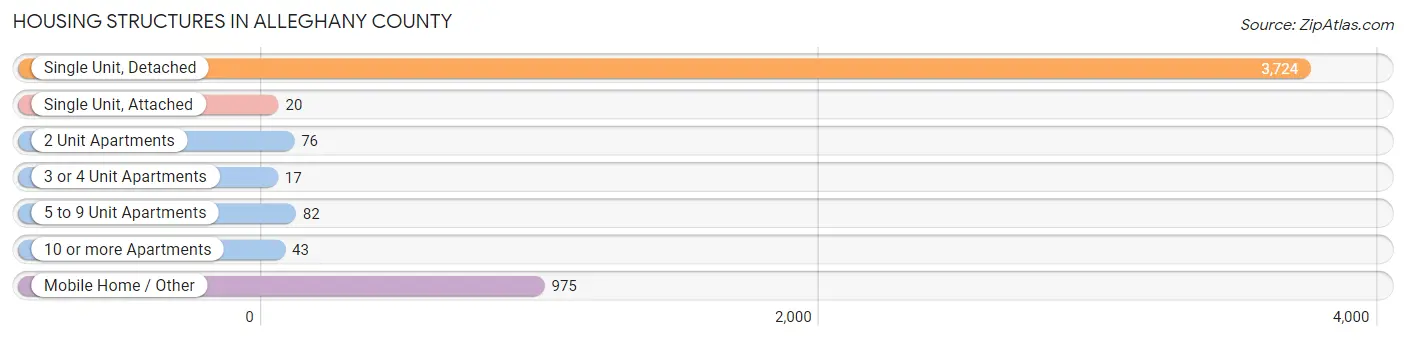
| Structure Type | # Housing Units | % Housing Units |
| Single Unit, Detached | 3,724 | 75.4% |
| Single Unit, Attached | 20 | 0.4% |
| 2 Unit Apartments | 76 | 1.5% |
| 3 or 4 Unit Apartments | 17 | 0.3% |
| 5 to 9 Unit Apartments | 82 | 1.7% |
| 10 or more Apartments | 43 | 0.9% |
| Mobile Home / Other | 975 | 19.8% |
| Total | 4,937 | 100.0% |
Housing Structures by Occupancy in Alleghany County
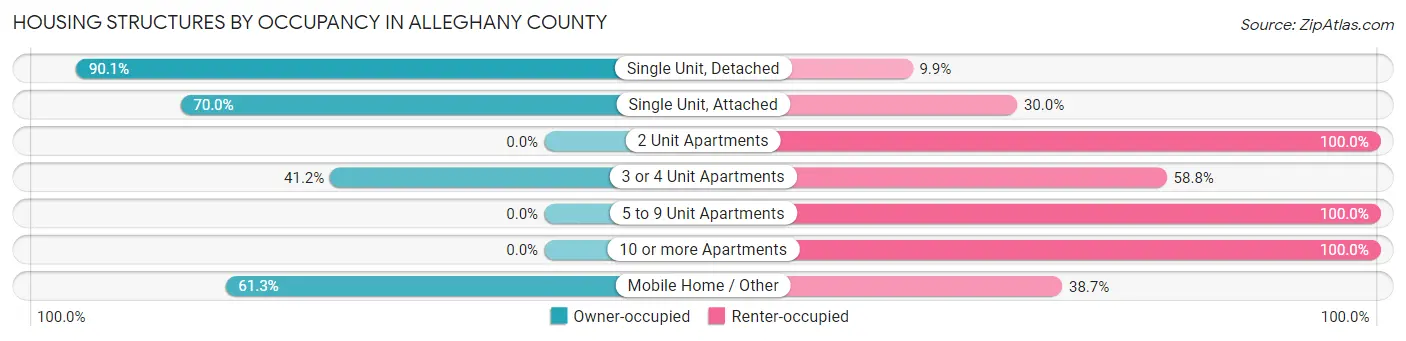
| Structure Type | Owner-occupied | Renter-occupied |
| Single Unit, Detached | 3,356 (90.1%) | 368 (9.9%) |
| Single Unit, Attached | 14 (70.0%) | 6 (30.0%) |
| 2 Unit Apartments | 0 (0.0%) | 76 (100.0%) |
| 3 or 4 Unit Apartments | 7 (41.2%) | 10 (58.8%) |
| 5 to 9 Unit Apartments | 0 (0.0%) | 82 (100.0%) |
| 10 or more Apartments | 0 (0.0%) | 43 (100.0%) |
| Mobile Home / Other | 598 (61.3%) | 377 (38.7%) |
| Total | 3,975 (80.5%) | 962 (19.5%) |
Housing Structures by Number of Rooms in Alleghany County
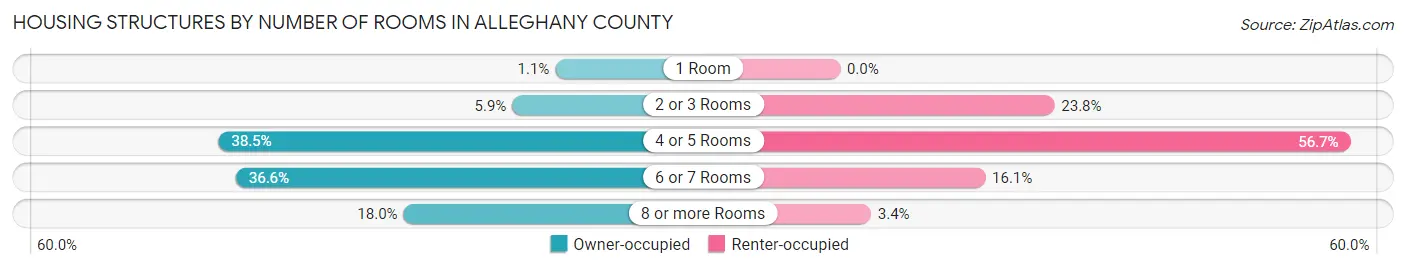
| Number of Rooms | Owner-occupied | Renter-occupied |
| 1 Room | 44 (1.1%) | 0 (0.0%) |
| 2 or 3 Rooms | 234 (5.9%) | 229 (23.8%) |
| 4 or 5 Rooms | 1,530 (38.5%) | 545 (56.7%) |
| 6 or 7 Rooms | 1,453 (36.5%) | 155 (16.1%) |
| 8 or more Rooms | 714 (18.0%) | 33 (3.4%) |
| Total | 3,975 (100.0%) | 962 (100.0%) |
Housing Structure by Heating Type in Alleghany County
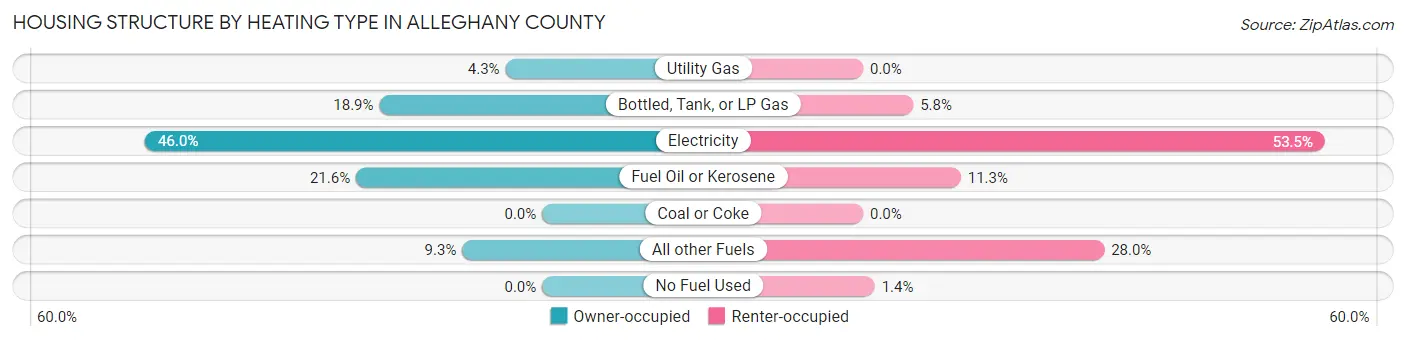
| Heating Type | Owner-occupied | Renter-occupied |
| Utility Gas | 169 (4.3%) | 0 (0.0%) |
| Bottled, Tank, or LP Gas | 750 (18.9%) | 56 (5.8%) |
| Electricity | 1,830 (46.0%) | 515 (53.5%) |
| Fuel Oil or Kerosene | 858 (21.6%) | 109 (11.3%) |
| Coal or Coke | 0 (0.0%) | 0 (0.0%) |
| All other Fuels | 368 (9.3%) | 269 (28.0%) |
| No Fuel Used | 0 (0.0%) | 13 (1.3%) |
| Total | 3,975 (100.0%) | 962 (100.0%) |
Household Vehicle Usage in Alleghany County
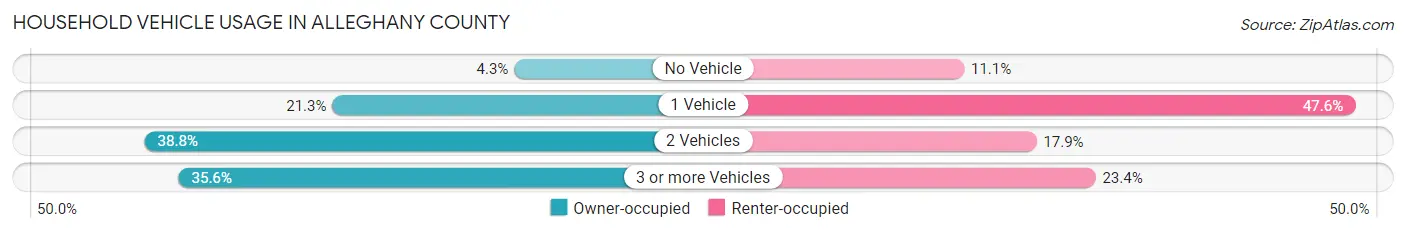
| Vehicles per Household | Owner-occupied | Renter-occupied |
| No Vehicle | 171 (4.3%) | 107 (11.1%) |
| 1 Vehicle | 846 (21.3%) | 458 (47.6%) |
| 2 Vehicles | 1,542 (38.8%) | 172 (17.9%) |
| 3 or more Vehicles | 1,416 (35.6%) | 225 (23.4%) |
| Total | 3,975 (100.0%) | 962 (100.0%) |
Real Estate & Mortgages in Alleghany County
Real Estate and Mortgage Overview in Alleghany County
| Characteristic | Without Mortgage | With Mortgage |
| Housing Units | 1,902 | 2,073 |
| Median Property Value | $153,800 | $186,200 |
| Median Household Income | $36,686 | $262 |
| Monthly Housing Costs | $341 | $72 |
| Real Estate Taxes | $998 | $0 |
Property Value by Mortgage Status in Alleghany County
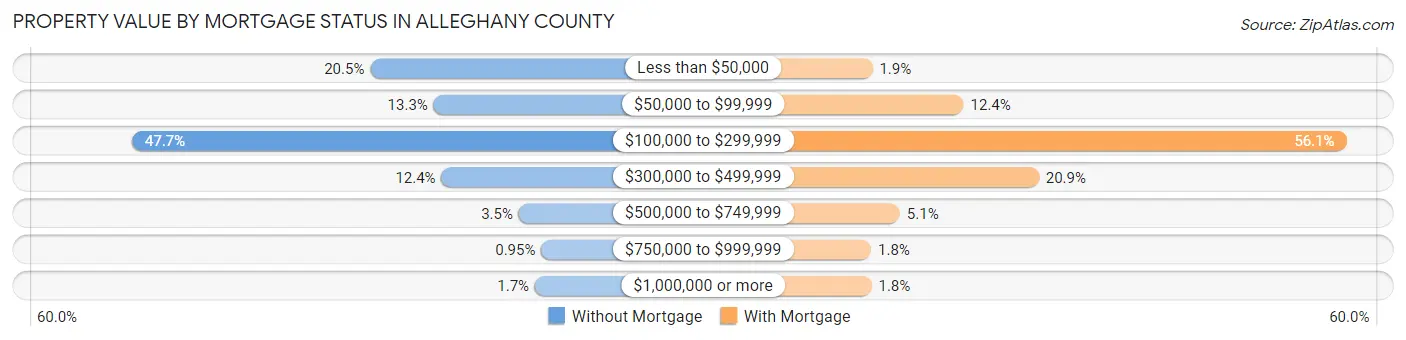
| Property Value | Without Mortgage | With Mortgage |
| Less than $50,000 | 390 (20.5%) | 40 (1.9%) |
| $50,000 to $99,999 | 252 (13.3%) | 256 (12.3%) |
| $100,000 to $299,999 | 908 (47.7%) | 1,163 (56.1%) |
| $300,000 to $499,999 | 235 (12.4%) | 434 (20.9%) |
| $500,000 to $749,999 | 67 (3.5%) | 105 (5.1%) |
| $750,000 to $999,999 | 18 (0.9%) | 37 (1.8%) |
| $1,000,000 or more | 32 (1.7%) | 38 (1.8%) |
| Total | 1,902 (100.0%) | 2,073 (100.0%) |
Household Income by Mortgage Status in Alleghany County
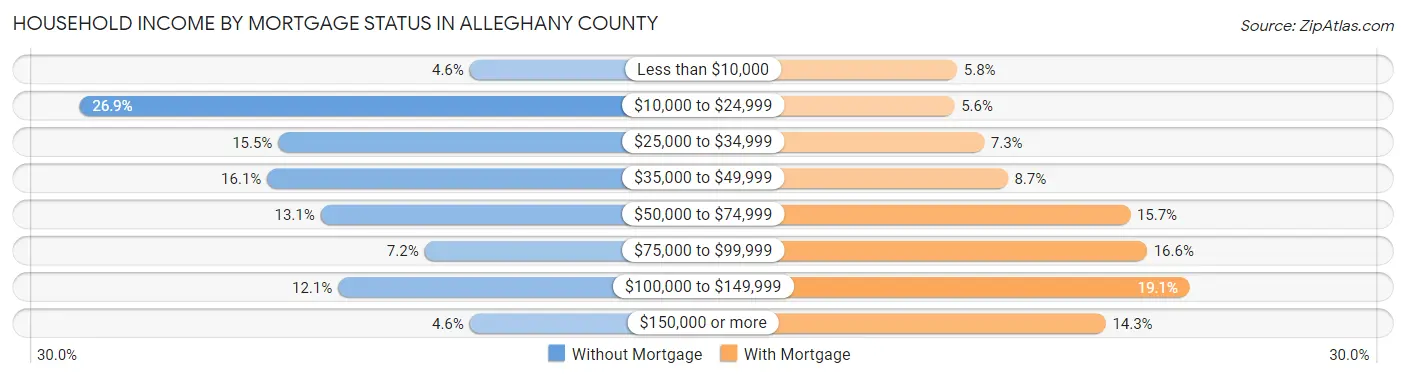
| Household Income | Without Mortgage | With Mortgage |
| Less than $10,000 | 87 (4.6%) | 120 (5.8%) |
| $10,000 to $24,999 | 511 (26.9%) | 117 (5.6%) |
| $25,000 to $34,999 | 295 (15.5%) | 152 (7.3%) |
| $35,000 to $49,999 | 307 (16.1%) | 180 (8.7%) |
| $50,000 to $74,999 | 249 (13.1%) | 325 (15.7%) |
| $75,000 to $99,999 | 136 (7.1%) | 345 (16.6%) |
| $100,000 to $149,999 | 230 (12.1%) | 396 (19.1%) |
| $150,000 or more | 87 (4.6%) | 296 (14.3%) |
| Total | 1,902 (100.0%) | 2,073 (100.0%) |
Property Value to Household Income Ratio in Alleghany County
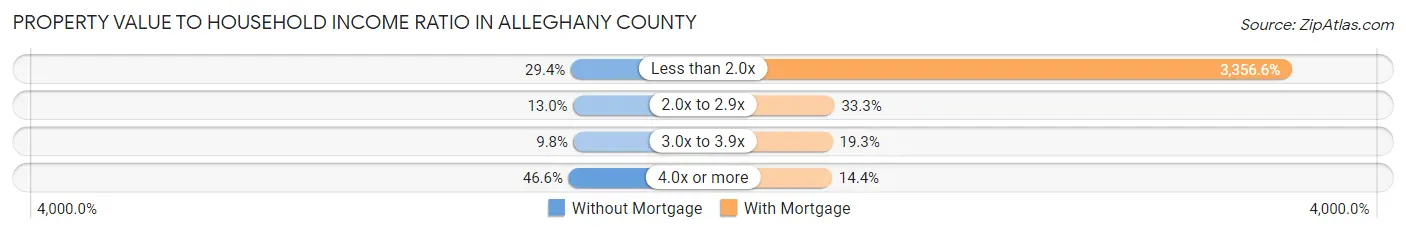
| Value-to-Income Ratio | Without Mortgage | With Mortgage |
| Less than 2.0x | 559 (29.4%) | 69,583 (3,356.6%) |
| 2.0x to 2.9x | 247 (13.0%) | 691 (33.3%) |
| 3.0x to 3.9x | 187 (9.8%) | 399 (19.3%) |
| 4.0x or more | 886 (46.6%) | 299 (14.4%) |
| Total | 1,902 (100.0%) | 2,073 (100.0%) |
Real Estate Taxes by Mortgage Status in Alleghany County
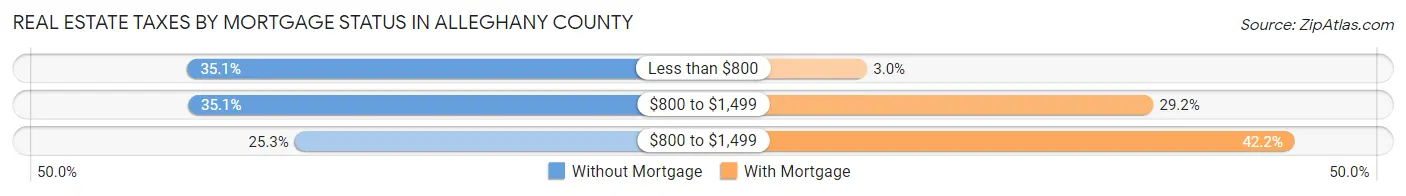
| Property Taxes | Without Mortgage | With Mortgage |
| Less than $800 | 668 (35.1%) | 63 (3.0%) |
| $800 to $1,499 | 667 (35.1%) | 605 (29.2%) |
| $800 to $1,499 | 482 (25.3%) | 874 (42.2%) |
| Total | 1,902 (100.0%) | 2,073 (100.0%) |
Health & Disability in Alleghany County
Health Insurance Coverage by Age in Alleghany County
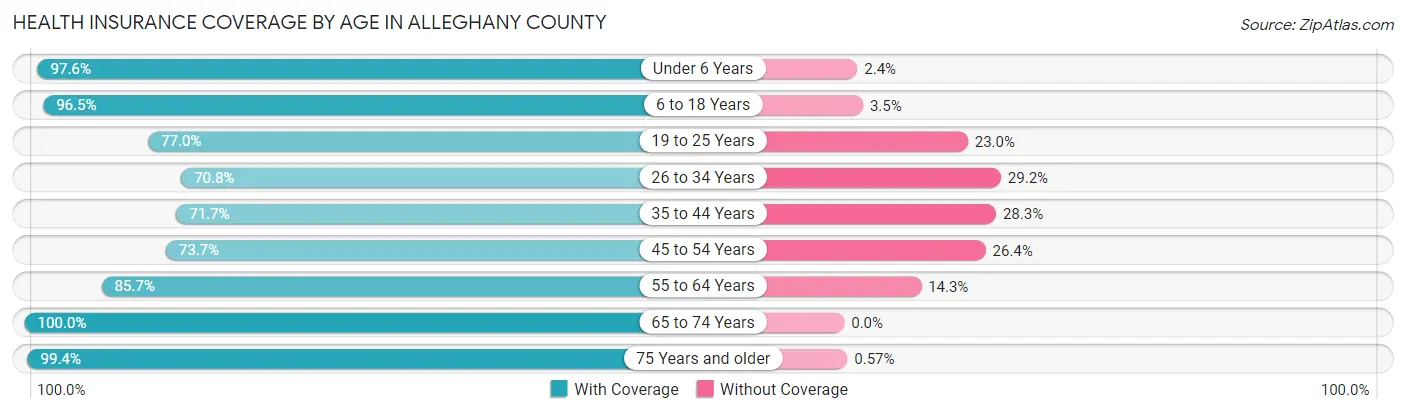
| Age Bracket | With Coverage | Without Coverage |
| Under 6 Years | 561 (97.6%) | 14 (2.4%) |
| 6 to 18 Years | 1,274 (96.5%) | 46 (3.5%) |
| 19 to 25 Years | 538 (77.0%) | 161 (23.0%) |
| 26 to 34 Years | 744 (70.8%) | 307 (29.2%) |
| 35 to 44 Years | 773 (71.7%) | 305 (28.3%) |
| 45 to 54 Years | 1,026 (73.7%) | 367 (26.4%) |
| 55 to 64 Years | 1,505 (85.7%) | 252 (14.3%) |
| 65 to 74 Years | 1,775 (100.0%) | 0 (0.0%) |
| 75 Years and older | 1,225 (99.4%) | 7 (0.6%) |
| Total | 9,421 (86.6%) | 1,459 (13.4%) |
Health Insurance Coverage by Citizenship Status in Alleghany County

| Citizenship Status | With Coverage | Without Coverage |
| Native Born | 561 (97.6%) | 14 (2.4%) |
| Foreign Born, Citizen | 1,274 (96.5%) | 46 (3.5%) |
| Foreign Born, not a Citizen | 538 (77.0%) | 161 (23.0%) |
Health Insurance Coverage by Household Income in Alleghany County
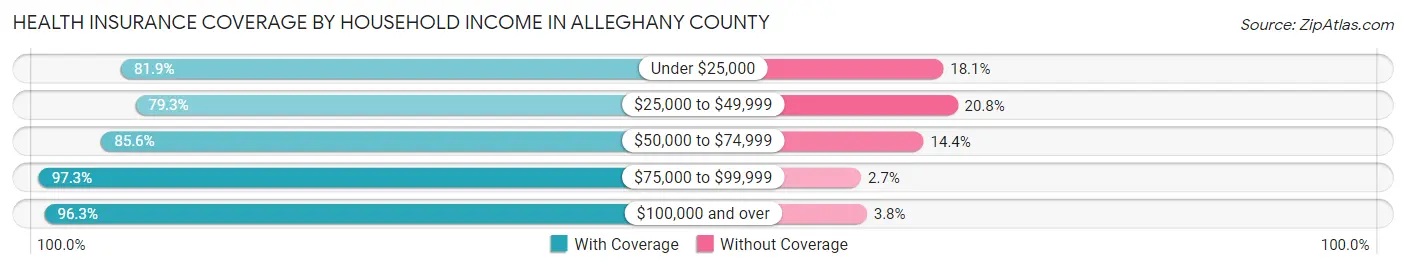
| Household Income | With Coverage | Without Coverage |
| Under $25,000 | 1,808 (81.9%) | 399 (18.1%) |
| $25,000 to $49,999 | 2,521 (79.2%) | 660 (20.7%) |
| $50,000 to $74,999 | 1,476 (85.6%) | 248 (14.4%) |
| $75,000 to $99,999 | 1,235 (97.3%) | 34 (2.7%) |
| $100,000 and over | 2,333 (96.3%) | 91 (3.7%) |
Public vs Private Health Insurance Coverage by Age in Alleghany County
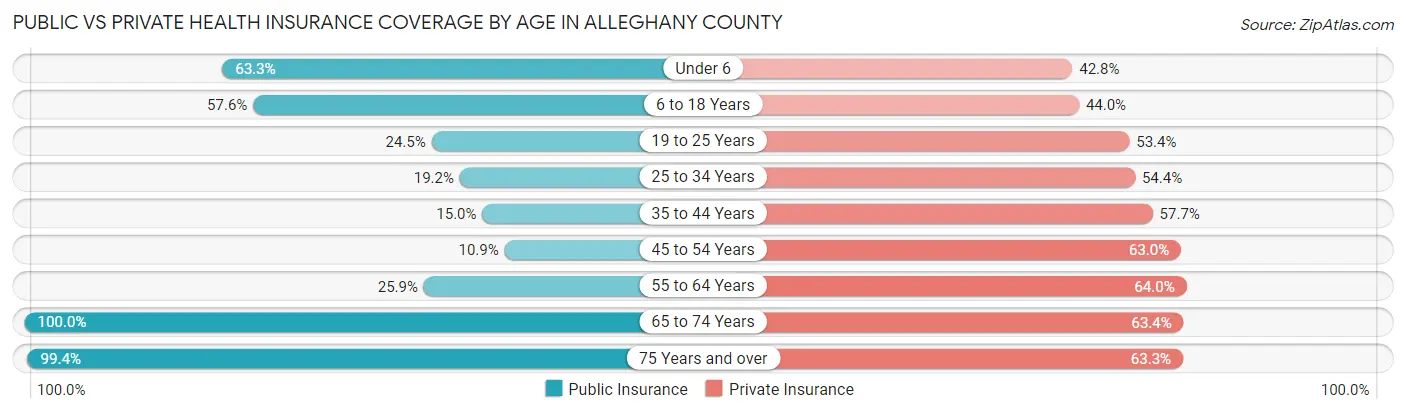
| Age Bracket | Public Insurance | Private Insurance |
| Under 6 | 364 (63.3%) | 246 (42.8%) |
| 6 to 18 Years | 760 (57.6%) | 581 (44.0%) |
| 19 to 25 Years | 171 (24.5%) | 373 (53.4%) |
| 25 to 34 Years | 202 (19.2%) | 572 (54.4%) |
| 35 to 44 Years | 162 (15.0%) | 622 (57.7%) |
| 45 to 54 Years | 152 (10.9%) | 877 (63.0%) |
| 55 to 64 Years | 455 (25.9%) | 1,124 (64.0%) |
| 65 to 74 Years | 1,775 (100.0%) | 1,126 (63.4%) |
| 75 Years and over | 1,225 (99.4%) | 780 (63.3%) |
| Total | 5,266 (48.4%) | 6,301 (57.9%) |
Disability Status by Sex by Age in Alleghany County
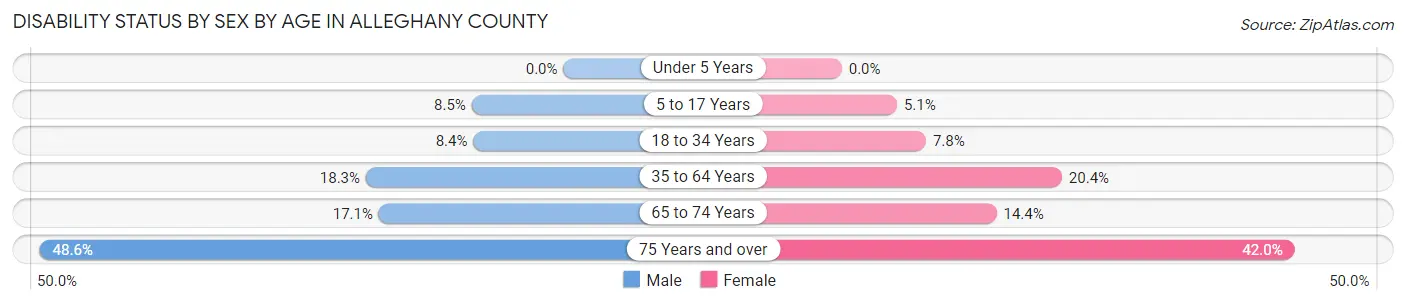
| Age Bracket | Male | Female |
| Under 5 Years | 0 (0.0%) | 0 (0.0%) |
| 5 to 17 Years | 51 (8.5%) | 38 (5.1%) |
| 18 to 34 Years | 80 (8.4%) | 70 (7.8%) |
| 35 to 64 Years | 383 (18.3%) | 437 (20.4%) |
| 65 to 74 Years | 149 (17.1%) | 130 (14.4%) |
| 75 Years and over | 261 (48.6%) | 292 (42.0%) |
Disability Class by Sex by Age in Alleghany County
Disability Class: Hearing Difficulty
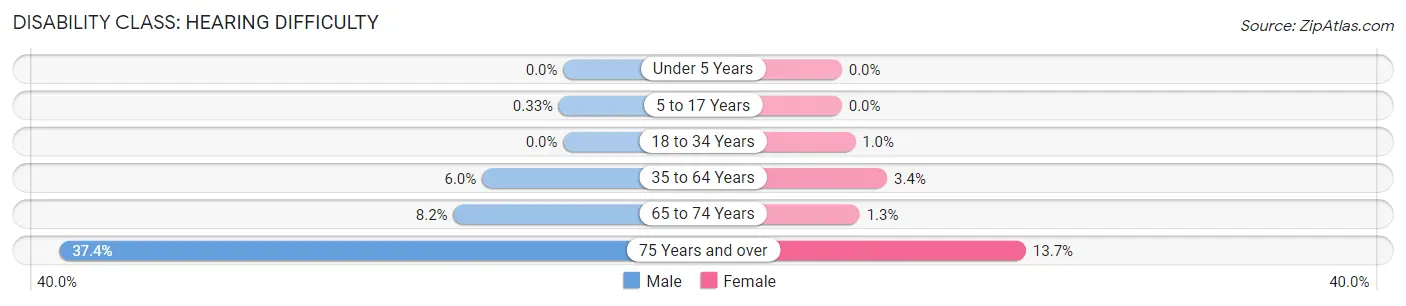
| Age Bracket | Male | Female |
| Under 5 Years | 0 (0.0%) | 0 (0.0%) |
| 5 to 17 Years | 2 (0.3%) | 0 (0.0%) |
| 18 to 34 Years | 0 (0.0%) | 9 (1.0%) |
| 35 to 64 Years | 126 (6.0%) | 72 (3.4%) |
| 65 to 74 Years | 71 (8.2%) | 12 (1.3%) |
| 75 Years and over | 201 (37.4%) | 95 (13.7%) |
Disability Class: Vision Difficulty
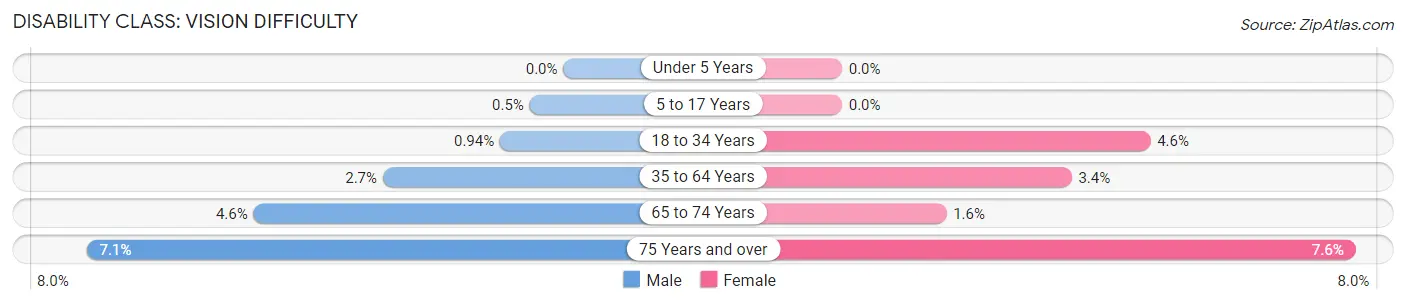
| Age Bracket | Male | Female |
| Under 5 Years | 0 (0.0%) | 0 (0.0%) |
| 5 to 17 Years | 3 (0.5%) | 0 (0.0%) |
| 18 to 34 Years | 9 (0.9%) | 41 (4.6%) |
| 35 to 64 Years | 56 (2.7%) | 73 (3.4%) |
| 65 to 74 Years | 40 (4.6%) | 14 (1.5%) |
| 75 Years and over | 38 (7.1%) | 53 (7.6%) |
Disability Class: Cognitive Difficulty
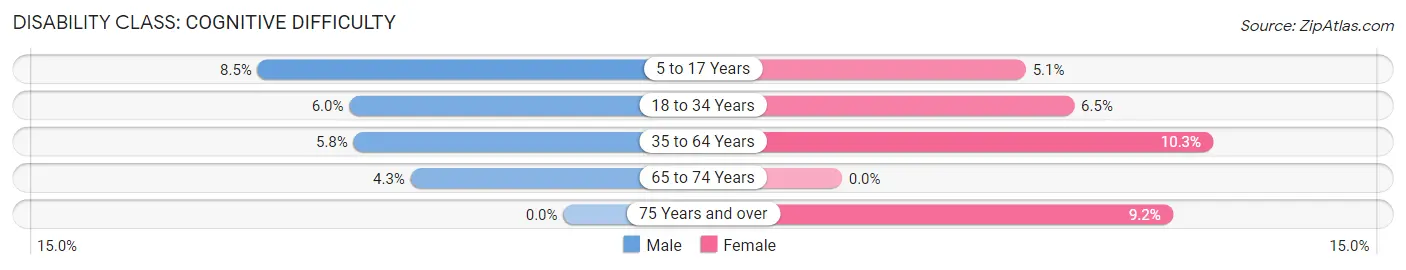
| Age Bracket | Male | Female |
| 5 to 17 Years | 51 (8.5%) | 38 (5.1%) |
| 18 to 34 Years | 57 (6.0%) | 58 (6.5%) |
| 35 to 64 Years | 122 (5.8%) | 221 (10.3%) |
| 65 to 74 Years | 37 (4.3%) | 0 (0.0%) |
| 75 Years and over | 0 (0.0%) | 64 (9.2%) |
Disability Class: Ambulatory Difficulty
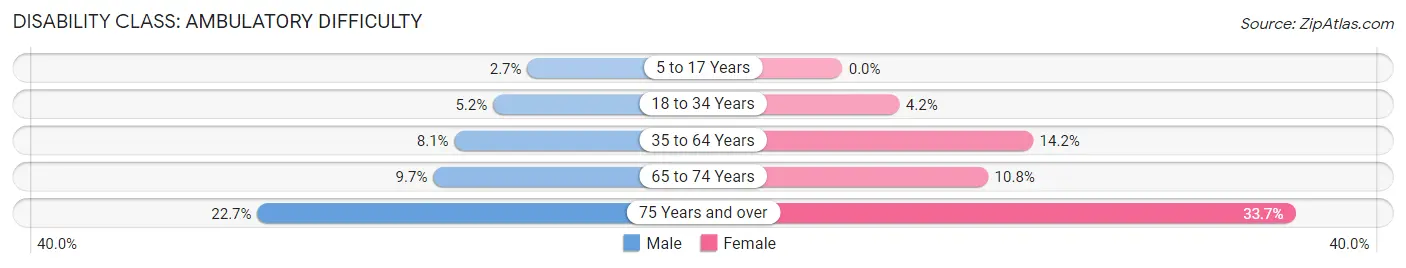
| Age Bracket | Male | Female |
| 5 to 17 Years | 16 (2.7%) | 0 (0.0%) |
| 18 to 34 Years | 50 (5.2%) | 38 (4.2%) |
| 35 to 64 Years | 169 (8.1%) | 303 (14.2%) |
| 65 to 74 Years | 84 (9.7%) | 98 (10.8%) |
| 75 Years and over | 122 (22.7%) | 234 (33.7%) |
Disability Class: Self-Care Difficulty
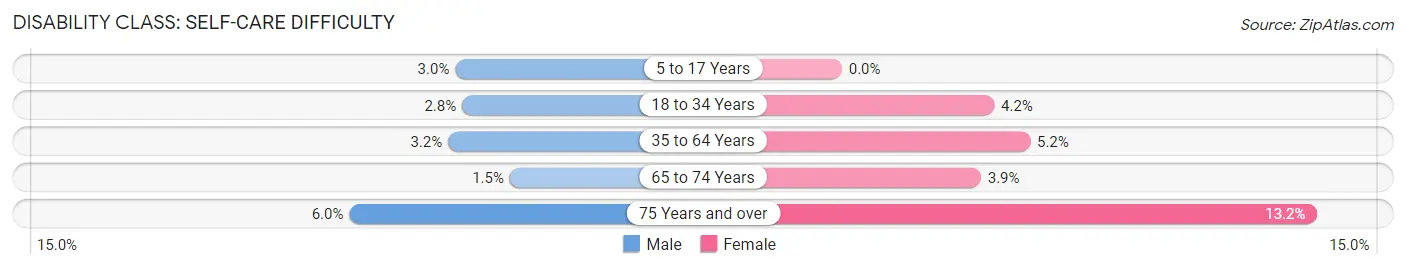
| Age Bracket | Male | Female |
| 5 to 17 Years | 18 (3.0%) | 0 (0.0%) |
| 18 to 34 Years | 27 (2.8%) | 38 (4.2%) |
| 35 to 64 Years | 67 (3.2%) | 112 (5.2%) |
| 65 to 74 Years | 13 (1.5%) | 35 (3.9%) |
| 75 Years and over | 32 (6.0%) | 92 (13.2%) |
Technology Access in Alleghany County
Computing Device Access in Alleghany County
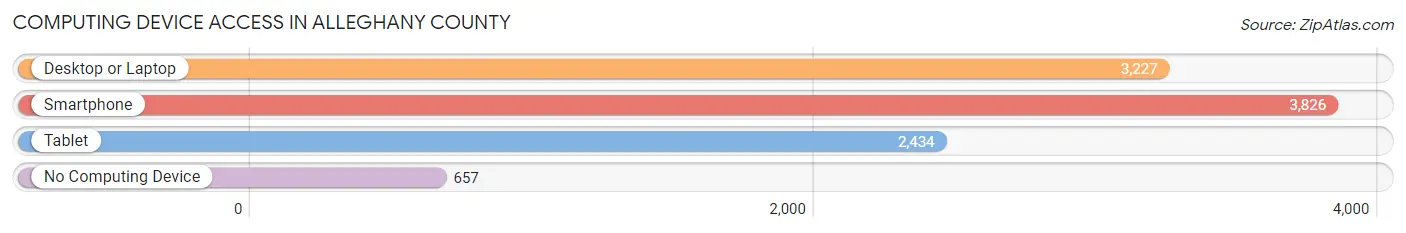
| Device Type | # Households | % Households |
| Desktop or Laptop | 3,227 | 65.4% |
| Smartphone | 3,826 | 77.5% |
| Tablet | 2,434 | 49.3% |
| No Computing Device | 657 | 13.3% |
| Total | 4,937 | 100.0% |
Internet Access in Alleghany County
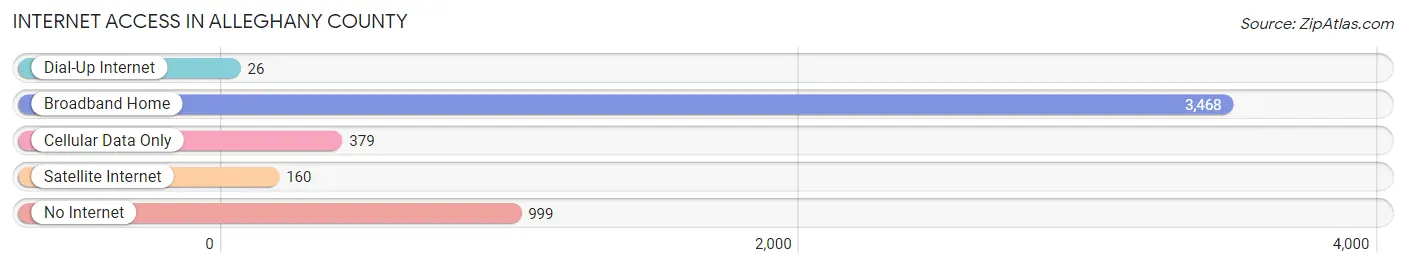
| Internet Type | # Households | % Households |
| Dial-Up Internet | 26 | 0.5% |
| Broadband Home | 3,468 | 70.3% |
| Cellular Data Only | 379 | 7.7% |
| Satellite Internet | 160 | 3.2% |
| No Internet | 999 | 20.2% |
| Total | 4,937 | 100.0% |
Alleghany County Summary
Alleghany County is located in the northwestern corner of North Carolina, and is part of the Blue Ridge Mountains region. It is bordered by Wilkes County to the north, Surry County to the east, Ashe County to the south, and Alleghany County, Virginia to the west. The county seat is Sparta, and the county has a total area of 437 square miles.
History
Alleghany County was formed in 1859 from parts of Ashe and Wilkes counties. It was named for the Allegheny Mountains, which run through the county. The county was home to the Saura Indians, who were part of the Siouan-speaking tribes of the region. The first European settlers arrived in the area in the late 1700s, and the county was officially established in 1859.
During the Civil War, Alleghany County was a major supplier of food and supplies to the Confederate Army. The county was also home to several Confederate camps, including Camp Vance, which was located near Sparta. After the war, the county experienced a period of economic growth, as the railroad was built through the area in the late 1800s.
Geography
Alleghany County is located in the northwestern corner of North Carolina, and is part of the Blue Ridge Mountains region. It is bordered by Wilkes County to the north, Surry County to the east, Ashe County to the south, and Alleghany County, Virginia to the west. The county has a total area of 437 square miles, and is home to several mountain peaks, including Grandfather Mountain, which is the highest peak in the county at 5,946 feet.
The county is home to several rivers and streams, including the New River, which is the longest river in the state. The county is also home to several state parks, including Stone Mountain State Park, which is located in the northern part of the county.
Economy
Alleghany County has a diverse economy, with a mix of agriculture, manufacturing, and tourism. The county is home to several large employers, including the Alleghany County Schools, Alleghany Memorial Hospital, and the Alleghany County Government.
Agriculture is an important part of the county’s economy, and the county is home to several large farms, including the Alleghany County Farm Bureau. The county is also home to several wineries, including the Alleghany County Winery.
Manufacturing is also an important part of the county’s economy, and the county is home to several large factories, including the Alleghany County Textile Mill. The county is also home to several small businesses, including restaurants, retail stores, and other services.
Tourism is also an important part of the county’s economy, and the county is home to several popular attractions, including the Blue Ridge Parkway, the New River, and Stone Mountain State Park. The county is also home to several festivals and events, including the Alleghany County Fair and the Alleghany County Music Festival.
Demographics
As of the 2010 census, Alleghany County had a population of 11,155. The population was spread out, with 48.3% male and 51.7% female. The median age was 43.7 years, and the median household income was $37,945.
The racial makeup of the county was 95.2% White, 1.7% African American, 0.3% Native American, 0.3% Asian, 0.1% Pacific Islander, 1.2% from other races, and 1.3% from two or more races. Hispanic or Latino of any race were 2.7% of the population.
The largest ancestry groups in Alleghany County were English (37.2%), German (17.2%), Irish (14.2%), and American (10.2%). The county is also home to a large Amish population, with over 1,000 Amish living in the county.
Alleghany County is a rural county, and the majority of the population lives in small towns and rural areas. The county is home to several small towns, including Sparta, the county seat, and Laurel Springs, the largest town in the county. The county is also home to several unincorporated communities, including Glade Valley, Piney Creek, and Whitehead.
Common Questions
What is Per Capita Income in Alleghany County?
Per Capita income in Alleghany County is $32,330.
What is the Median Family Income in Alleghany County?
Median Family Income in Alleghany County is $57,432.
What is the Median Household income in Alleghany County?
Median Household Income in Alleghany County is $42,115.
What is Income or Wage Gap in Alleghany County?
Income or Wage Gap in Alleghany County is 19.2%.
Women in Alleghany County earn 80.8 cents for every dollar earned by a man.
What is Family Income Deficit in Alleghany County?
Family Income Deficit in Alleghany County is $11,892.
Families that are below poverty line in Alleghany County earn $11,892 less on average than the poverty threshold level.
What is Inequality or Gini Index in Alleghany County?
Inequality or Gini Index in Alleghany County is 0.52.
What is the Total Population of Alleghany County?
Total Population of Alleghany County is 10,989.
What is the Total Male Population of Alleghany County?
Total Male Population of Alleghany County is 5,340.
What is the Total Female Population of Alleghany County?
Total Female Population of Alleghany County is 5,649.
What is the Ratio of Males per 100 Females in Alleghany County?
There are 94.53 Males per 100 Females in Alleghany County.
What is the Ratio of Females per 100 Males in Alleghany County?
There are 105.79 Females per 100 Males in Alleghany County.
What is the Median Population Age in Alleghany County?
Median Population Age in Alleghany County is 50.6 Years.
What is the Average Family Size in Alleghany County
Average Family Size in Alleghany County is 2.7 People.
What is the Average Household Size in Alleghany County
Average Household Size in Alleghany County is 2.2 People.
How Large is the Labor Force in Alleghany County?
There are 4,646 People in the Labor Forcein in Alleghany County.
What is the Percentage of People in the Labor Force in Alleghany County?
49.4% of People are in the Labor Force in Alleghany County.
What is the Unemployment Rate in Alleghany County?
Unemployment Rate in Alleghany County is 5.3%.