Alexander County, NC Map & Demographics
Alexander County Map
Alexander County Overview
$30,510
PER CAPITA INCOME
$72,821
AVG FAMILY INCOME
$62,764
AVG HOUSEHOLD INCOME
21.4%
WAGE / INCOME GAP [ % ]
78.6¢/ $1
WAGE / INCOME GAP [ $ ]
$10,473
FAMILY INCOME DEFICIT
0.43
INEQUALITY / GINI INDEX
36,505
TOTAL POPULATION
18,896
MALE POPULATION
17,609
FEMALE POPULATION
107.31
MALES / 100 FEMALES
93.19
FEMALES / 100 MALES
43.9
MEDIAN AGE
3.0
AVG FAMILY SIZE
2.6
AVG HOUSEHOLD SIZE
17,598
LABOR FORCE [ PEOPLE ]
58.1%
PERCENT IN LABOR FORCE
5.6%
UNEMPLOYMENT RATE
Income in Alexander County
Income Overview in Alexander County
Per Capita Income in Alexander County is $30,510, while median incomes of families and households are $72,821 and $62,764 respectively.
| Characteristic | Number | Measure |
| Per Capita Income | 36,505 | $30,510 |
| Median Family Income | 9,734 | $72,821 |
| Mean Family Income | 9,734 | $90,889 |
| Median Household Income | 13,761 | $62,764 |
| Mean Household Income | 13,761 | $79,024 |
| Income Deficit | 9,734 | $10,473 |
| Wage / Income Gap (%) | 36,505 | 21.40% |
| Wage / Income Gap ($) | 36,505 | 78.60¢ per $1 |
| Gini / Inequality Index | 36,505 | 0.43 |
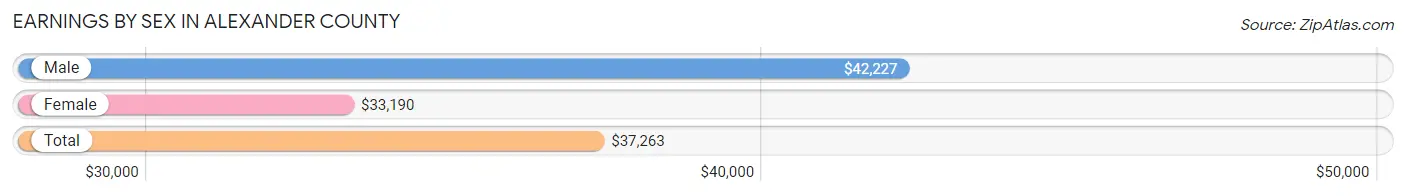
Earnings by Sex in Alexander County
Average Earnings in Alexander County are $37,263, $42,227 for men and $33,190 for women, a difference of 21.4%.
| Sex | Number | Average Earnings |
| Male | 10,061 (55.3%) | $42,227 |
| Female | 8,147 (44.7%) | $33,190 |
| Total | 18,208 (100.0%) | $37,263 |
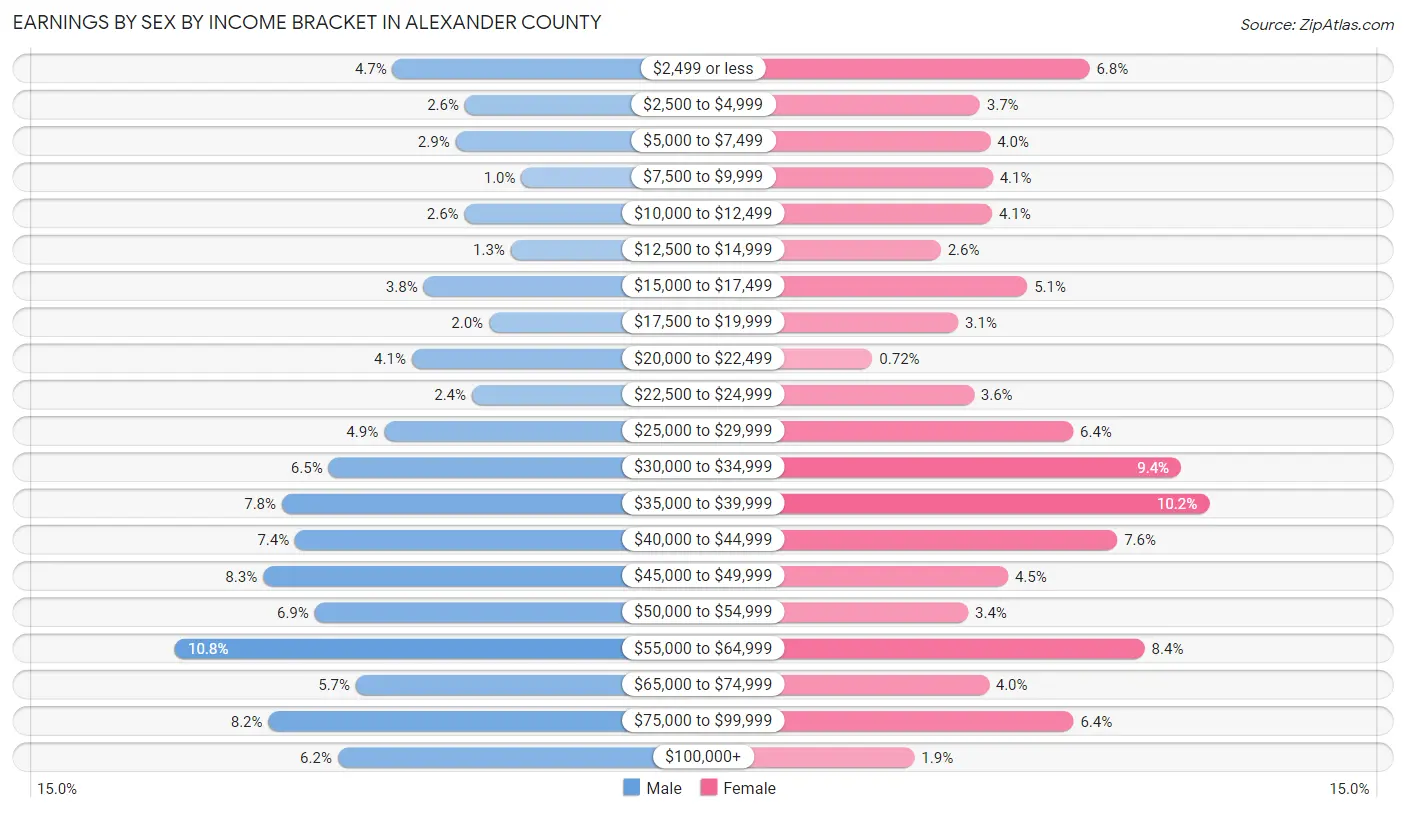
Earnings by Sex by Income Bracket in Alexander County
The most common earnings brackets in Alexander County are $55,000 to $64,999 for men (1,084 | 10.8%) and $35,000 to $39,999 for women (829 | 10.2%).
| Income | Male | Female |
| $2,499 or less | 469 (4.7%) | 556 (6.8%) |
| $2,500 to $4,999 | 265 (2.6%) | 305 (3.7%) |
| $5,000 to $7,499 | 291 (2.9%) | 328 (4.0%) |
| $7,500 to $9,999 | 105 (1.0%) | 334 (4.1%) |
| $10,000 to $12,499 | 266 (2.6%) | 332 (4.1%) |
| $12,500 to $14,999 | 135 (1.3%) | 215 (2.6%) |
| $15,000 to $17,499 | 381 (3.8%) | 413 (5.1%) |
| $17,500 to $19,999 | 196 (1.9%) | 255 (3.1%) |
| $20,000 to $22,499 | 415 (4.1%) | 59 (0.7%) |
| $22,500 to $24,999 | 244 (2.4%) | 291 (3.6%) |
| $25,000 to $29,999 | 493 (4.9%) | 518 (6.4%) |
| $30,000 to $34,999 | 650 (6.5%) | 765 (9.4%) |
| $35,000 to $39,999 | 782 (7.8%) | 829 (10.2%) |
| $40,000 to $44,999 | 745 (7.4%) | 619 (7.6%) |
| $45,000 to $49,999 | 835 (8.3%) | 369 (4.5%) |
| $50,000 to $54,999 | 689 (6.9%) | 278 (3.4%) |
| $55,000 to $64,999 | 1,084 (10.8%) | 682 (8.4%) |
| $65,000 to $74,999 | 572 (5.7%) | 325 (4.0%) |
| $75,000 to $99,999 | 820 (8.2%) | 519 (6.4%) |
| $100,000+ | 624 (6.2%) | 155 (1.9%) |
| Total | 10,061 (100.0%) | 8,147 (100.0%) |
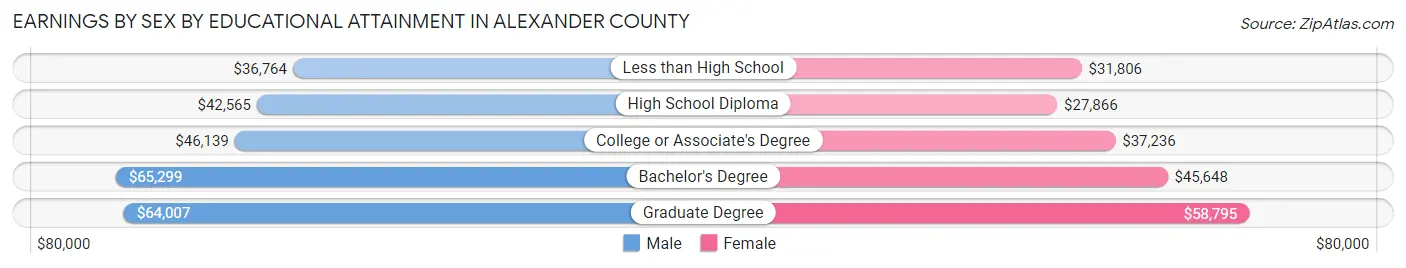
Earnings by Sex by Educational Attainment in Alexander County
Average earnings in Alexander County are $45,118 for men and $36,155 for women, a difference of 19.9%. Men with an educational attainment of bachelor's degree enjoy the highest average annual earnings of $65,299, while those with less than high school education earn the least with $36,764. Women with an educational attainment of graduate degree earn the most with the average annual earnings of $58,795, while those with high school diploma education have the smallest earnings of $27,866.
| Educational Attainment | Male Income | Female Income |
| Less than High School | $36,764 | $31,806 |
| High School Diploma | $42,565 | $27,866 |
| College or Associate's Degree | $46,139 | $37,236 |
| Bachelor's Degree | $65,299 | $45,648 |
| Graduate Degree | $64,007 | $58,795 |
| Total | $45,118 | $36,155 |
Family Income in Alexander County
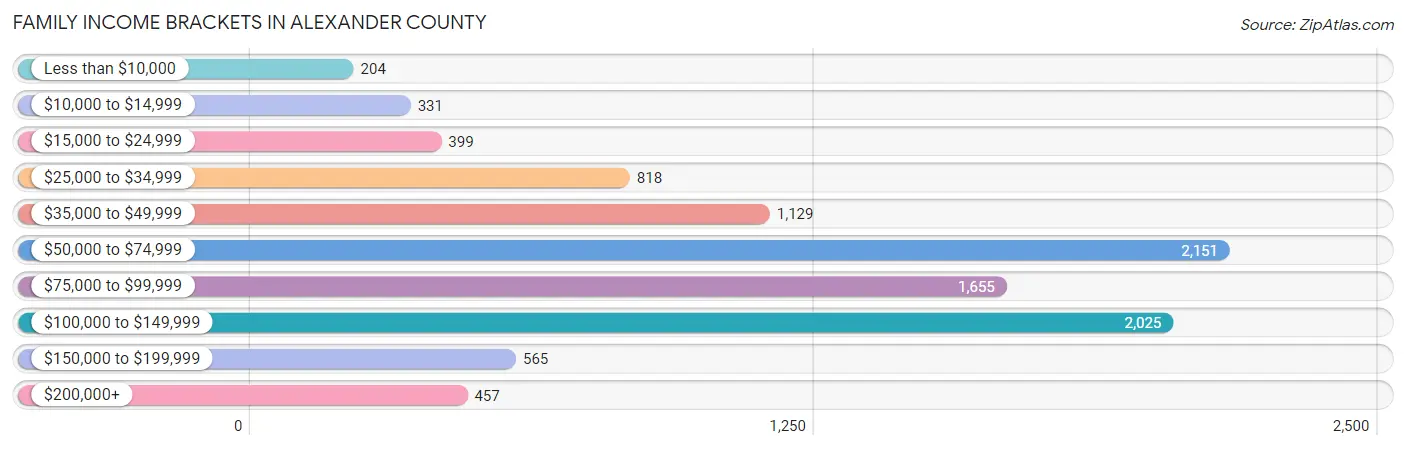
Family Income Brackets in Alexander County
According to the Alexander County family income data, there are 2,151 families falling into the $50,000 to $74,999 income range, which is the most common income bracket and makes up 22.1% of all families. Conversely, the less than $10,000 income bracket is the least frequent group with only 204 families (2.1%) belonging to this category.
| Income Bracket | # Families | % Families |
| Less than $10,000 | 204 | 2.1% |
| $10,000 to $14,999 | 331 | 3.4% |
| $15,000 to $24,999 | 399 | 4.1% |
| $25,000 to $34,999 | 818 | 8.4% |
| $35,000 to $49,999 | 1,129 | 11.6% |
| $50,000 to $74,999 | 2,151 | 22.1% |
| $75,000 to $99,999 | 1,655 | 17.0% |
| $100,000 to $149,999 | 2,025 | 20.8% |
| $150,000 to $199,999 | 565 | 5.8% |
| $200,000+ | 457 | 4.7% |
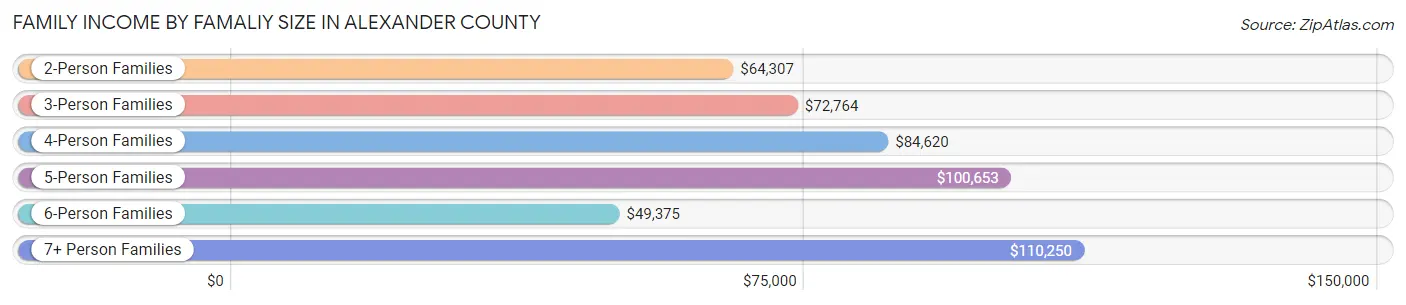
Family Income by Famaliy Size in Alexander County
7+ person families (195 | 2.0%) account for the highest median family income in Alexander County with $110,250 per family, while 2-person families (4,737 | 48.7%) have the highest median income of $32,154 per family member.
| Income Bracket | # Families | Median Income |
| 2-Person Families | 4,737 (48.7%) | $64,307 |
| 3-Person Families | 2,423 (24.9%) | $72,764 |
| 4-Person Families | 1,719 (17.7%) | $84,620 |
| 5-Person Families | 471 (4.8%) | $100,653 |
| 6-Person Families | 189 (1.9%) | $49,375 |
| 7+ Person Families | 195 (2.0%) | $110,250 |
| Total | 9,734 (100.0%) | $72,821 |
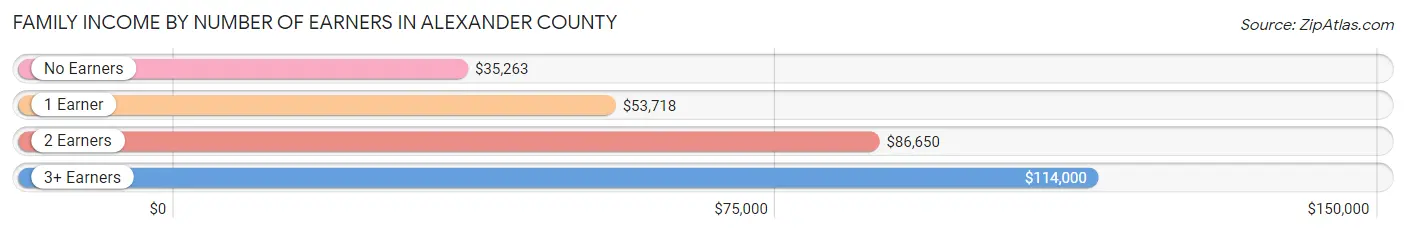
Family Income by Number of Earners in Alexander County
The median family income in Alexander County is $72,821, with families comprising 3+ earners (1,104) having the highest median family income of $114,000, while families with no earners (1,795) have the lowest median family income of $35,263, accounting for 11.3% and 18.4% of families, respectively.
| Number of Earners | # Families | Median Income |
| No Earners | 1,795 (18.4%) | $35,263 |
| 1 Earner | 2,735 (28.1%) | $53,718 |
| 2 Earners | 4,100 (42.1%) | $86,650 |
| 3+ Earners | 1,104 (11.3%) | $114,000 |
| Total | 9,734 (100.0%) | $72,821 |
Household Income in Alexander County
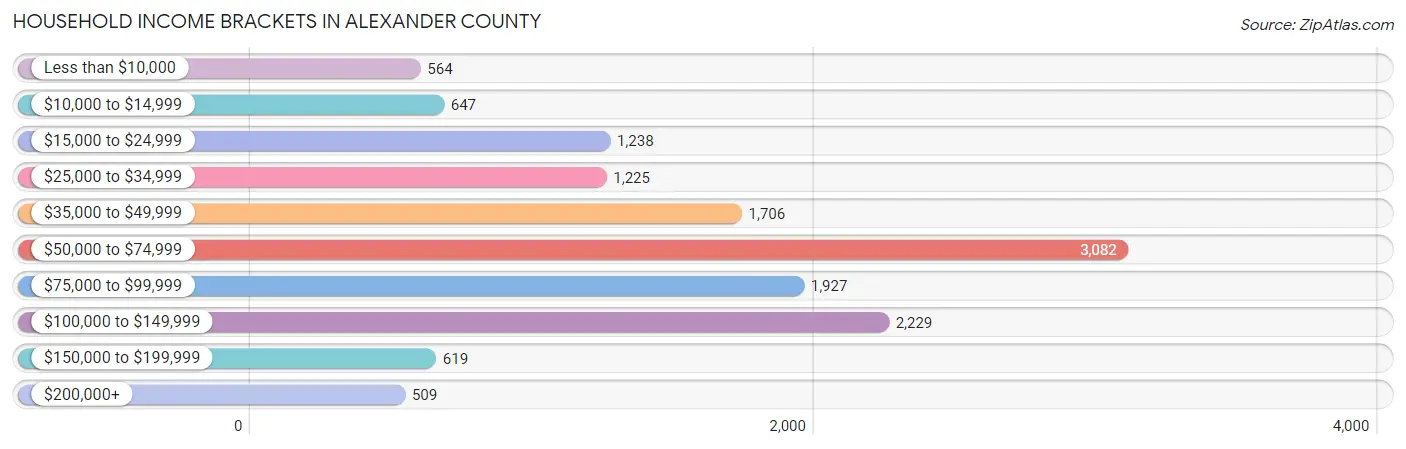
Household Income Brackets in Alexander County
With 3,082 households falling in the category, the $50,000 to $74,999 income range is the most frequent in Alexander County, accounting for 22.4% of all households. In contrast, only 509 households (3.7%) fall into the $200,000+ income bracket, making it the least populous group.
| Income Bracket | # Households | % Households |
| Less than $10,000 | 564 | 4.1% |
| $10,000 to $14,999 | 647 | 4.7% |
| $15,000 to $24,999 | 1,238 | 9.0% |
| $25,000 to $34,999 | 1,225 | 8.9% |
| $35,000 to $49,999 | 1,706 | 12.4% |
| $50,000 to $74,999 | 3,082 | 22.4% |
| $75,000 to $99,999 | 1,927 | 14.0% |
| $100,000 to $149,999 | 2,229 | 16.2% |
| $150,000 to $199,999 | 619 | 4.5% |
| $200,000+ | 509 | 3.7% |
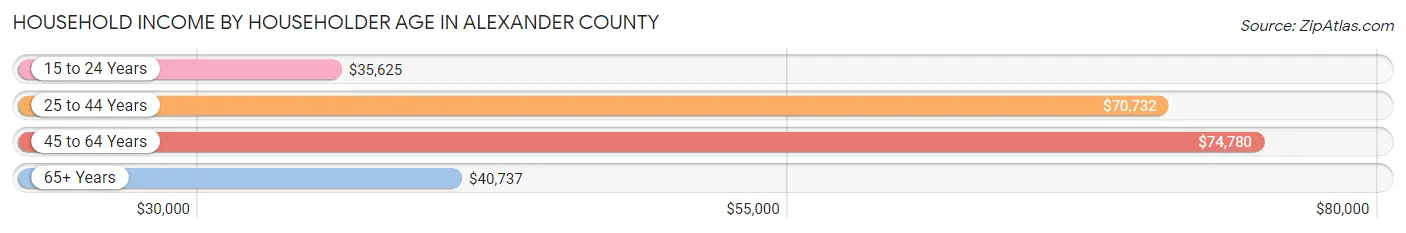
Household Income by Householder Age in Alexander County
The median household income in Alexander County is $62,764, with the highest median household income of $74,780 found in the 45 to 64 years age bracket for the primary householder. A total of 5,362 households (39.0%) fall into this category. Meanwhile, the 15 to 24 years age bracket for the primary householder has the lowest median household income of $35,625, with 263 households (1.9%) in this group.
| Income Bracket | # Households | Median Income |
| 15 to 24 Years | 263 (1.9%) | $35,625 |
| 25 to 44 Years | 3,470 (25.2%) | $70,732 |
| 45 to 64 Years | 5,362 (39.0%) | $74,780 |
| 65+ Years | 4,666 (33.9%) | $40,737 |
| Total | 13,761 (100.0%) | $62,764 |
Poverty in Alexander County
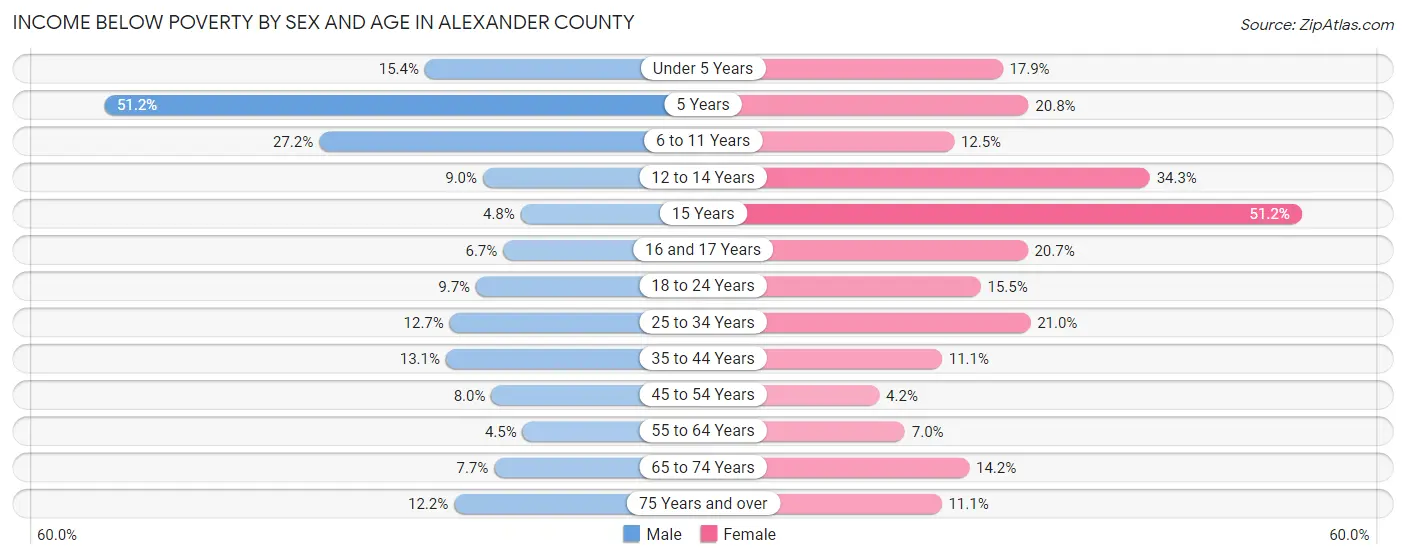
Income Below Poverty by Sex and Age in Alexander County
With 11.2% poverty level for males and 13.3% for females among the residents of Alexander County, 5 year old males and 15 year old females are the most vulnerable to poverty, with 88 males (51.2%) and 106 females (51.2%) in their respective age groups living below the poverty level.
| Age Bracket | Male | Female |
| Under 5 Years | 135 (15.4%) | 141 (17.9%) |
| 5 Years | 88 (51.2%) | 64 (20.8%) |
| 6 to 11 Years | 351 (27.2%) | 126 (12.5%) |
| 12 to 14 Years | 62 (9.0%) | 168 (34.3%) |
| 15 Years | 8 (4.8%) | 106 (51.2%) |
| 16 and 17 Years | 29 (6.7%) | 109 (20.7%) |
| 18 to 24 Years | 160 (9.7%) | 196 (15.4%) |
| 25 to 34 Years | 253 (12.7%) | 404 (21.0%) |
| 35 to 44 Years | 260 (13.1%) | 222 (11.1%) |
| 45 to 54 Years | 198 (8.0%) | 99 (4.2%) |
| 55 to 64 Years | 119 (4.5%) | 179 (7.0%) |
| 65 to 74 Years | 155 (7.7%) | 302 (14.2%) |
| 75 Years and over | 162 (12.2%) | 199 (11.1%) |
| Total | 1,980 (11.2%) | 2,315 (13.3%) |
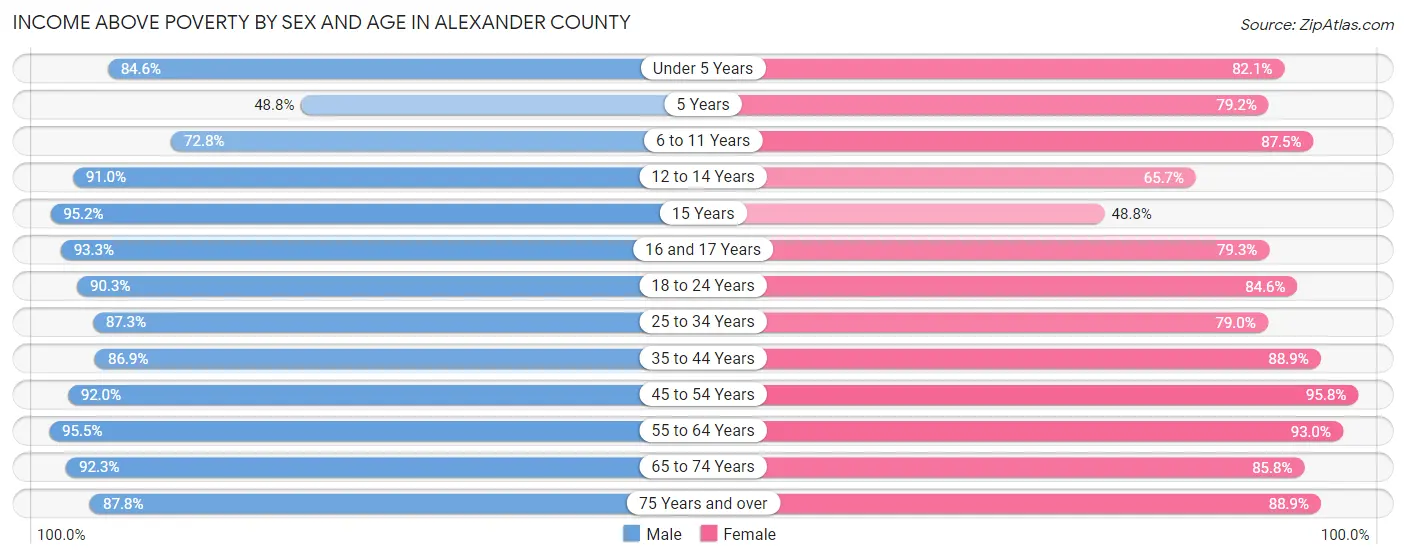
Income Above Poverty by Sex and Age in Alexander County
According to the poverty statistics in Alexander County, males aged 55 to 64 years and females aged 45 to 54 years are the age groups that are most secure financially, with 95.5% of males and 95.8% of females in these age groups living above the poverty line.
| Age Bracket | Male | Female |
| Under 5 Years | 740 (84.6%) | 647 (82.1%) |
| 5 Years | 84 (48.8%) | 244 (79.2%) |
| 6 to 11 Years | 939 (72.8%) | 883 (87.5%) |
| 12 to 14 Years | 630 (91.0%) | 322 (65.7%) |
| 15 Years | 160 (95.2%) | 101 (48.8%) |
| 16 and 17 Years | 403 (93.3%) | 418 (79.3%) |
| 18 to 24 Years | 1,483 (90.3%) | 1,073 (84.6%) |
| 25 to 34 Years | 1,744 (87.3%) | 1,522 (79.0%) |
| 35 to 44 Years | 1,727 (86.9%) | 1,770 (88.9%) |
| 45 to 54 Years | 2,272 (92.0%) | 2,283 (95.8%) |
| 55 to 64 Years | 2,503 (95.5%) | 2,372 (93.0%) |
| 65 to 74 Years | 1,856 (92.3%) | 1,829 (85.8%) |
| 75 Years and over | 1,169 (87.8%) | 1,594 (88.9%) |
| Total | 15,710 (88.8%) | 15,058 (86.7%) |
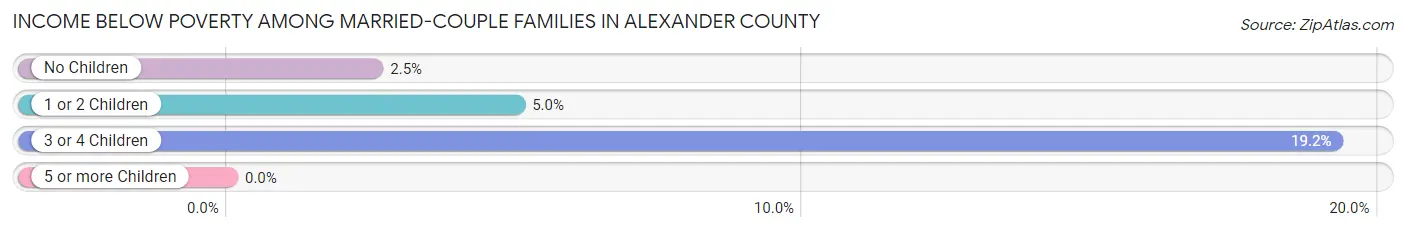
Income Below Poverty Among Married-Couple Families in Alexander County
The poverty statistics for married-couple families in Alexander County show that 4.2% or 327 of the total 7,728 families live below the poverty line. Families with 3 or 4 children have the highest poverty rate of 19.2%, comprising of 81 families. On the other hand, families with no children have the lowest poverty rate of 2.5%, which includes 122 families.
| Children | Above Poverty | Below Poverty |
| No Children | 4,707 (97.5%) | 122 (2.5%) |
| 1 or 2 Children | 2,354 (95.0%) | 124 (5.0%) |
| 3 or 4 Children | 340 (80.8%) | 81 (19.2%) |
| 5 or more Children | 0 (0.0%) | 0 (0.0%) |
| Total | 7,401 (95.8%) | 327 (4.2%) |
Income Below Poverty Among Single-Parent Households in Alexander County
According to the poverty data in Alexander County, 8.5% or 49 single-father households and 28.6% or 410 single-mother households are living below the poverty line. Among single-father households, those with 1 or 2 children have the highest poverty rate, with 49 households (11.5%) experiencing poverty. Likewise, among single-mother households, those with 5 or more children have the highest poverty rate, with 56 households (100.0%) falling below the poverty line.
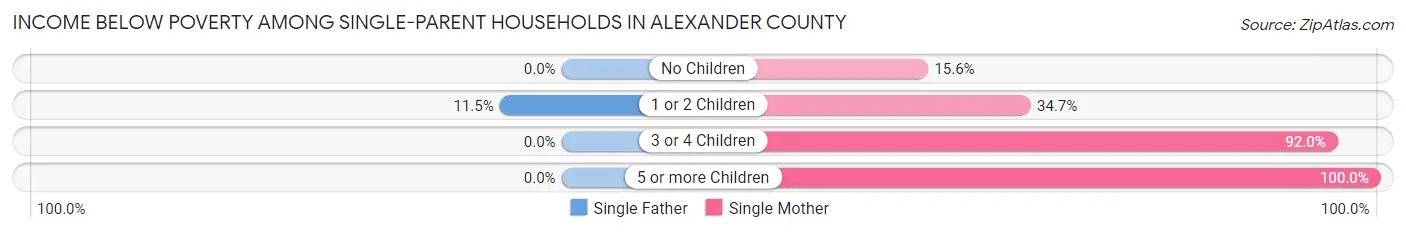
| Children | Single Father | Single Mother |
| No Children | 0 (0.0%) | 136 (15.6%) |
| 1 or 2 Children | 49 (11.5%) | 149 (34.7%) |
| 3 or 4 Children | 0 (0.0%) | 69 (92.0%) |
| 5 or more Children | 0 (0.0%) | 56 (100.0%) |
| Total | 49 (8.5%) | 410 (28.6%) |
Income Below Poverty Among Married-Couple vs Single-Parent Households in Alexander County
The poverty data for Alexander County shows that 327 of the married-couple family households (4.2%) and 459 of the single-parent households (22.9%) are living below the poverty level. Within the married-couple family households, those with 3 or 4 children have the highest poverty rate, with 81 households (19.2%) falling below the poverty line. Among the single-parent households, those with 5 or more children have the highest poverty rate, with 56 household (100.0%) living below poverty.
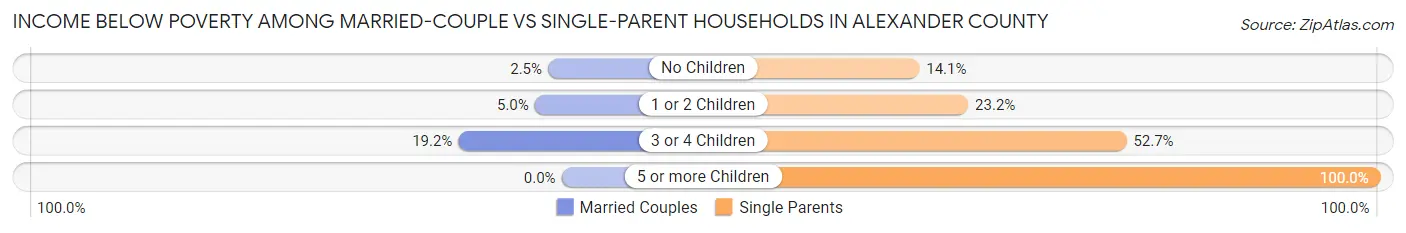
| Children | Married-Couple Families | Single-Parent Households |
| No Children | 122 (2.5%) | 136 (14.1%) |
| 1 or 2 Children | 124 (5.0%) | 198 (23.2%) |
| 3 or 4 Children | 81 (19.2%) | 69 (52.7%) |
| 5 or more Children | 0 (0.0%) | 56 (100.0%) |
| Total | 327 (4.2%) | 459 (22.9%) |
Race in Alexander County
The most populous races in Alexander County are White / Caucasian (32,093 | 87.9%), Hispanic or Latino (1,872 | 5.1%), and Black / African American (1,597 | 4.4%).
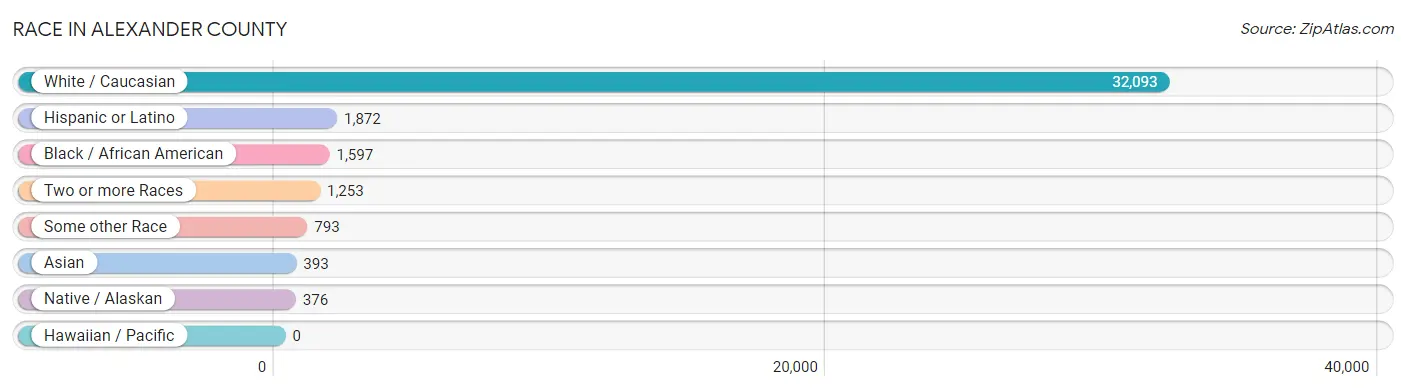
| Race | # Population | % Population |
| Asian | 393 | 1.1% |
| Black / African American | 1,597 | 4.4% |
| Hawaiian / Pacific | 0 | 0.0% |
| Hispanic or Latino | 1,872 | 5.1% |
| Native / Alaskan | 376 | 1.0% |
| White / Caucasian | 32,093 | 87.9% |
| Two or more Races | 1,253 | 3.4% |
| Some other Race | 793 | 2.2% |
| Total | 36,505 | 100.0% |
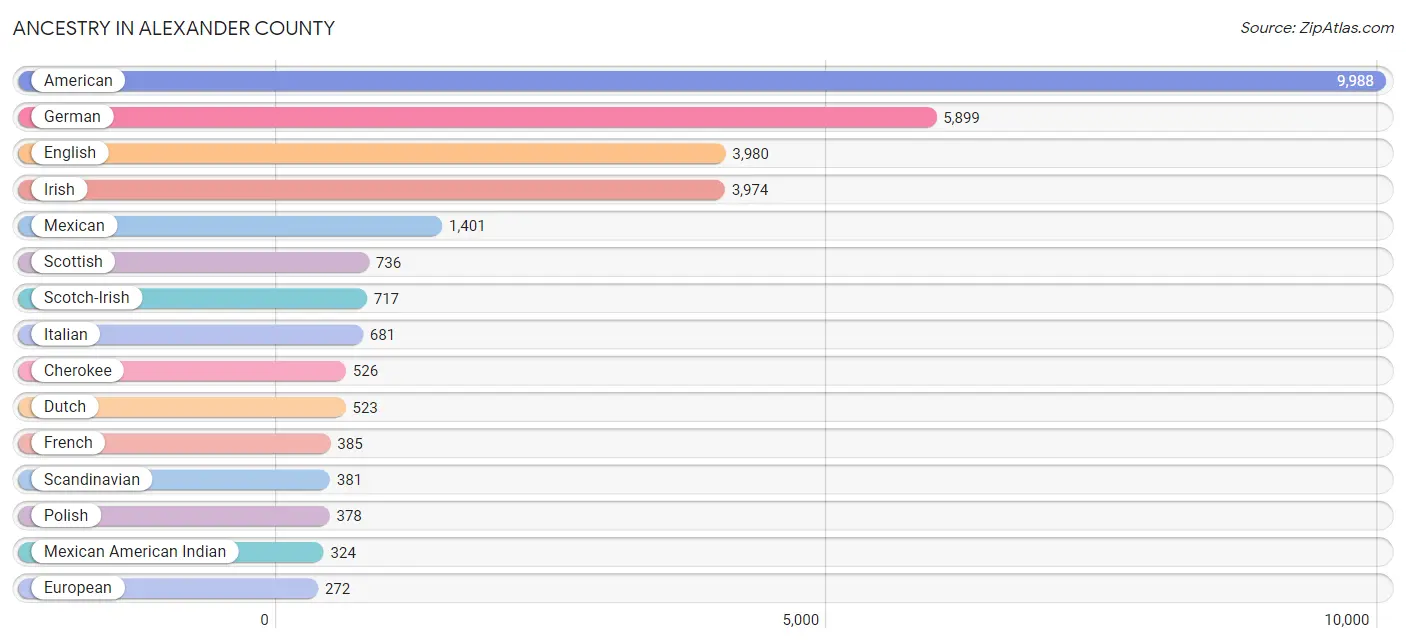
Ancestry in Alexander County
The most populous ancestries reported in Alexander County are American (9,988 | 27.4%), German (5,899 | 16.2%), English (3,980 | 10.9%), Irish (3,974 | 10.9%), and Mexican (1,401 | 3.8%), together accounting for 69.2% of all Alexander County residents.
| Ancestry | # Population | % Population |
| African | 13 | 0.0% |
| American | 9,988 | 27.4% |
| Arab | 4 | 0.0% |
| Armenian | 6 | 0.0% |
| Australian | 88 | 0.2% |
| Austrian | 26 | 0.1% |
| Bangladeshi | 160 | 0.4% |
| Bhutanese | 65 | 0.2% |
| Blackfeet | 11 | 0.0% |
| British | 122 | 0.3% |
| Burmese | 13 | 0.0% |
| Canadian | 20 | 0.1% |
| Central American | 41 | 0.1% |
| Cherokee | 526 | 1.4% |
| Chinese | 15 | 0.0% |
| Colombian | 92 | 0.3% |
| Croatian | 15 | 0.0% |
| Czech | 23 | 0.1% |
| Czechoslovakian | 13 | 0.0% |
| Dutch | 523 | 1.4% |
| Eastern European | 5 | 0.0% |
| English | 3,980 | 10.9% |
| European | 272 | 0.7% |
| French | 385 | 1.1% |
| French Canadian | 21 | 0.1% |
| German | 5,899 | 16.2% |
| Greek | 22 | 0.1% |
| Honduran | 41 | 0.1% |
| Hungarian | 14 | 0.0% |
| Indian (Asian) | 161 | 0.4% |
| Iranian | 57 | 0.2% |
| Irish | 3,974 | 10.9% |
| Iroquois | 18 | 0.1% |
| Italian | 681 | 1.9% |
| Korean | 5 | 0.0% |
| Latvian | 25 | 0.1% |
| Lumbee | 37 | 0.1% |
| Mexican | 1,401 | 3.8% |
| Mexican American Indian | 324 | 0.9% |
| Northern European | 26 | 0.1% |
| Norwegian | 119 | 0.3% |
| Pennsylvania German | 32 | 0.1% |
| Polish | 378 | 1.0% |
| Portuguese | 66 | 0.2% |
| Puerto Rican | 99 | 0.3% |
| Russian | 16 | 0.0% |
| Scandinavian | 381 | 1.0% |
| Scotch-Irish | 717 | 2.0% |
| Scottish | 736 | 2.0% |
| Sioux | 25 | 0.1% |
| Slovak | 19 | 0.1% |
| South American | 92 | 0.3% |
| Spaniard | 128 | 0.4% |
| Spanish | 27 | 0.1% |
| Subsaharan African | 13 | 0.0% |
| Swedish | 81 | 0.2% |
| Swiss | 76 | 0.2% |
| Thai | 54 | 0.2% |
| Welsh | 117 | 0.3% |
| West Indian | 6 | 0.0% | View All 60 Rows |
Immigrants in Alexander County
The most numerous immigrant groups reported in Alexander County came from Latin America (595 | 1.6%), Central America (538 | 1.5%), Mexico (475 | 1.3%), Asia (210 | 0.6%), and Europe (119 | 0.3%), together accounting for 5.3% of all Alexander County residents.
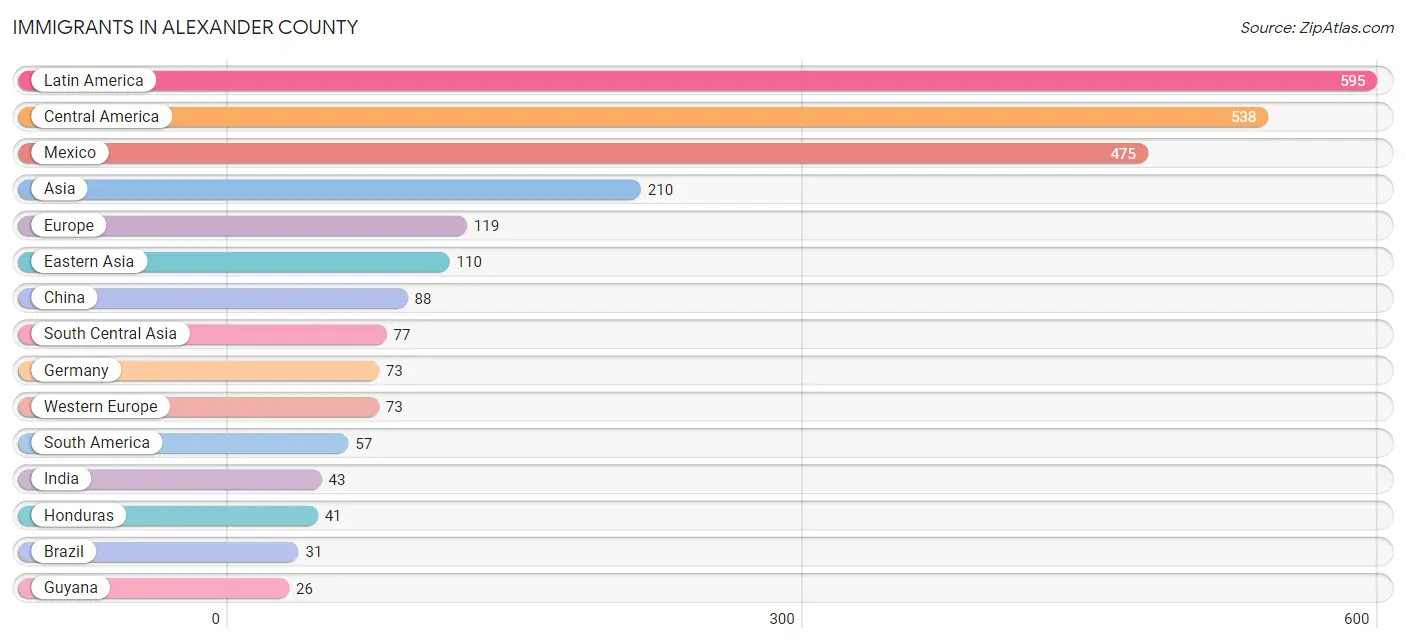
| Immigration Origin | # Population | % Population |
| Asia | 210 | 0.6% |
| Brazil | 31 | 0.1% |
| Canada | 3 | 0.0% |
| Central America | 538 | 1.5% |
| China | 88 | 0.2% |
| Eastern Asia | 110 | 0.3% |
| Eastern Europe | 25 | 0.1% |
| El Salvador | 22 | 0.1% |
| Europe | 119 | 0.3% |
| Germany | 73 | 0.2% |
| Guyana | 26 | 0.1% |
| Honduras | 41 | 0.1% |
| India | 43 | 0.1% |
| Iran | 23 | 0.1% |
| Italy | 6 | 0.0% |
| Japan | 9 | 0.0% |
| Korea | 13 | 0.0% |
| Latin America | 595 | 1.6% |
| Latvia | 25 | 0.1% |
| Mexico | 475 | 1.3% |
| Northern Europe | 15 | 0.0% |
| Pakistan | 11 | 0.0% |
| Philippines | 5 | 0.0% |
| South America | 57 | 0.2% |
| South Central Asia | 77 | 0.2% |
| South Eastern Asia | 23 | 0.1% |
| Southern Europe | 6 | 0.0% |
| Vietnam | 18 | 0.1% |
| Western Europe | 73 | 0.2% | View All 29 Rows |
Sex and Age in Alexander County
Sex and Age in Alexander County
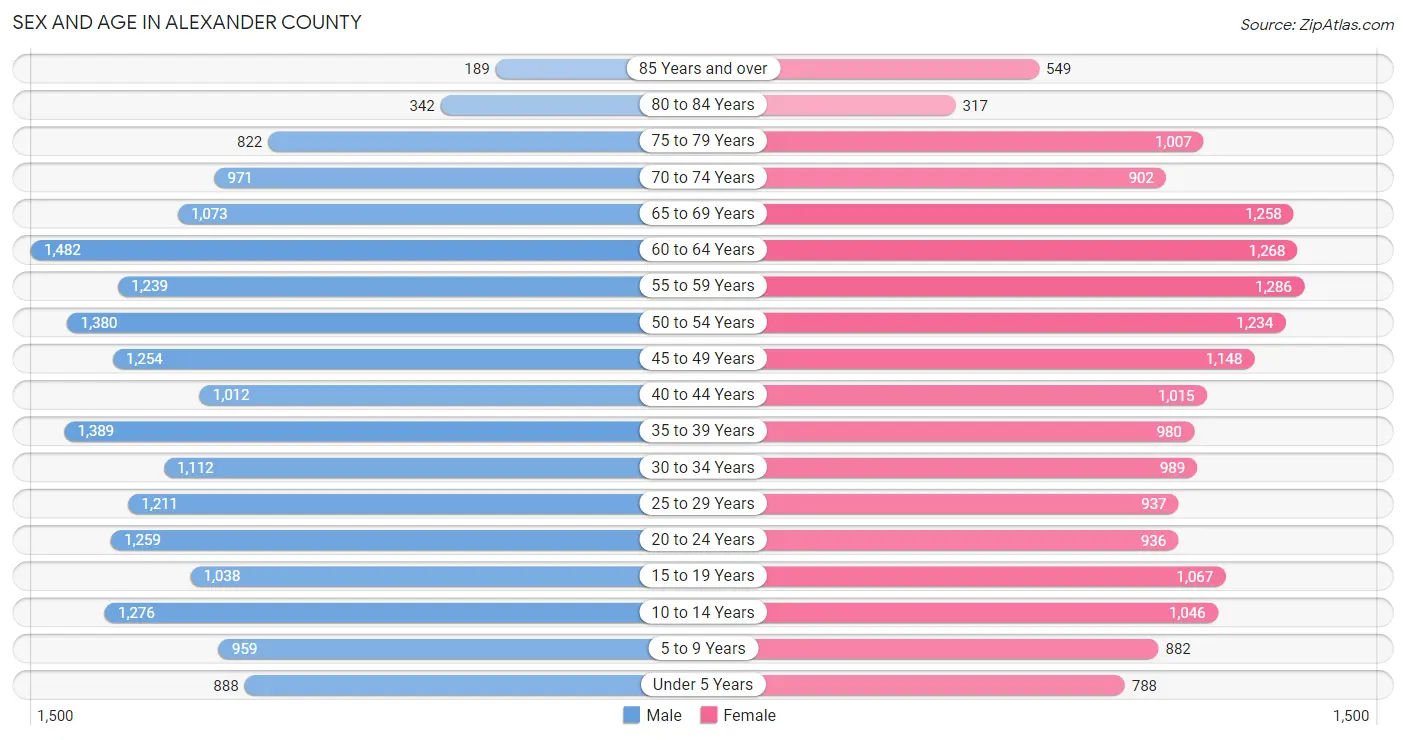
The most populous age groups in Alexander County are 60 to 64 Years (1,482 | 7.8%) for men and 55 to 59 Years (1,286 | 7.3%) for women.
| Age Bracket | Male | Female |
| Under 5 Years | 888 (4.7%) | 788 (4.5%) |
| 5 to 9 Years | 959 (5.1%) | 882 (5.0%) |
| 10 to 14 Years | 1,276 (6.8%) | 1,046 (5.9%) |
| 15 to 19 Years | 1,038 (5.5%) | 1,067 (6.1%) |
| 20 to 24 Years | 1,259 (6.7%) | 936 (5.3%) |
| 25 to 29 Years | 1,211 (6.4%) | 937 (5.3%) |
| 30 to 34 Years | 1,112 (5.9%) | 989 (5.6%) |
| 35 to 39 Years | 1,389 (7.3%) | 980 (5.6%) |
| 40 to 44 Years | 1,012 (5.4%) | 1,015 (5.8%) |
| 45 to 49 Years | 1,254 (6.6%) | 1,148 (6.5%) |
| 50 to 54 Years | 1,380 (7.3%) | 1,234 (7.0%) |
| 55 to 59 Years | 1,239 (6.6%) | 1,286 (7.3%) |
| 60 to 64 Years | 1,482 (7.8%) | 1,268 (7.2%) |
| 65 to 69 Years | 1,073 (5.7%) | 1,258 (7.1%) |
| 70 to 74 Years | 971 (5.1%) | 902 (5.1%) |
| 75 to 79 Years | 822 (4.3%) | 1,007 (5.7%) |
| 80 to 84 Years | 342 (1.8%) | 317 (1.8%) |
| 85 Years and over | 189 (1.0%) | 549 (3.1%) |
| Total | 18,896 (100.0%) | 17,609 (100.0%) |
Families and Households in Alexander County
Median Family Size in Alexander County
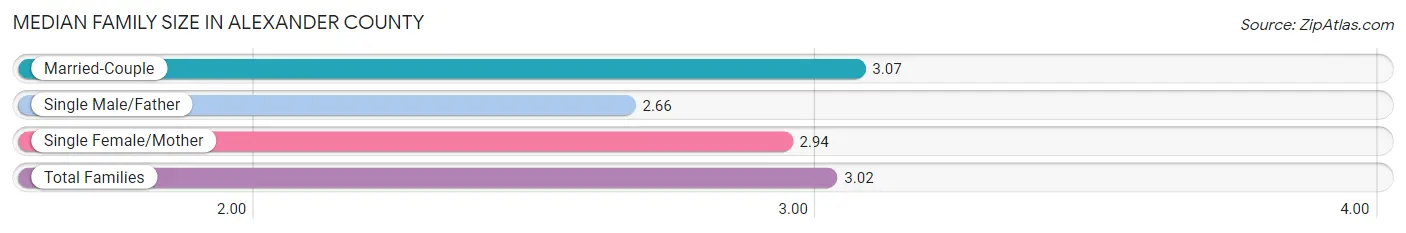
The median family size in Alexander County is 3.02 persons per family, with married-couple families (7,728 | 79.4%) accounting for the largest median family size of 3.07 persons per family. On the other hand, single male/father families (574 | 5.9%) represent the smallest median family size with 2.66 persons per family.
| Family Type | # Families | Family Size |
| Married-Couple | 7,728 (79.4%) | 3.07 |
| Single Male/Father | 574 (5.9%) | 2.66 |
| Single Female/Mother | 1,432 (14.7%) | 2.94 |
| Total Families | 9,734 (100.0%) | 3.02 |
Median Household Size in Alexander County
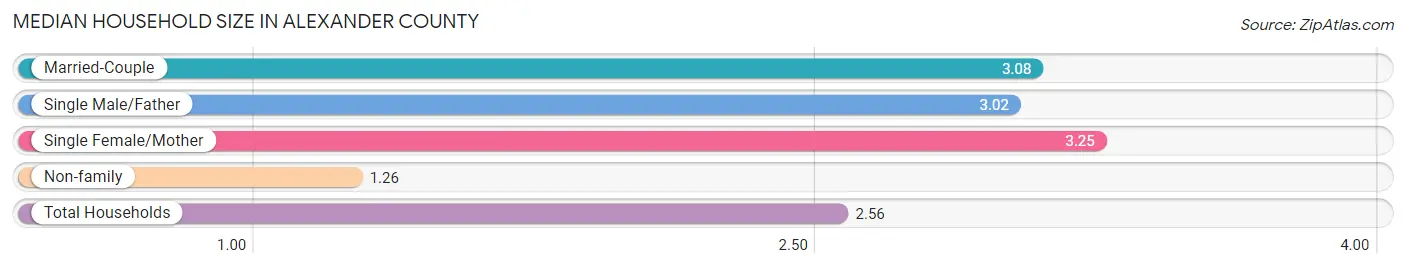
The median household size in Alexander County is 2.56 persons per household, with single female/mother households (1,432 | 10.4%) accounting for the largest median household size of 3.25 persons per household. non-family households (4,027 | 29.3%) represent the smallest median household size with 1.26 persons per household.
| Household Type | # Households | Household Size |
| Married-Couple | 7,728 (56.2%) | 3.08 |
| Single Male/Father | 574 (4.2%) | 3.02 |
| Single Female/Mother | 1,432 (10.4%) | 3.25 |
| Non-family | 4,027 (29.3%) | 1.26 |
| Total Households | 13,761 (100.0%) | 2.56 |
Household Size by Marriage Status in Alexander County
Out of a total of 13,761 households in Alexander County, 9,734 (70.7%) are family households, while 4,027 (29.3%) are nonfamily households. The most numerous type of family households are 2-person households, comprising 4,493, and the most common type of nonfamily households are 1-person households, comprising 3,387.
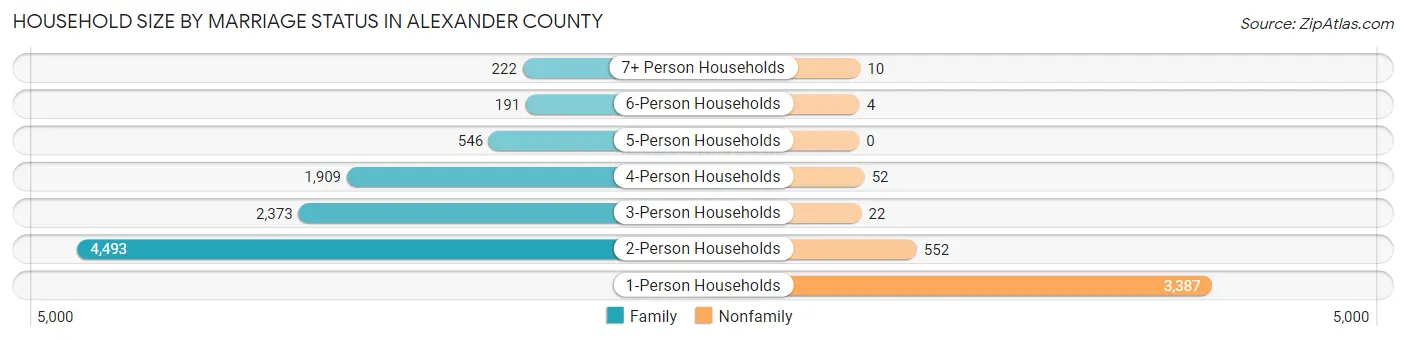
| Household Size | Family Households | Nonfamily Households |
| 1-Person Households | - | 3,387 (24.6%) |
| 2-Person Households | 4,493 (32.7%) | 552 (4.0%) |
| 3-Person Households | 2,373 (17.2%) | 22 (0.2%) |
| 4-Person Households | 1,909 (13.9%) | 52 (0.4%) |
| 5-Person Households | 546 (4.0%) | 0 (0.0%) |
| 6-Person Households | 191 (1.4%) | 4 (0.0%) |
| 7+ Person Households | 222 (1.6%) | 10 (0.1%) |
| Total | 9,734 (70.7%) | 4,027 (29.3%) |
Female Fertility in Alexander County
Fertility by Age in Alexander County
Average fertility rate in Alexander County is 40.0 births per 1,000 women. Women in the age bracket of 20 to 34 years have the highest fertility rate with 61.0 births per 1,000 women. Women in the age bracket of 20 to 34 years acount for 58.4% of all women with births.
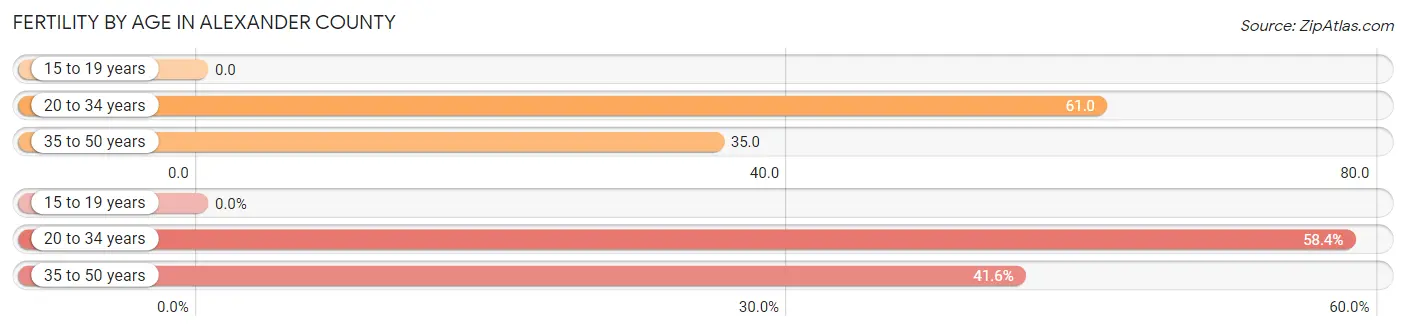
| Age Bracket | Women with Births | Births / 1,000 Women |
| 15 to 19 years | 0 (0.0%) | 0.0 |
| 20 to 34 years | 174 (58.4%) | 61.0 |
| 35 to 50 years | 124 (41.6%) | 35.0 |
| Total | 298 (100.0%) | 40.0 |
Fertility by Age by Marriage Status in Alexander County
90.3% of women with births (298) in Alexander County are married. The highest percentage of unmarried women with births falls into 20 to 34 years age bracket with 16.7% of them unmarried at the time of birth, while the lowest percentage of unmarried women with births belong to 35 to 50 years age bracket with 0.0% of them unmarried.
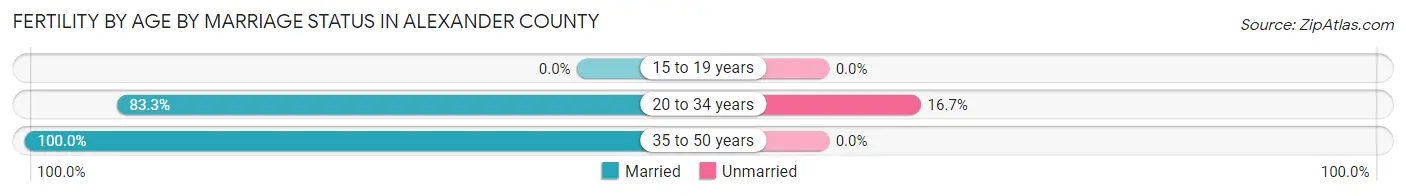
| Age Bracket | Married | Unmarried |
| 15 to 19 years | 0 (0.0%) | 0 (0.0%) |
| 20 to 34 years | 145 (83.3%) | 29 (16.7%) |
| 35 to 50 years | 124 (100.0%) | 0 (0.0%) |
| Total | 269 (90.3%) | 29 (9.7%) |
Fertility by Education in Alexander County
Average fertility rate in Alexander County is 40.0 births per 1,000 women. Women with the education attainment of graduate degree have the highest fertility rate of 52.0 births per 1,000 women, while women with the education attainment of bachelor's degree have the lowest fertility at 10.0 births per 1,000 women. Women with the education attainment of college or associate's degree represent 49.3% of all women with births.
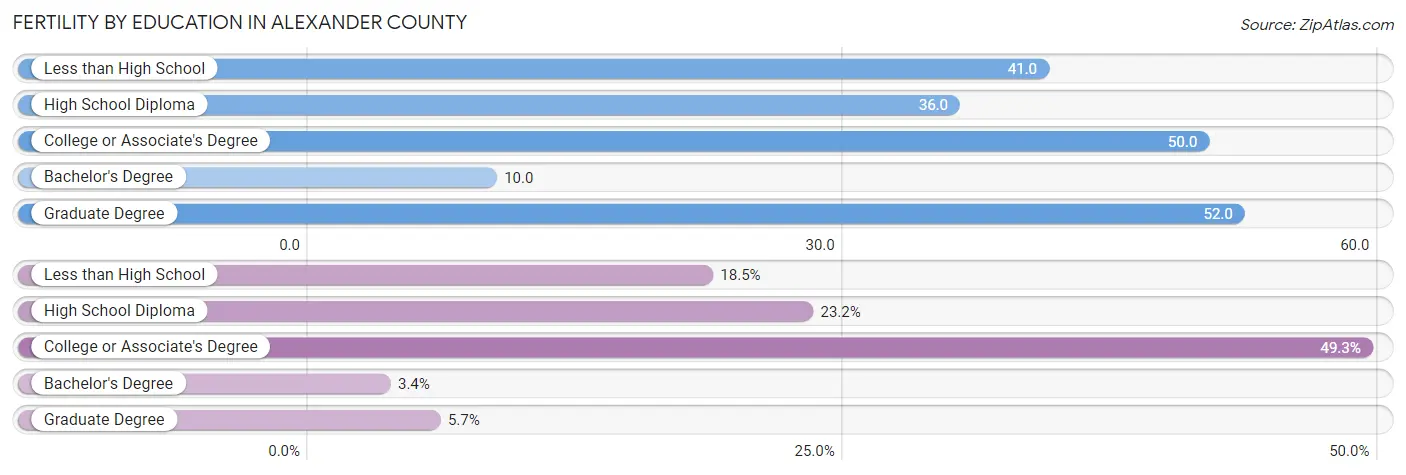
| Educational Attainment | Women with Births | Births / 1,000 Women |
| Less than High School | 55 (18.5%) | 41.0 |
| High School Diploma | 69 (23.2%) | 36.0 |
| College or Associate's Degree | 147 (49.3%) | 50.0 |
| Bachelor's Degree | 10 (3.4%) | 10.0 |
| Graduate Degree | 17 (5.7%) | 52.0 |
| Total | 298 (100.0%) | 40.0 |
Fertility by Education by Marriage Status in Alexander County
9.7% of women with births in Alexander County are unmarried. Women with the educational attainment of college or associate's degree are most likely to be married with 100.0% of them married at childbirth, while women with the educational attainment of less than high school are least likely to be married with 29.1% of them unmarried at childbirth.
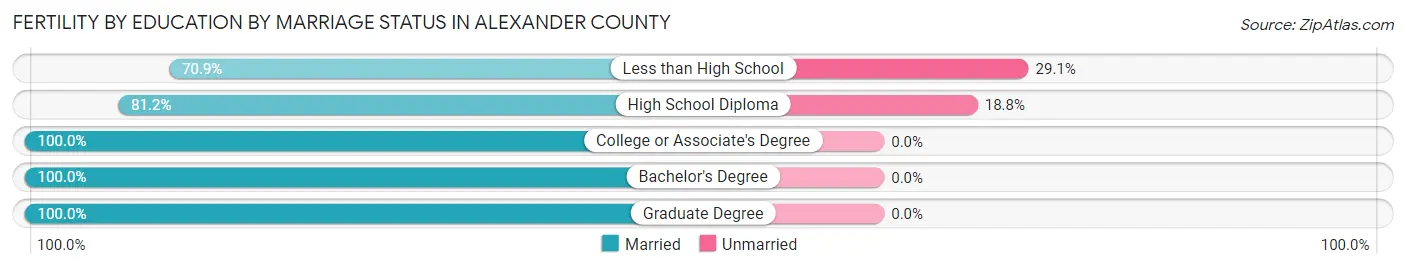
| Educational Attainment | Married | Unmarried |
| Less than High School | 39 (70.9%) | 16 (29.1%) |
| High School Diploma | 56 (81.2%) | 13 (18.8%) |
| College or Associate's Degree | 147 (100.0%) | 0 (0.0%) |
| Bachelor's Degree | 10 (100.0%) | 0 (0.0%) |
| Graduate Degree | 17 (100.0%) | 0 (0.0%) |
| Total | 269 (90.3%) | 29 (9.7%) |
Employment Characteristics in Alexander County
Employment by Class of Employer in Alexander County
Among the 15,849 employed individuals in Alexander County, private company employees (10,941 | 69.0%), local government employees (1,489 | 9.4%), and self-employed (not incorporated) (1,107 | 7.0%) make up the most common classes of employment.
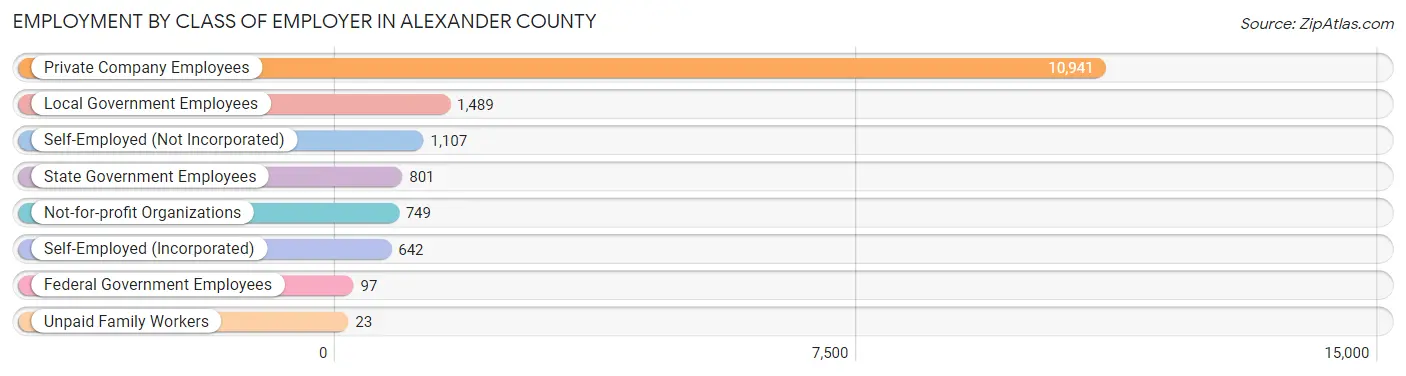
| Employer Class | # Employees | % Employees |
| Private Company Employees | 10,941 | 69.0% |
| Self-Employed (Incorporated) | 642 | 4.1% |
| Self-Employed (Not Incorporated) | 1,107 | 7.0% |
| Not-for-profit Organizations | 749 | 4.7% |
| Local Government Employees | 1,489 | 9.4% |
| State Government Employees | 801 | 5.1% |
| Federal Government Employees | 97 | 0.6% |
| Unpaid Family Workers | 23 | 0.2% |
| Total | 15,849 | 100.0% |
Employment Status by Age in Alexander County
According to the labor force statistics for Alexander County, out of the total population over 16 years of age (30,289), 58.1% or 17,598 individuals are in the labor force, with 5.6% or 985 of them unemployed. The age group with the highest labor force participation rate is 30 to 34 years, with 86.5% or 1,817 individuals in the labor force. Within the labor force, the 16 to 19 years age range has the highest percentage of unemployed individuals, with 19.6% or 153 of them being unemployed.
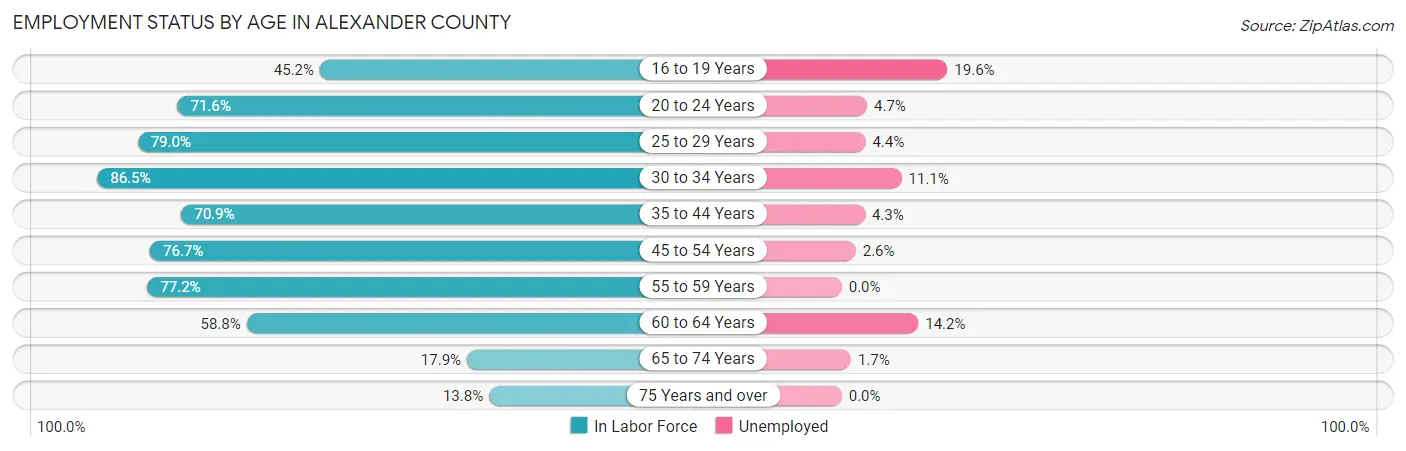
| Age Bracket | In Labor Force | Unemployed |
| 16 to 19 Years | 781 (45.2%) | 153 (19.6%) |
| 20 to 24 Years | 1,572 (71.6%) | 74 (4.7%) |
| 25 to 29 Years | 1,697 (79.0%) | 75 (4.4%) |
| 30 to 34 Years | 1,817 (86.5%) | 202 (11.1%) |
| 35 to 44 Years | 3,117 (70.9%) | 134 (4.3%) |
| 45 to 54 Years | 3,847 (76.7%) | 100 (2.6%) |
| 55 to 59 Years | 1,949 (77.2%) | 0 (0.0%) |
| 60 to 64 Years | 1,617 (58.8%) | 230 (14.2%) |
| 65 to 74 Years | 753 (17.9%) | 13 (1.7%) |
| 75 Years and over | 445 (13.8%) | 0 (0.0%) |
| Total | 17,598 (58.1%) | 985 (5.6%) |
Employment Status by Educational Attainment in Alexander County
According to labor force statistics for Alexander County, 74.1% of individuals (14,032) out of the total population between 25 and 64 years of age (18,936) are in the labor force, with 5.3% or 744 of them being unemployed. The group with the highest labor force participation rate are those with the educational attainment of bachelor's degree or higher, with 83.5% or 2,605 individuals in the labor force. Within the labor force, individuals with high school diploma education have the highest percentage of unemployment, with 10.5% or 545 of them being unemployed.
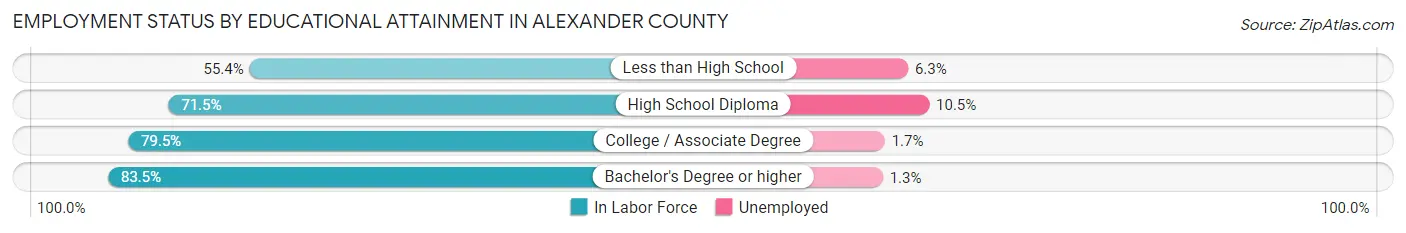
| Educational Attainment | In Labor Force | Unemployed |
| Less than High School | 1,284 (55.4%) | 146 (6.3%) |
| High School Diploma | 5,186 (71.5%) | 762 (10.5%) |
| College / Associate Degree | 4,965 (79.5%) | 106 (1.7%) |
| Bachelor's Degree or higher | 2,605 (83.5%) | 41 (1.3%) |
| Total | 14,032 (74.1%) | 1,004 (5.3%) |
Employment Occupations by Sex in Alexander County
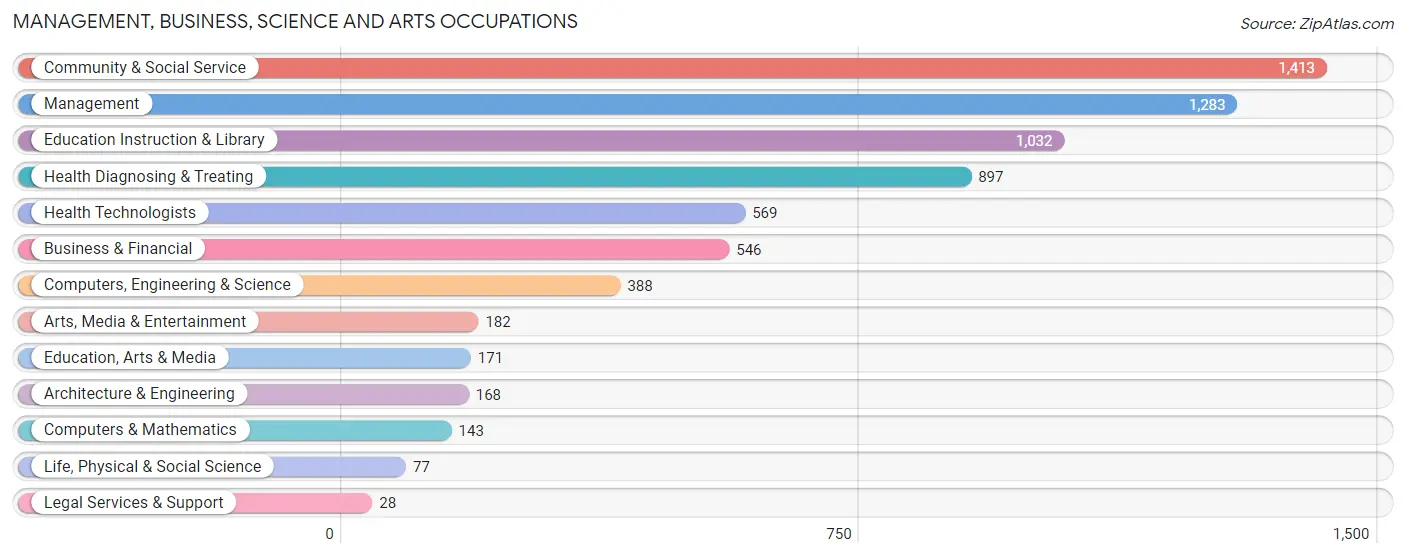
Management, Business, Science and Arts Occupations
The most common Management, Business, Science and Arts occupations in Alexander County are Community & Social Service (1,413 | 8.5%), Management (1,283 | 7.7%), Education Instruction & Library (1,032 | 6.2%), Health Diagnosing & Treating (897 | 5.4%), and Health Technologists (569 | 3.4%).
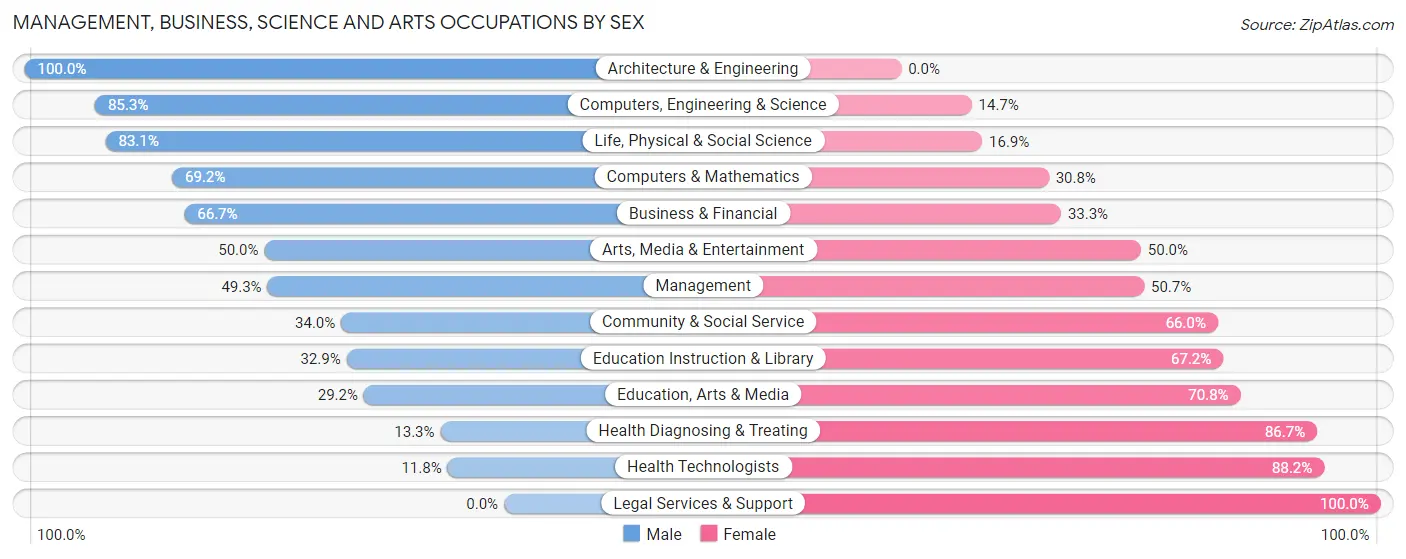
Management, Business, Science and Arts Occupations by Sex
Within the Management, Business, Science and Arts occupations in Alexander County, the most male-oriented occupations are Architecture & Engineering (100.0%), Computers, Engineering & Science (85.3%), and Life, Physical & Social Science (83.1%), while the most female-oriented occupations are Legal Services & Support (100.0%), Health Technologists (88.2%), and Health Diagnosing & Treating (86.7%).
| Occupation | Male | Female |
| Management | 633 (49.3%) | 650 (50.7%) |
| Business & Financial | 364 (66.7%) | 182 (33.3%) |
| Computers, Engineering & Science | 331 (85.3%) | 57 (14.7%) |
| Computers & Mathematics | 99 (69.2%) | 44 (30.8%) |
| Architecture & Engineering | 168 (100.0%) | 0 (0.0%) |
| Life, Physical & Social Science | 64 (83.1%) | 13 (16.9%) |
| Community & Social Service | 480 (34.0%) | 933 (66.0%) |
| Education, Arts & Media | 50 (29.2%) | 121 (70.8%) |
| Legal Services & Support | 0 (0.0%) | 28 (100.0%) |
| Education Instruction & Library | 339 (32.9%) | 693 (67.1%) |
| Arts, Media & Entertainment | 91 (50.0%) | 91 (50.0%) |
| Health Diagnosing & Treating | 119 (13.3%) | 778 (86.7%) |
| Health Technologists | 67 (11.8%) | 502 (88.2%) |
| Total (Category) | 1,927 (42.6%) | 2,600 (57.4%) |
| Total (Overall) | 9,066 (54.6%) | 7,541 (45.4%) |
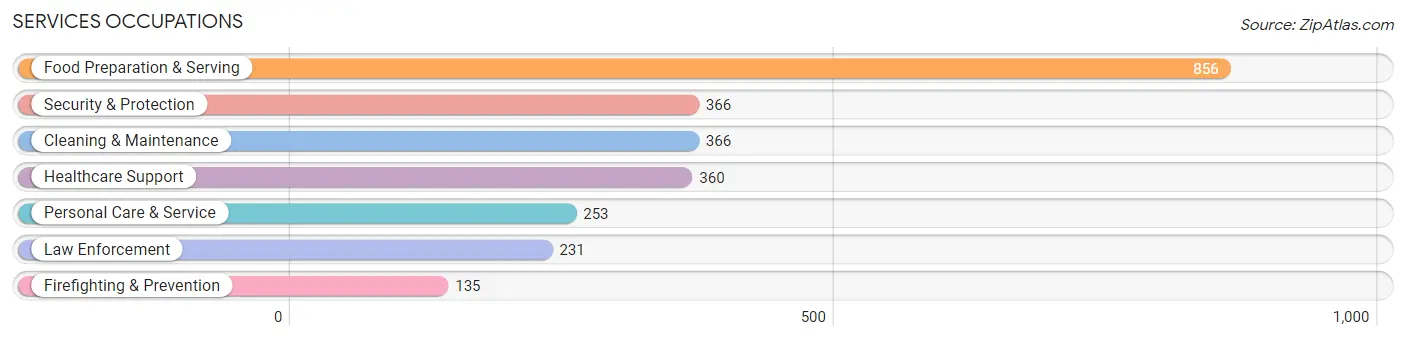
Services Occupations
The most common Services occupations in Alexander County are Food Preparation & Serving (856 | 5.1%), Security & Protection (366 | 2.2%), Cleaning & Maintenance (366 | 2.2%), Healthcare Support (360 | 2.2%), and Personal Care & Service (253 | 1.5%).
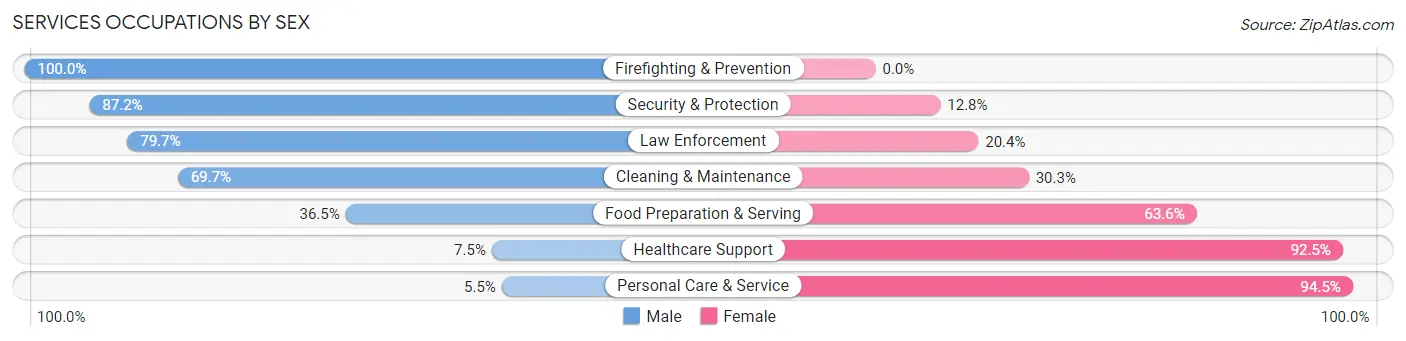
Services Occupations by Sex
Within the Services occupations in Alexander County, the most male-oriented occupations are Firefighting & Prevention (100.0%), Security & Protection (87.2%), and Law Enforcement (79.6%), while the most female-oriented occupations are Personal Care & Service (94.5%), Healthcare Support (92.5%), and Food Preparation & Serving (63.5%).
| Occupation | Male | Female |
| Healthcare Support | 27 (7.5%) | 333 (92.5%) |
| Security & Protection | 319 (87.2%) | 47 (12.8%) |
| Firefighting & Prevention | 135 (100.0%) | 0 (0.0%) |
| Law Enforcement | 184 (79.6%) | 47 (20.3%) |
| Food Preparation & Serving | 312 (36.4%) | 544 (63.5%) |
| Cleaning & Maintenance | 255 (69.7%) | 111 (30.3%) |
| Personal Care & Service | 14 (5.5%) | 239 (94.5%) |
| Total (Category) | 927 (42.1%) | 1,274 (57.9%) |
| Total (Overall) | 9,066 (54.6%) | 7,541 (45.4%) |
Sales and Office Occupations
The most common Sales and Office occupations in Alexander County are Office & Administration (1,713 | 10.3%), and Sales & Related (1,321 | 8.0%).
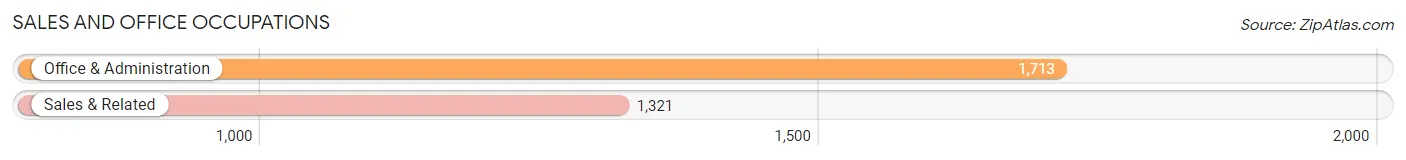
Sales and Office Occupations by Sex

| Occupation | Male | Female |
| Sales & Related | 546 (41.3%) | 775 (58.7%) |
| Office & Administration | 238 (13.9%) | 1,475 (86.1%) |
| Total (Category) | 784 (25.8%) | 2,250 (74.2%) |
| Total (Overall) | 9,066 (54.6%) | 7,541 (45.4%) |
Natural Resources, Construction and Maintenance Occupations
The most common Natural Resources, Construction and Maintenance occupations in Alexander County are Installation, Maintenance & Repair (942 | 5.7%), Construction & Extraction (809 | 4.9%), and Farming, Fishing & Forestry (21 | 0.1%).
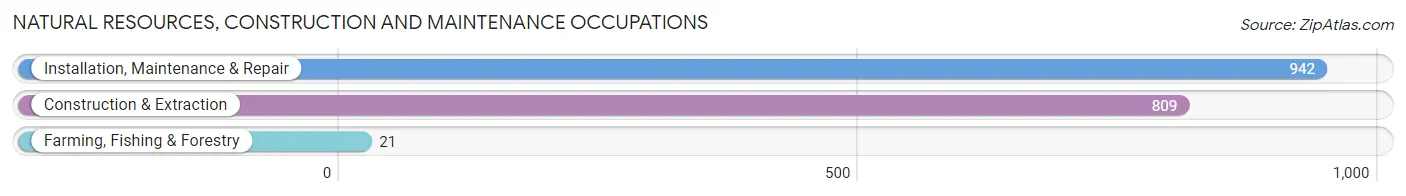
Natural Resources, Construction and Maintenance Occupations by Sex
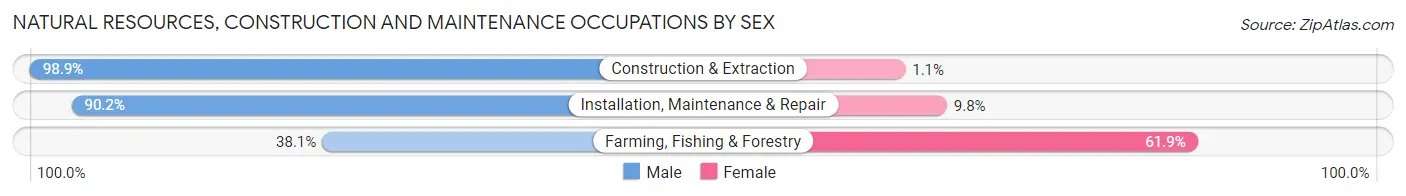
| Occupation | Male | Female |
| Farming, Fishing & Forestry | 8 (38.1%) | 13 (61.9%) |
| Construction & Extraction | 800 (98.9%) | 9 (1.1%) |
| Installation, Maintenance & Repair | 850 (90.2%) | 92 (9.8%) |
| Total (Category) | 1,658 (93.6%) | 114 (6.4%) |
| Total (Overall) | 9,066 (54.6%) | 7,541 (45.4%) |
Production, Transportation and Moving Occupations
The most common Production, Transportation and Moving occupations in Alexander County are Production (3,448 | 20.8%), Transportation (1,025 | 6.2%), and Material Moving (600 | 3.6%).
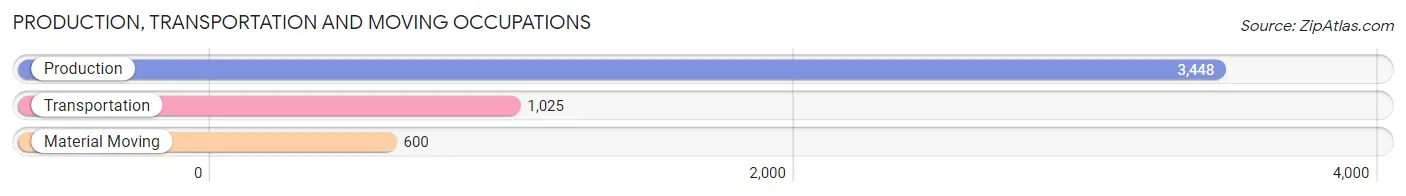
Production, Transportation and Moving Occupations by Sex
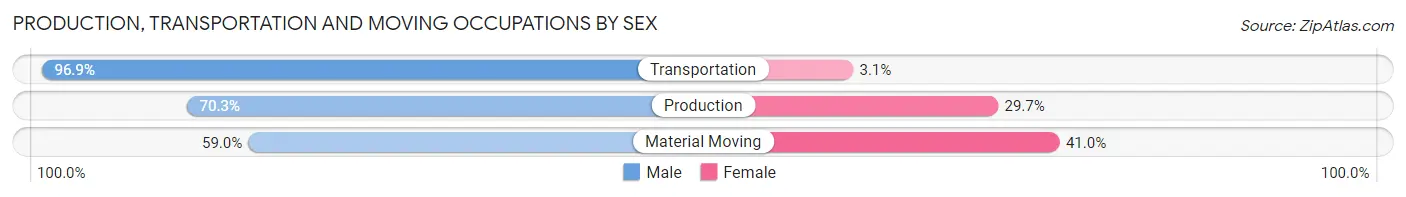
| Occupation | Male | Female |
| Production | 2,423 (70.3%) | 1,025 (29.7%) |
| Transportation | 993 (96.9%) | 32 (3.1%) |
| Material Moving | 354 (59.0%) | 246 (41.0%) |
| Total (Category) | 3,770 (74.3%) | 1,303 (25.7%) |
| Total (Overall) | 9,066 (54.6%) | 7,541 (45.4%) |
Employment Industries by Sex in Alexander County
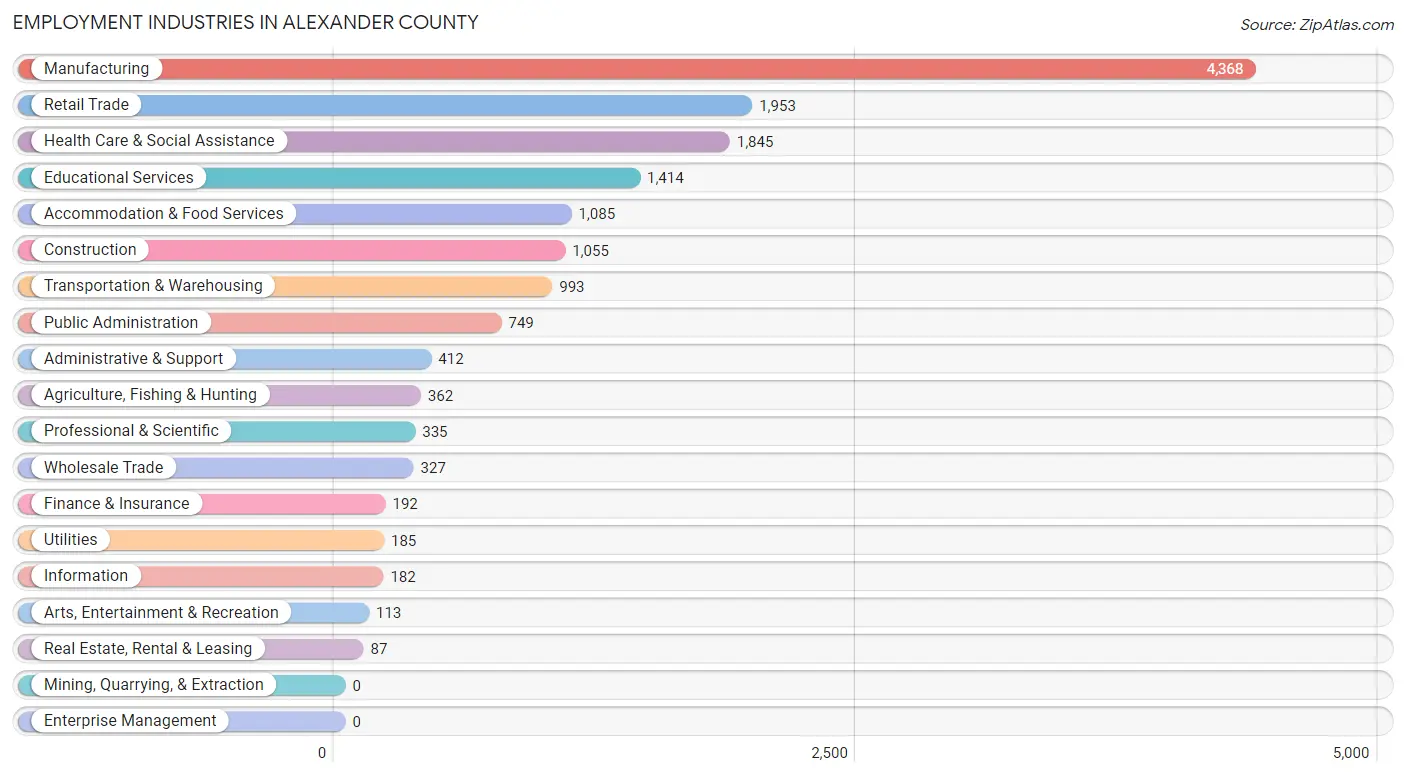
Employment Industries in Alexander County
The major employment industries in Alexander County include Manufacturing (4,368 | 26.3%), Retail Trade (1,953 | 11.8%), Health Care & Social Assistance (1,845 | 11.1%), Educational Services (1,414 | 8.5%), and Accommodation & Food Services (1,085 | 6.5%).
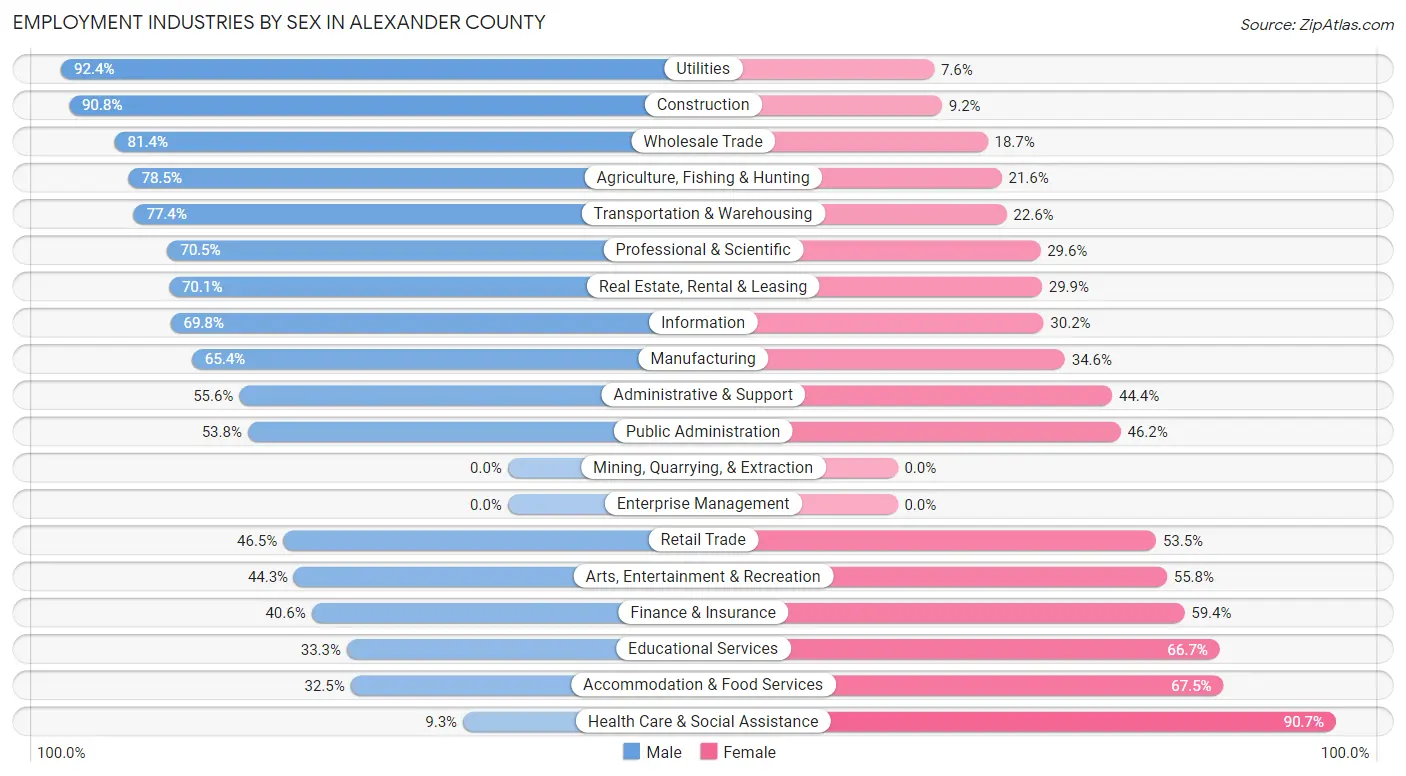
Employment Industries by Sex in Alexander County
The Alexander County industries that see more men than women are Utilities (92.4%), Construction (90.8%), and Wholesale Trade (81.4%), whereas the industries that tend to have a higher number of women are Health Care & Social Assistance (90.7%), Accommodation & Food Services (67.5%), and Educational Services (66.7%).
| Industry | Male | Female |
| Agriculture, Fishing & Hunting | 284 (78.4%) | 78 (21.5%) |
| Mining, Quarrying, & Extraction | 0 (0.0%) | 0 (0.0%) |
| Construction | 958 (90.8%) | 97 (9.2%) |
| Manufacturing | 2,855 (65.4%) | 1,513 (34.6%) |
| Wholesale Trade | 266 (81.4%) | 61 (18.6%) |
| Retail Trade | 908 (46.5%) | 1,045 (53.5%) |
| Transportation & Warehousing | 769 (77.4%) | 224 (22.6%) |
| Utilities | 171 (92.4%) | 14 (7.6%) |
| Information | 127 (69.8%) | 55 (30.2%) |
| Finance & Insurance | 78 (40.6%) | 114 (59.4%) |
| Real Estate, Rental & Leasing | 61 (70.1%) | 26 (29.9%) |
| Professional & Scientific | 236 (70.5%) | 99 (29.5%) |
| Enterprise Management | 0 (0.0%) | 0 (0.0%) |
| Administrative & Support | 229 (55.6%) | 183 (44.4%) |
| Educational Services | 471 (33.3%) | 943 (66.7%) |
| Health Care & Social Assistance | 171 (9.3%) | 1,674 (90.7%) |
| Arts, Entertainment & Recreation | 50 (44.3%) | 63 (55.7%) |
| Accommodation & Food Services | 353 (32.5%) | 732 (67.5%) |
| Public Administration | 403 (53.8%) | 346 (46.2%) |
| Total | 9,066 (54.6%) | 7,541 (45.4%) |
Education in Alexander County
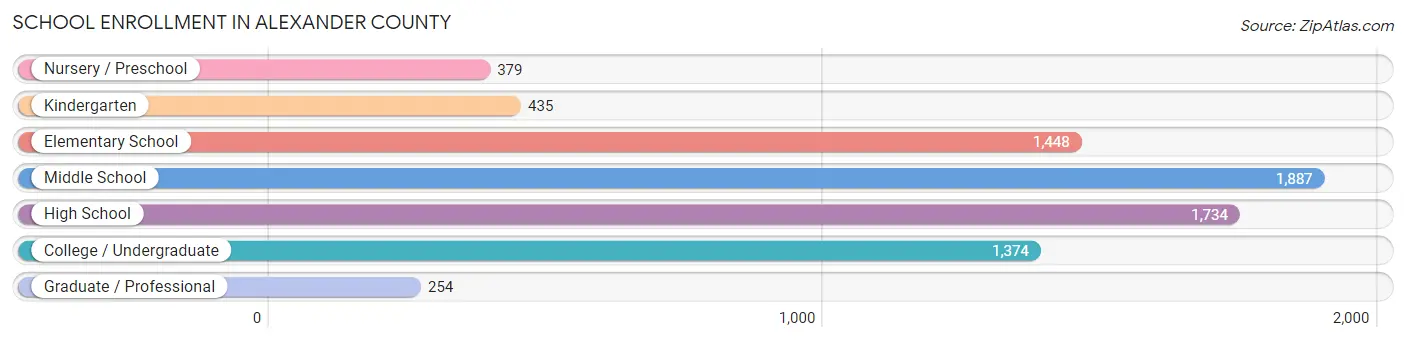
School Enrollment in Alexander County
The most common levels of schooling among the 7,511 students in Alexander County are middle school (1,887 | 25.1%), high school (1,734 | 23.1%), and elementary school (1,448 | 19.3%).
| School Level | # Students | % Students |
| Nursery / Preschool | 379 | 5.1% |
| Kindergarten | 435 | 5.8% |
| Elementary School | 1,448 | 19.3% |
| Middle School | 1,887 | 25.1% |
| High School | 1,734 | 23.1% |
| College / Undergraduate | 1,374 | 18.3% |
| Graduate / Professional | 254 | 3.4% |
| Total | 7,511 | 100.0% |
School Enrollment by Age by Funding Source in Alexander County
Out of a total of 7,511 students who are enrolled in schools in Alexander County, 1,172 (15.6%) attend a private institution, while the remaining 6,339 (84.4%) are enrolled in public schools. The age group of 3 to 4 year olds has the highest likelihood of being enrolled in private schools, with 114 (40.1% in the age bracket) enrolled. Conversely, the age group of 10 to 14 year olds has the lowest likelihood of being enrolled in a private school, with 2,090 (91.8% in the age bracket) attending a public institution.
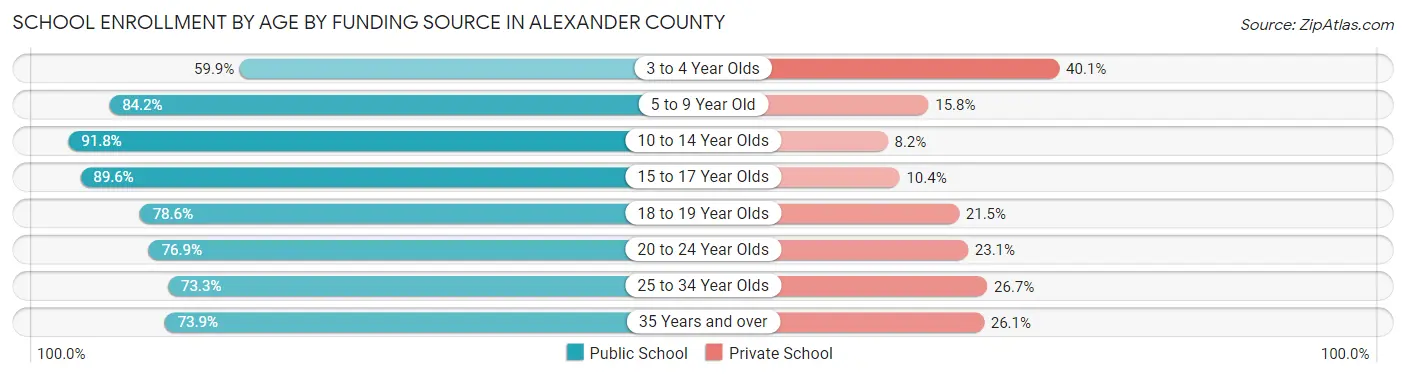
| Age Bracket | Public School | Private School |
| 3 to 4 Year Olds | 170 (59.9%) | 114 (40.1%) |
| 5 to 9 Year Old | 1,433 (84.2%) | 268 (15.8%) |
| 10 to 14 Year Olds | 2,090 (91.8%) | 186 (8.2%) |
| 15 to 17 Year Olds | 1,146 (89.6%) | 133 (10.4%) |
| 18 to 19 Year Olds | 443 (78.5%) | 121 (21.4%) |
| 20 to 24 Year Olds | 482 (76.9%) | 145 (23.1%) |
| 25 to 34 Year Olds | 288 (73.3%) | 105 (26.7%) |
| 35 Years and over | 286 (73.9%) | 101 (26.1%) |
| Total | 6,339 (84.4%) | 1,172 (15.6%) |
Educational Attainment by Field of Study in Alexander County
Education (1,227 | 28.4%), business (833 | 19.3%), science & technology (406 | 9.4%), arts & humanities (391 | 9.1%), and bio, nature & agricultural (290 | 6.7%) are the most common fields of study among 4,313 individuals in Alexander County who have obtained a bachelor's degree or higher.
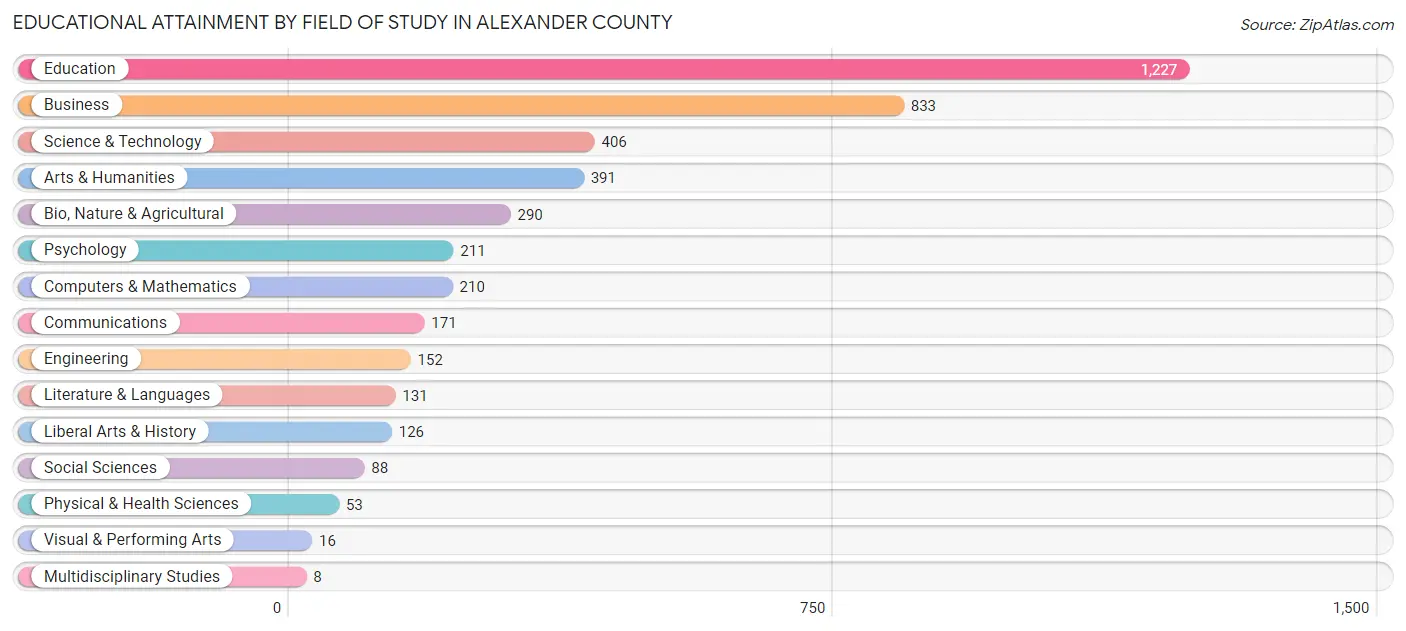
| Field of Study | # Graduates | % Graduates |
| Computers & Mathematics | 210 | 4.9% |
| Bio, Nature & Agricultural | 290 | 6.7% |
| Physical & Health Sciences | 53 | 1.2% |
| Psychology | 211 | 4.9% |
| Social Sciences | 88 | 2.0% |
| Engineering | 152 | 3.5% |
| Multidisciplinary Studies | 8 | 0.2% |
| Science & Technology | 406 | 9.4% |
| Business | 833 | 19.3% |
| Education | 1,227 | 28.4% |
| Literature & Languages | 131 | 3.0% |
| Liberal Arts & History | 126 | 2.9% |
| Visual & Performing Arts | 16 | 0.4% |
| Communications | 171 | 4.0% |
| Arts & Humanities | 391 | 9.1% |
| Total | 4,313 | 100.0% |
Transportation & Commute in Alexander County
Vehicle Availability by Sex in Alexander County
The most prevalent vehicle ownership categories in Alexander County are males with 2 vehicles (2,831, accounting for 32.6%) and females with 2 vehicles (2,321, making up 39.6%).
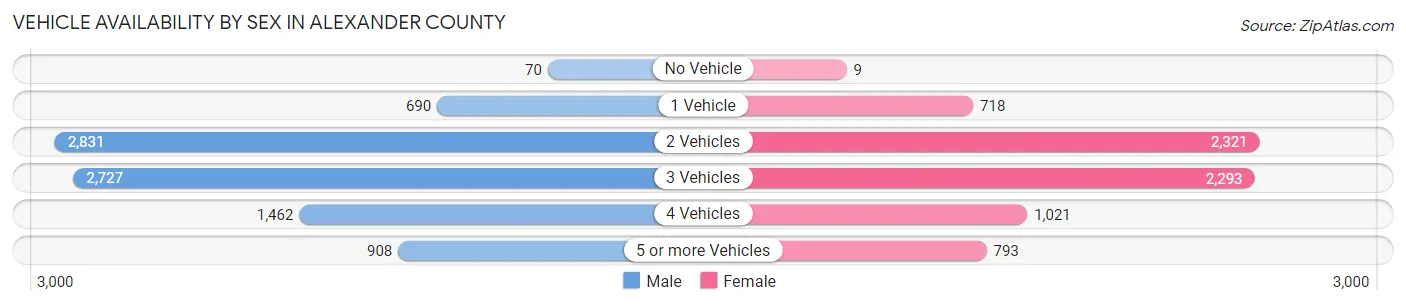
| Vehicles Available | Male | Female |
| No Vehicle | 70 (0.8%) | 9 (0.1%) |
| 1 Vehicle | 690 (7.9%) | 718 (10.0%) |
| 2 Vehicles | 2,831 (32.6%) | 2,321 (32.4%) |
| 3 Vehicles | 2,727 (31.4%) | 2,293 (32.1%) |
| 4 Vehicles | 1,462 (16.8%) | 1,021 (14.3%) |
| 5 or more Vehicles | 908 (10.4%) | 793 (11.1%) |
| Total | 8,688 (100.0%) | 7,155 (100.0%) |
Commute Time in Alexander County
The most frequently occuring commute durations in Alexander County are 20 to 24 minutes (2,708 commuters, 17.7%), 15 to 19 minutes (2,331 commuters, 15.3%), and 10 to 14 minutes (2,167 commuters, 14.2%).
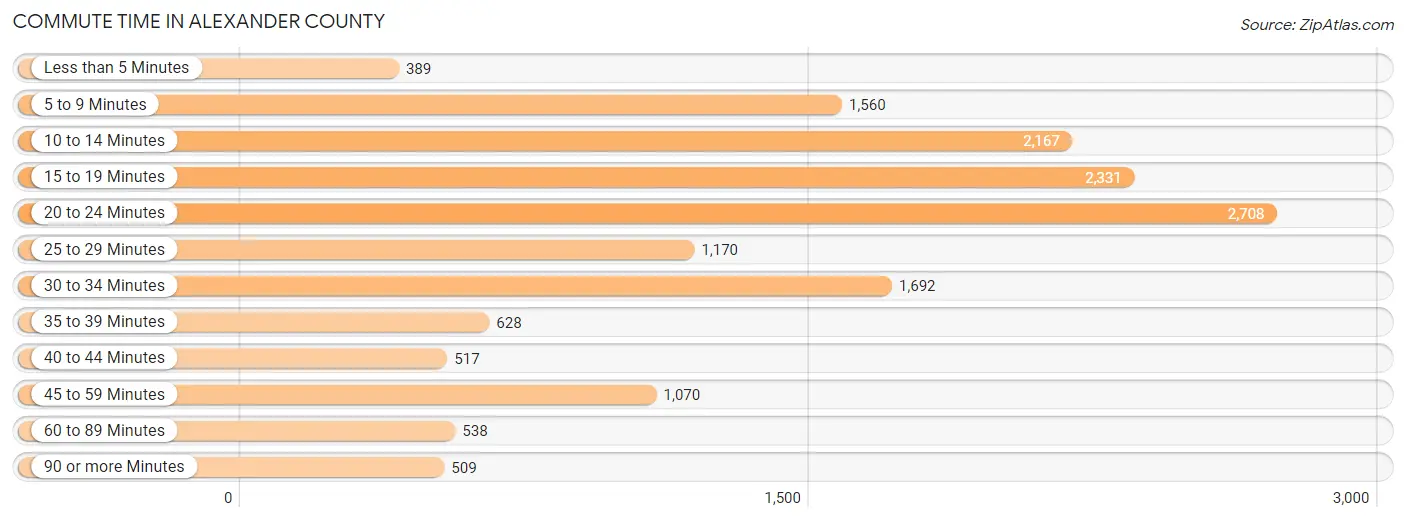
| Commute Time | # Commuters | % Commuters |
| Less than 5 Minutes | 389 | 2.5% |
| 5 to 9 Minutes | 1,560 | 10.2% |
| 10 to 14 Minutes | 2,167 | 14.2% |
| 15 to 19 Minutes | 2,331 | 15.3% |
| 20 to 24 Minutes | 2,708 | 17.7% |
| 25 to 29 Minutes | 1,170 | 7.7% |
| 30 to 34 Minutes | 1,692 | 11.1% |
| 35 to 39 Minutes | 628 | 4.1% |
| 40 to 44 Minutes | 517 | 3.4% |
| 45 to 59 Minutes | 1,070 | 7.0% |
| 60 to 89 Minutes | 538 | 3.5% |
| 90 or more Minutes | 509 | 3.3% |
Commute Time by Sex in Alexander County
The most common commute times in Alexander County are 20 to 24 minutes (1,395 commuters, 16.6%) for males and 20 to 24 minutes (1,313 commuters, 19.0%) for females.
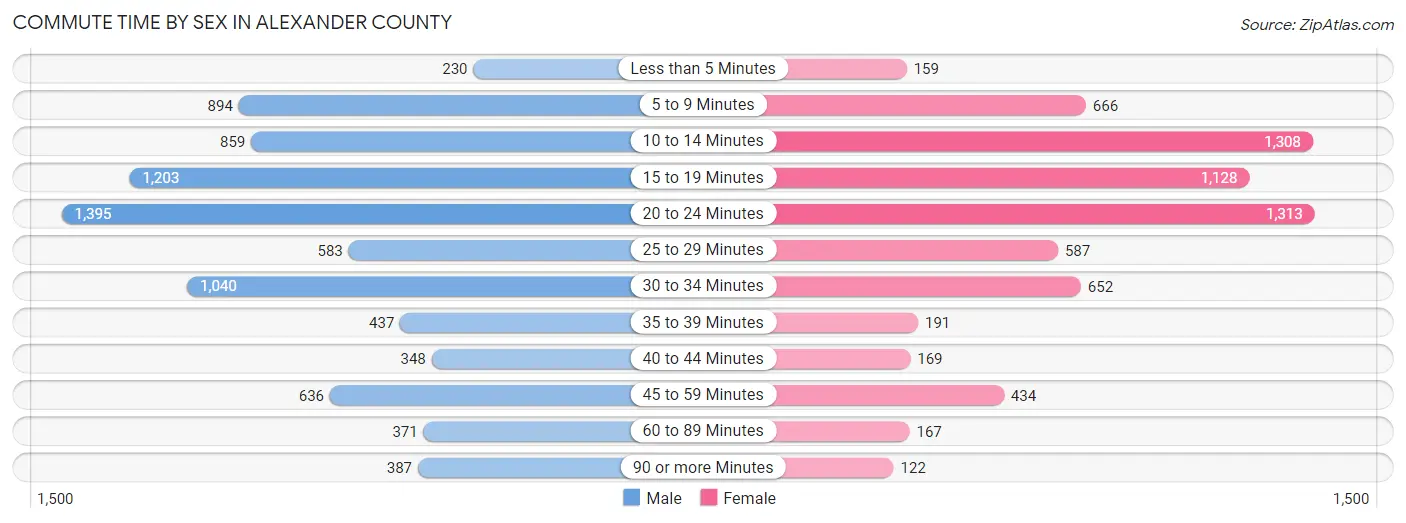
| Commute Time | Male | Female |
| Less than 5 Minutes | 230 (2.7%) | 159 (2.3%) |
| 5 to 9 Minutes | 894 (10.7%) | 666 (9.7%) |
| 10 to 14 Minutes | 859 (10.2%) | 1,308 (19.0%) |
| 15 to 19 Minutes | 1,203 (14.3%) | 1,128 (16.4%) |
| 20 to 24 Minutes | 1,395 (16.6%) | 1,313 (19.0%) |
| 25 to 29 Minutes | 583 (7.0%) | 587 (8.5%) |
| 30 to 34 Minutes | 1,040 (12.4%) | 652 (9.5%) |
| 35 to 39 Minutes | 437 (5.2%) | 191 (2.8%) |
| 40 to 44 Minutes | 348 (4.2%) | 169 (2.5%) |
| 45 to 59 Minutes | 636 (7.6%) | 434 (6.3%) |
| 60 to 89 Minutes | 371 (4.4%) | 167 (2.4%) |
| 90 or more Minutes | 387 (4.6%) | 122 (1.8%) |
Time of Departure to Work by Sex in Alexander County
The most frequent times of departure to work in Alexander County are 7:00 AM to 7:29 AM (1,395, 16.6%) for males and 6:30 AM to 6:59 AM (1,091, 15.8%) for females.
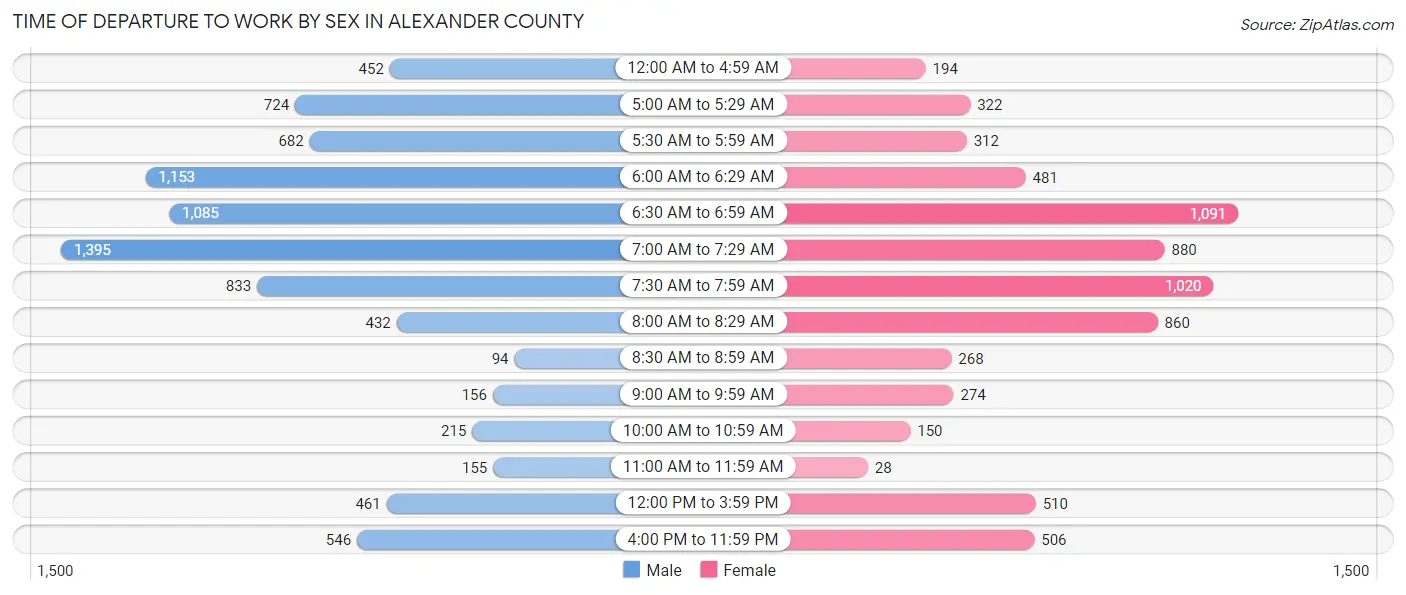
| Time of Departure | Male | Female |
| 12:00 AM to 4:59 AM | 452 (5.4%) | 194 (2.8%) |
| 5:00 AM to 5:29 AM | 724 (8.6%) | 322 (4.7%) |
| 5:30 AM to 5:59 AM | 682 (8.1%) | 312 (4.5%) |
| 6:00 AM to 6:29 AM | 1,153 (13.8%) | 481 (7.0%) |
| 6:30 AM to 6:59 AM | 1,085 (12.9%) | 1,091 (15.8%) |
| 7:00 AM to 7:29 AM | 1,395 (16.6%) | 880 (12.8%) |
| 7:30 AM to 7:59 AM | 833 (9.9%) | 1,020 (14.8%) |
| 8:00 AM to 8:29 AM | 432 (5.1%) | 860 (12.5%) |
| 8:30 AM to 8:59 AM | 94 (1.1%) | 268 (3.9%) |
| 9:00 AM to 9:59 AM | 156 (1.9%) | 274 (4.0%) |
| 10:00 AM to 10:59 AM | 215 (2.6%) | 150 (2.2%) |
| 11:00 AM to 11:59 AM | 155 (1.8%) | 28 (0.4%) |
| 12:00 PM to 3:59 PM | 461 (5.5%) | 510 (7.4%) |
| 4:00 PM to 11:59 PM | 546 (6.5%) | 506 (7.3%) |
| Total | 8,383 (100.0%) | 6,896 (100.0%) |
Housing Occupancy in Alexander County
Occupancy by Ownership in Alexander County
Of the total 13,761 dwellings in Alexander County, owner-occupied units account for 11,180 (81.2%), while renter-occupied units make up 2,581 (18.8%).
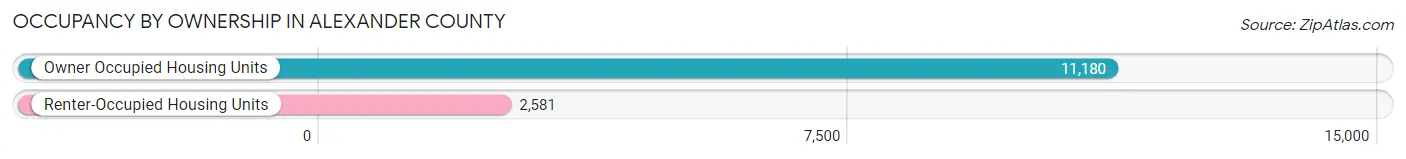
| Occupancy | # Housing Units | % Housing Units |
| Owner Occupied Housing Units | 11,180 | 81.2% |
| Renter-Occupied Housing Units | 2,581 | 18.8% |
| Total Occupied Housing Units | 13,761 | 100.0% |
Occupancy by Household Size in Alexander County
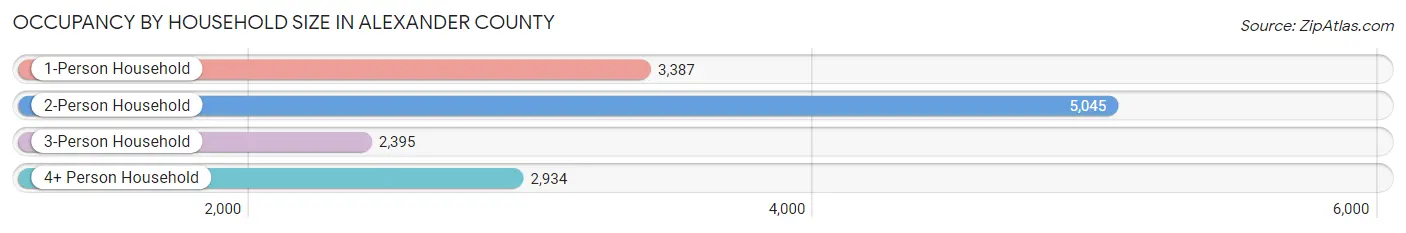
| Household Size | # Housing Units | % Housing Units |
| 1-Person Household | 3,387 | 24.6% |
| 2-Person Household | 5,045 | 36.7% |
| 3-Person Household | 2,395 | 17.4% |
| 4+ Person Household | 2,934 | 21.3% |
| Total Housing Units | 13,761 | 100.0% |
Occupancy by Ownership by Household Size in Alexander County
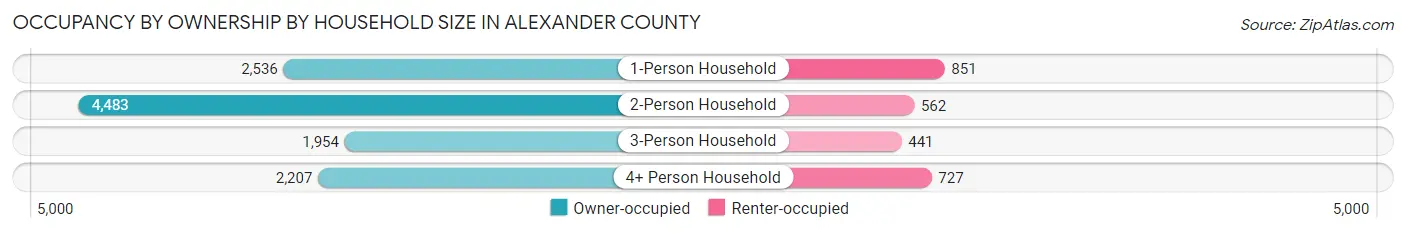
| Household Size | Owner-occupied | Renter-occupied |
| 1-Person Household | 2,536 (74.9%) | 851 (25.1%) |
| 2-Person Household | 4,483 (88.9%) | 562 (11.1%) |
| 3-Person Household | 1,954 (81.6%) | 441 (18.4%) |
| 4+ Person Household | 2,207 (75.2%) | 727 (24.8%) |
| Total Housing Units | 11,180 (81.2%) | 2,581 (18.8%) |
Occupancy by Educational Attainment in Alexander County
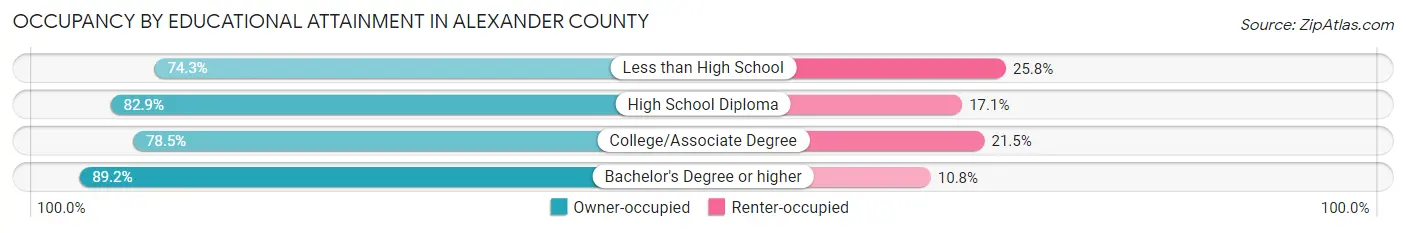
| Household Size | Owner-occupied | Renter-occupied |
| Less than High School | 1,465 (74.3%) | 508 (25.8%) |
| High School Diploma | 4,166 (82.9%) | 857 (17.1%) |
| College/Associate Degree | 3,558 (78.5%) | 974 (21.5%) |
| Bachelor's Degree or higher | 1,991 (89.2%) | 242 (10.8%) |
Occupancy by Age of Householder in Alexander County
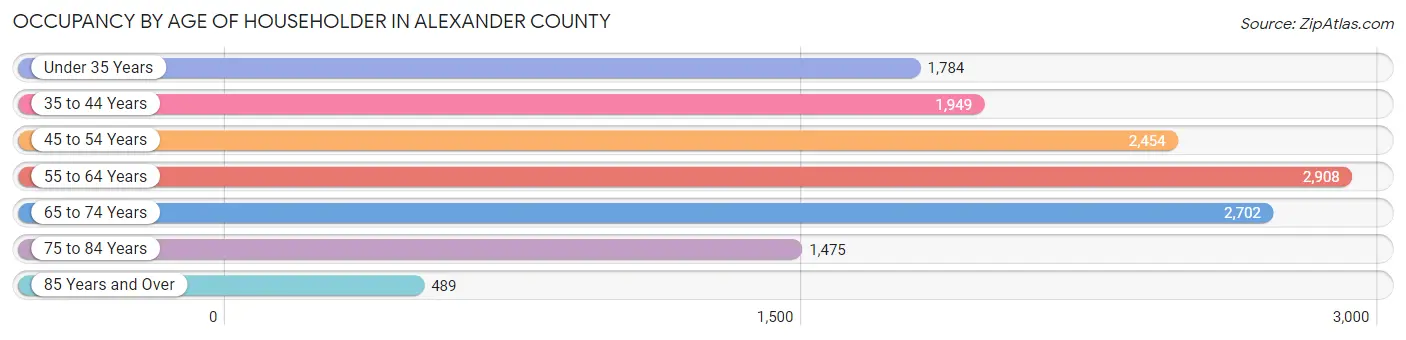
| Age Bracket | # Households | % Households |
| Under 35 Years | 1,784 | 13.0% |
| 35 to 44 Years | 1,949 | 14.2% |
| 45 to 54 Years | 2,454 | 17.8% |
| 55 to 64 Years | 2,908 | 21.1% |
| 65 to 74 Years | 2,702 | 19.6% |
| 75 to 84 Years | 1,475 | 10.7% |
| 85 Years and Over | 489 | 3.5% |
| Total | 13,761 | 100.0% |
Housing Finances in Alexander County
Median Income by Occupancy in Alexander County
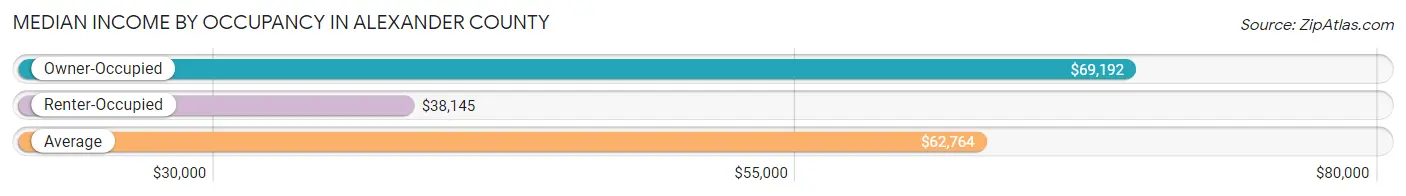
| Occupancy Type | # Households | Median Income |
| Owner-Occupied | 11,180 (81.2%) | $69,192 |
| Renter-Occupied | 2,581 (18.8%) | $38,145 |
| Average | 13,761 (100.0%) | $62,764 |
Occupancy by Householder Income Bracket in Alexander County
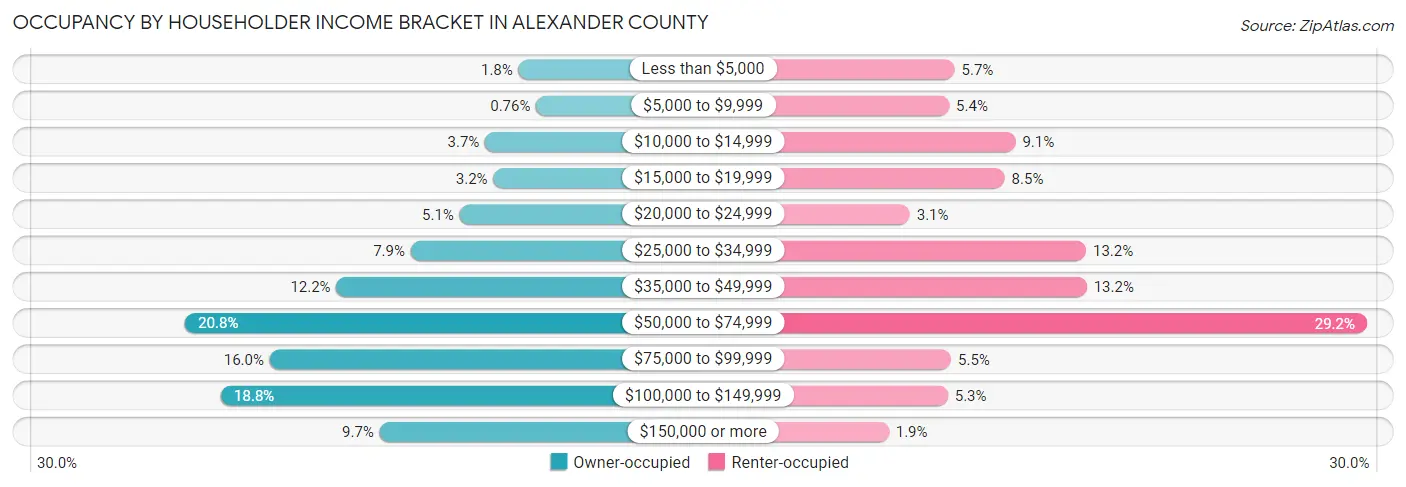
| Income Bracket | Owner-occupied | Renter-occupied |
| Less than $5,000 | 198 (1.8%) | 146 (5.7%) |
| $5,000 to $9,999 | 85 (0.8%) | 138 (5.3%) |
| $10,000 to $14,999 | 411 (3.7%) | 236 (9.1%) |
| $15,000 to $19,999 | 359 (3.2%) | 220 (8.5%) |
| $20,000 to $24,999 | 575 (5.1%) | 80 (3.1%) |
| $25,000 to $34,999 | 887 (7.9%) | 340 (13.2%) |
| $35,000 to $49,999 | 1,362 (12.2%) | 341 (13.2%) |
| $50,000 to $74,999 | 2,329 (20.8%) | 754 (29.2%) |
| $75,000 to $99,999 | 1,788 (16.0%) | 141 (5.5%) |
| $100,000 to $149,999 | 2,100 (18.8%) | 136 (5.3%) |
| $150,000 or more | 1,086 (9.7%) | 49 (1.9%) |
| Total | 11,180 (100.0%) | 2,581 (100.0%) |
Monthly Housing Cost Tiers in Alexander County
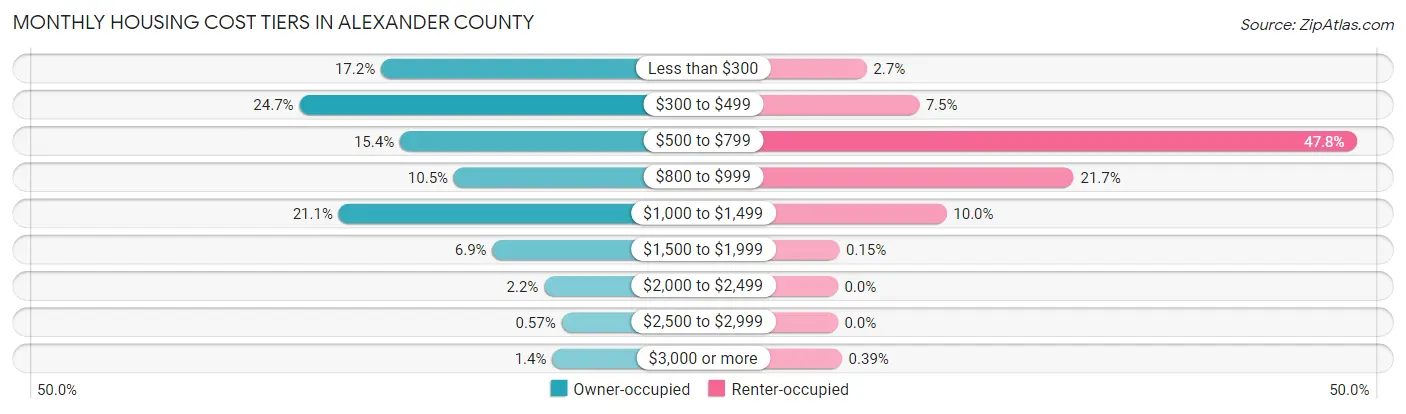
| Monthly Cost | Owner-occupied | Renter-occupied |
| Less than $300 | 1,922 (17.2%) | 69 (2.7%) |
| $300 to $499 | 2,762 (24.7%) | 193 (7.5%) |
| $500 to $799 | 1,726 (15.4%) | 1,233 (47.8%) |
| $800 to $999 | 1,172 (10.5%) | 561 (21.7%) |
| $1,000 to $1,499 | 2,357 (21.1%) | 259 (10.0%) |
| $1,500 to $1,999 | 775 (6.9%) | 4 (0.2%) |
| $2,000 to $2,499 | 243 (2.2%) | 0 (0.0%) |
| $2,500 to $2,999 | 64 (0.6%) | 0 (0.0%) |
| $3,000 or more | 159 (1.4%) | 10 (0.4%) |
| Total | 11,180 (100.0%) | 2,581 (100.0%) |
Physical Housing Characteristics in Alexander County
Housing Structures in Alexander County
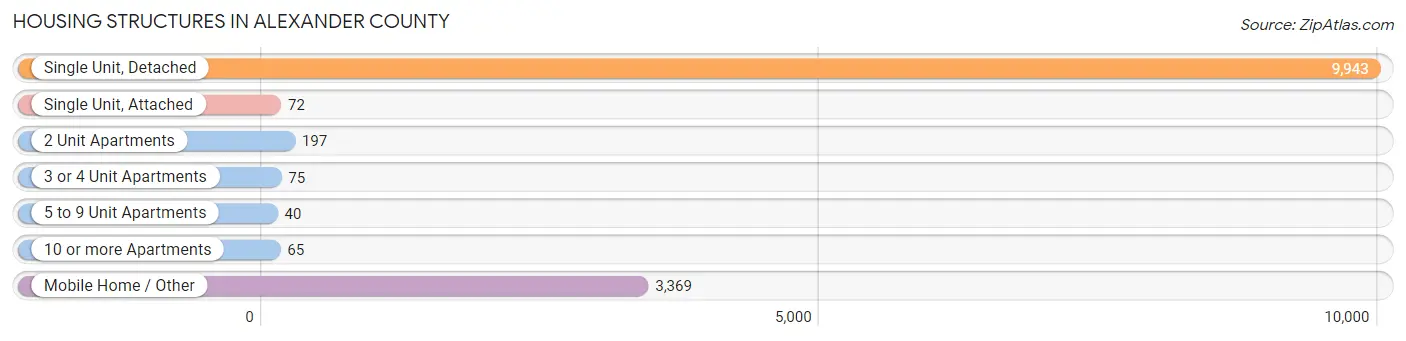
| Structure Type | # Housing Units | % Housing Units |
| Single Unit, Detached | 9,943 | 72.3% |
| Single Unit, Attached | 72 | 0.5% |
| 2 Unit Apartments | 197 | 1.4% |
| 3 or 4 Unit Apartments | 75 | 0.5% |
| 5 to 9 Unit Apartments | 40 | 0.3% |
| 10 or more Apartments | 65 | 0.5% |
| Mobile Home / Other | 3,369 | 24.5% |
| Total | 13,761 | 100.0% |
Housing Structures by Occupancy in Alexander County
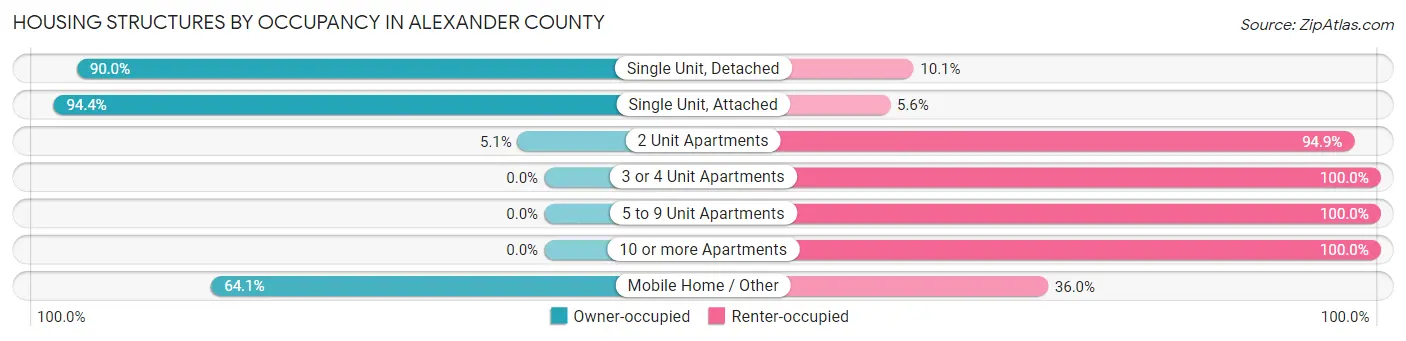
| Structure Type | Owner-occupied | Renter-occupied |
| Single Unit, Detached | 8,944 (89.9%) | 999 (10.1%) |
| Single Unit, Attached | 68 (94.4%) | 4 (5.6%) |
| 2 Unit Apartments | 10 (5.1%) | 187 (94.9%) |
| 3 or 4 Unit Apartments | 0 (0.0%) | 75 (100.0%) |
| 5 to 9 Unit Apartments | 0 (0.0%) | 40 (100.0%) |
| 10 or more Apartments | 0 (0.0%) | 65 (100.0%) |
| Mobile Home / Other | 2,158 (64.0%) | 1,211 (35.9%) |
| Total | 11,180 (81.2%) | 2,581 (18.8%) |
Housing Structures by Number of Rooms in Alexander County
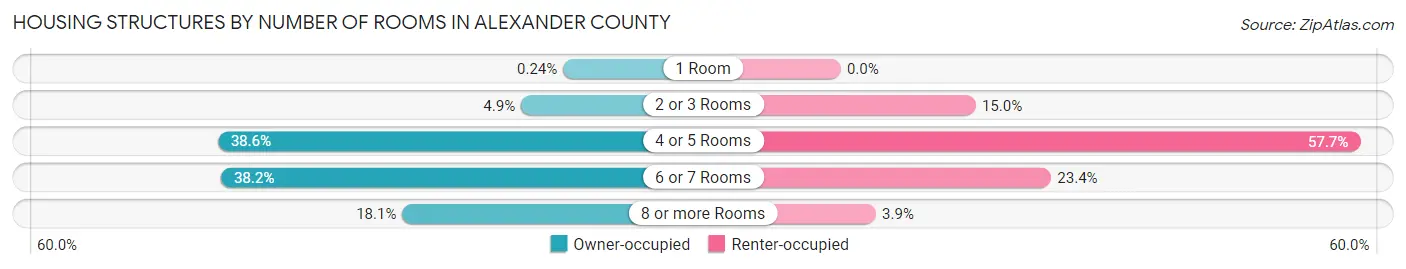
| Number of Rooms | Owner-occupied | Renter-occupied |
| 1 Room | 27 (0.2%) | 0 (0.0%) |
| 2 or 3 Rooms | 549 (4.9%) | 387 (15.0%) |
| 4 or 5 Rooms | 4,311 (38.6%) | 1,490 (57.7%) |
| 6 or 7 Rooms | 4,271 (38.2%) | 603 (23.4%) |
| 8 or more Rooms | 2,022 (18.1%) | 101 (3.9%) |
| Total | 11,180 (100.0%) | 2,581 (100.0%) |
Housing Structure by Heating Type in Alexander County
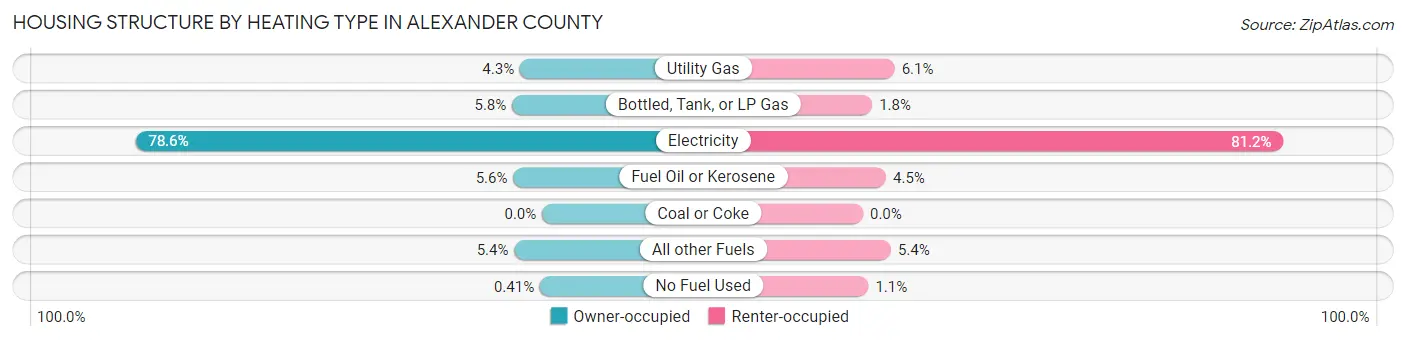
| Heating Type | Owner-occupied | Renter-occupied |
| Utility Gas | 477 (4.3%) | 158 (6.1%) |
| Bottled, Tank, or LP Gas | 647 (5.8%) | 46 (1.8%) |
| Electricity | 8,788 (78.6%) | 2,096 (81.2%) |
| Fuel Oil or Kerosene | 622 (5.6%) | 115 (4.5%) |
| Coal or Coke | 0 (0.0%) | 0 (0.0%) |
| All other Fuels | 600 (5.4%) | 139 (5.4%) |
| No Fuel Used | 46 (0.4%) | 27 (1.1%) |
| Total | 11,180 (100.0%) | 2,581 (100.0%) |
Household Vehicle Usage in Alexander County
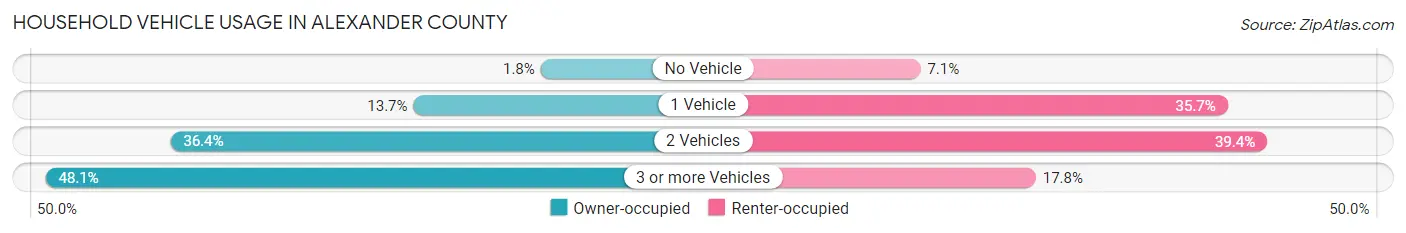
| Vehicles per Household | Owner-occupied | Renter-occupied |
| No Vehicle | 205 (1.8%) | 182 (7.0%) |
| 1 Vehicle | 1,533 (13.7%) | 922 (35.7%) |
| 2 Vehicles | 4,070 (36.4%) | 1,017 (39.4%) |
| 3 or more Vehicles | 5,372 (48.0%) | 460 (17.8%) |
| Total | 11,180 (100.0%) | 2,581 (100.0%) |
Real Estate & Mortgages in Alexander County
Real Estate and Mortgage Overview in Alexander County
| Characteristic | Without Mortgage | With Mortgage |
| Housing Units | 5,783 | 5,397 |
| Median Property Value | $152,400 | $190,100 |
| Median Household Income | $50,808 | $638 |
| Monthly Housing Costs | $365 | $159 |
| Real Estate Taxes | $1,067 | $34 |
Property Value by Mortgage Status in Alexander County
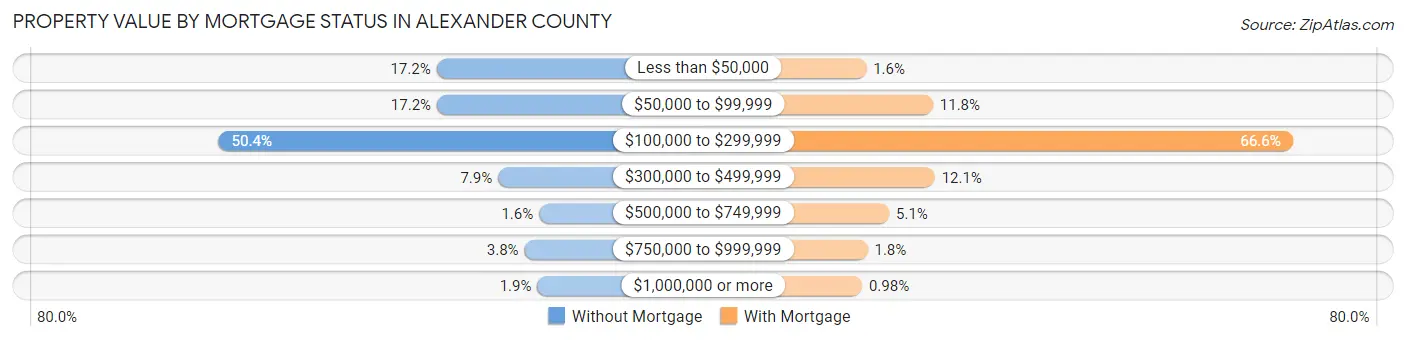
| Property Value | Without Mortgage | With Mortgage |
| Less than $50,000 | 997 (17.2%) | 88 (1.6%) |
| $50,000 to $99,999 | 993 (17.2%) | 636 (11.8%) |
| $100,000 to $299,999 | 2,916 (50.4%) | 3,594 (66.6%) |
| $300,000 to $499,999 | 454 (7.9%) | 651 (12.1%) |
| $500,000 to $749,999 | 93 (1.6%) | 276 (5.1%) |
| $750,000 to $999,999 | 222 (3.8%) | 99 (1.8%) |
| $1,000,000 or more | 108 (1.9%) | 53 (1.0%) |
| Total | 5,783 (100.0%) | 5,397 (100.0%) |
Household Income by Mortgage Status in Alexander County
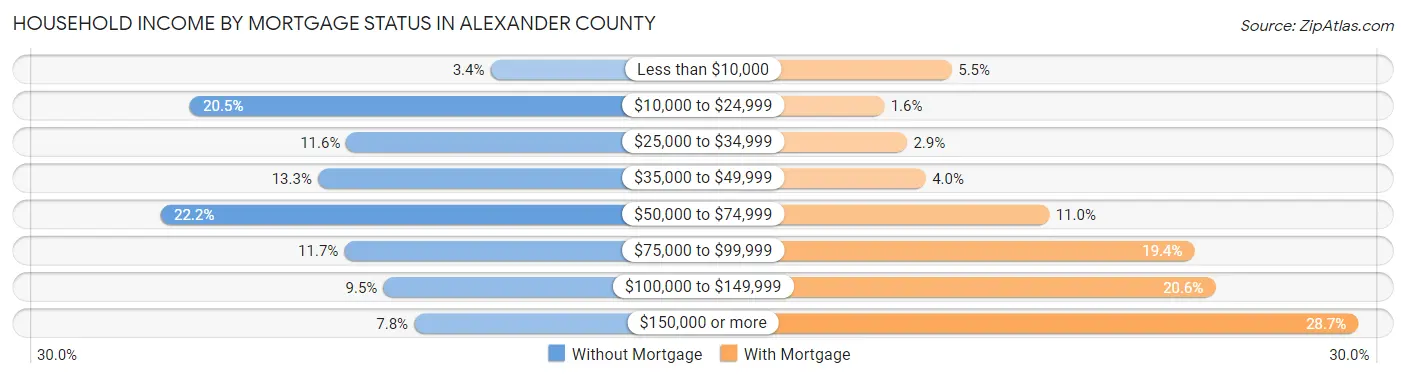
| Household Income | Without Mortgage | With Mortgage |
| Less than $10,000 | 196 (3.4%) | 295 (5.5%) |
| $10,000 to $24,999 | 1,188 (20.5%) | 87 (1.6%) |
| $25,000 to $34,999 | 672 (11.6%) | 157 (2.9%) |
| $35,000 to $49,999 | 766 (13.3%) | 215 (4.0%) |
| $50,000 to $74,999 | 1,284 (22.2%) | 596 (11.0%) |
| $75,000 to $99,999 | 679 (11.7%) | 1,045 (19.4%) |
| $100,000 to $149,999 | 550 (9.5%) | 1,109 (20.5%) |
| $150,000 or more | 448 (7.7%) | 1,550 (28.7%) |
| Total | 5,783 (100.0%) | 5,397 (100.0%) |
Property Value to Household Income Ratio in Alexander County
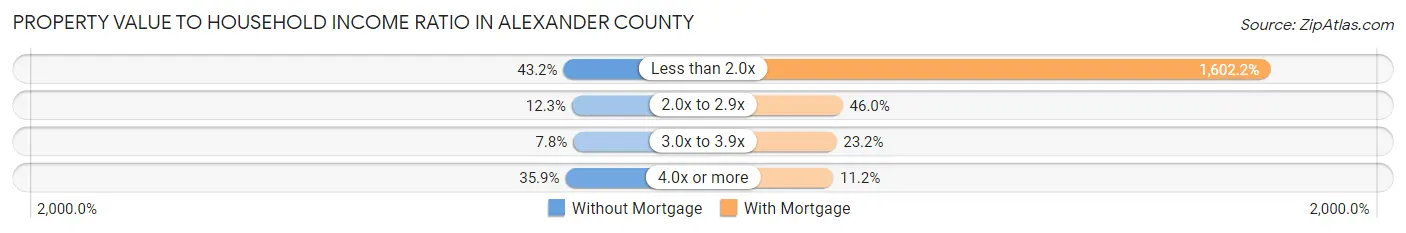
| Value-to-Income Ratio | Without Mortgage | With Mortgage |
| Less than 2.0x | 2,498 (43.2%) | 86,473 (1,602.2%) |
| 2.0x to 2.9x | 709 (12.3%) | 2,483 (46.0%) |
| 3.0x to 3.9x | 452 (7.8%) | 1,251 (23.2%) |
| 4.0x or more | 2,077 (35.9%) | 606 (11.2%) |
| Total | 5,783 (100.0%) | 5,397 (100.0%) |
Real Estate Taxes by Mortgage Status in Alexander County
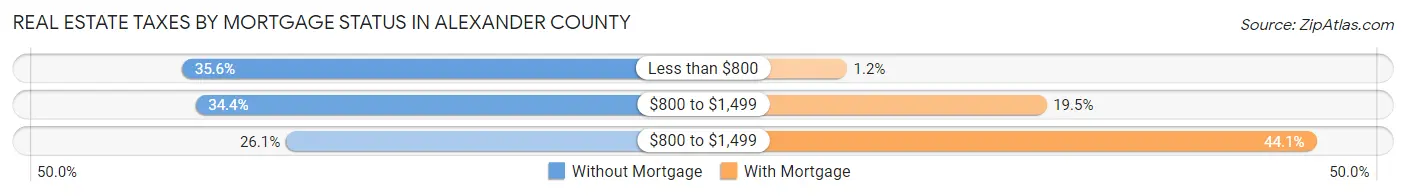
| Property Taxes | Without Mortgage | With Mortgage |
| Less than $800 | 2,061 (35.6%) | 67 (1.2%) |
| $800 to $1,499 | 1,990 (34.4%) | 1,051 (19.5%) |
| $800 to $1,499 | 1,511 (26.1%) | 2,382 (44.1%) |
| Total | 5,783 (100.0%) | 5,397 (100.0%) |
Health & Disability in Alexander County
Health Insurance Coverage by Age in Alexander County
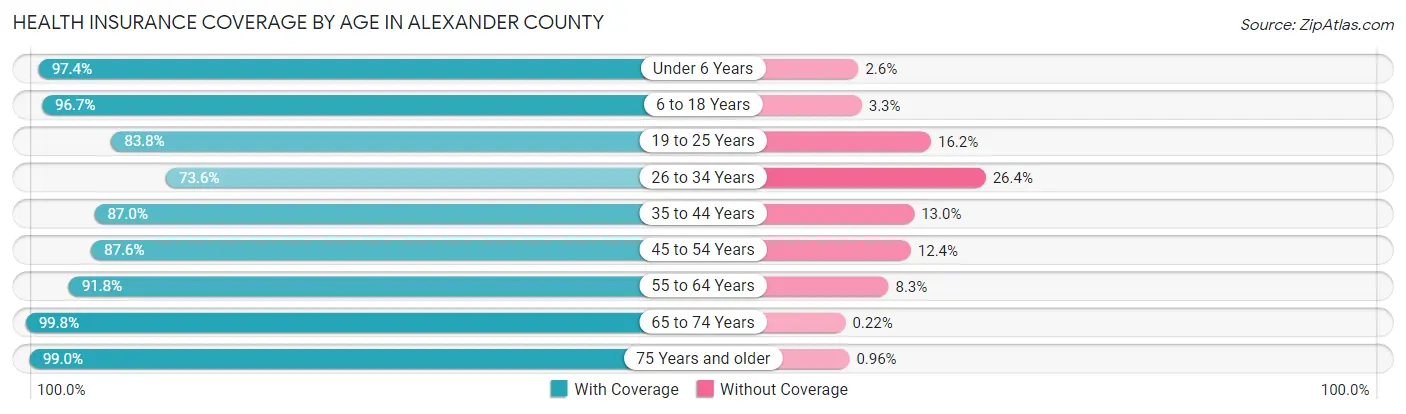
| Age Bracket | With Coverage | Without Coverage |
| Under 6 Years | 2,099 (97.4%) | 57 (2.6%) |
| 6 to 18 Years | 5,304 (96.7%) | 179 (3.3%) |
| 19 to 25 Years | 2,383 (83.8%) | 460 (16.2%) |
| 26 to 34 Years | 2,596 (73.6%) | 930 (26.4%) |
| 35 to 44 Years | 3,460 (87.0%) | 519 (13.0%) |
| 45 to 54 Years | 4,250 (87.6%) | 602 (12.4%) |
| 55 to 64 Years | 4,746 (91.7%) | 427 (8.3%) |
| 65 to 74 Years | 4,133 (99.8%) | 9 (0.2%) |
| 75 Years and older | 3,094 (99.0%) | 30 (1.0%) |
| Total | 32,065 (90.9%) | 3,213 (9.1%) |
Health Insurance Coverage by Citizenship Status in Alexander County
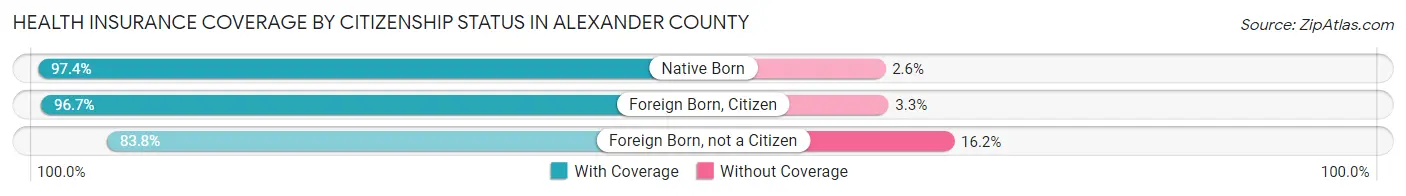
| Citizenship Status | With Coverage | Without Coverage |
| Native Born | 2,099 (97.4%) | 57 (2.6%) |
| Foreign Born, Citizen | 5,304 (96.7%) | 179 (3.3%) |
| Foreign Born, not a Citizen | 2,383 (83.8%) | 460 (16.2%) |
Health Insurance Coverage by Household Income in Alexander County
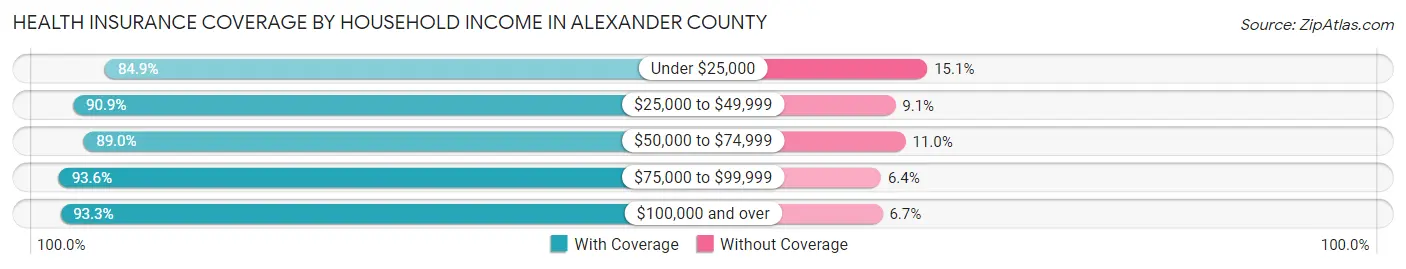
| Household Income | With Coverage | Without Coverage |
| Under $25,000 | 3,849 (84.9%) | 683 (15.1%) |
| $25,000 to $49,999 | 5,915 (90.9%) | 592 (9.1%) |
| $50,000 to $74,999 | 6,941 (89.0%) | 859 (11.0%) |
| $75,000 to $99,999 | 4,928 (93.6%) | 337 (6.4%) |
| $100,000 and over | 10,365 (93.3%) | 742 (6.7%) |
Public vs Private Health Insurance Coverage by Age in Alexander County
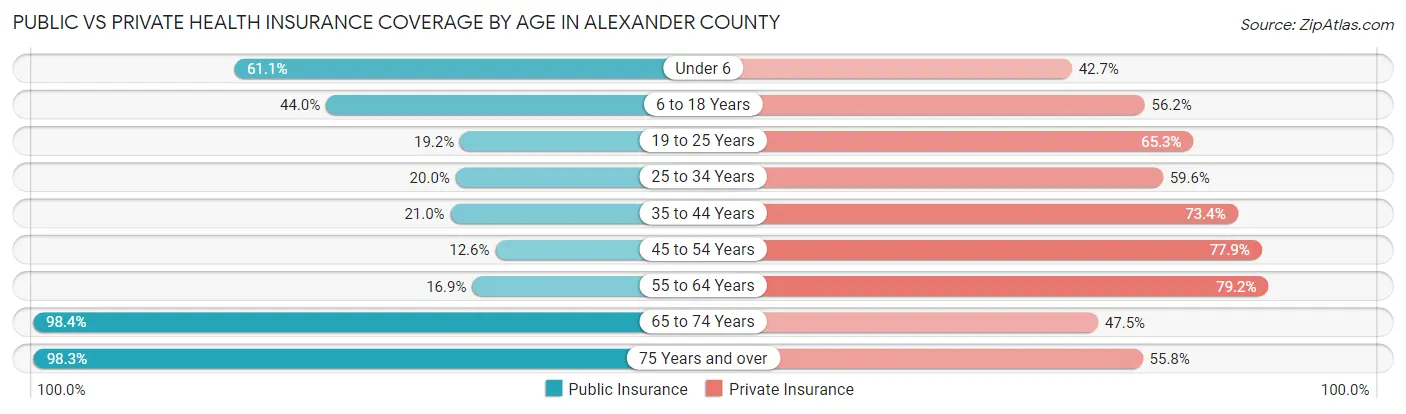
| Age Bracket | Public Insurance | Private Insurance |
| Under 6 | 1,318 (61.1%) | 920 (42.7%) |
| 6 to 18 Years | 2,414 (44.0%) | 3,082 (56.2%) |
| 19 to 25 Years | 545 (19.2%) | 1,855 (65.2%) |
| 25 to 34 Years | 705 (20.0%) | 2,100 (59.6%) |
| 35 to 44 Years | 834 (21.0%) | 2,922 (73.4%) |
| 45 to 54 Years | 613 (12.6%) | 3,781 (77.9%) |
| 55 to 64 Years | 875 (16.9%) | 4,095 (79.2%) |
| 65 to 74 Years | 4,077 (98.4%) | 1,969 (47.5%) |
| 75 Years and over | 3,071 (98.3%) | 1,744 (55.8%) |
| Total | 14,452 (41.0%) | 22,468 (63.7%) |
Disability Status by Sex by Age in Alexander County
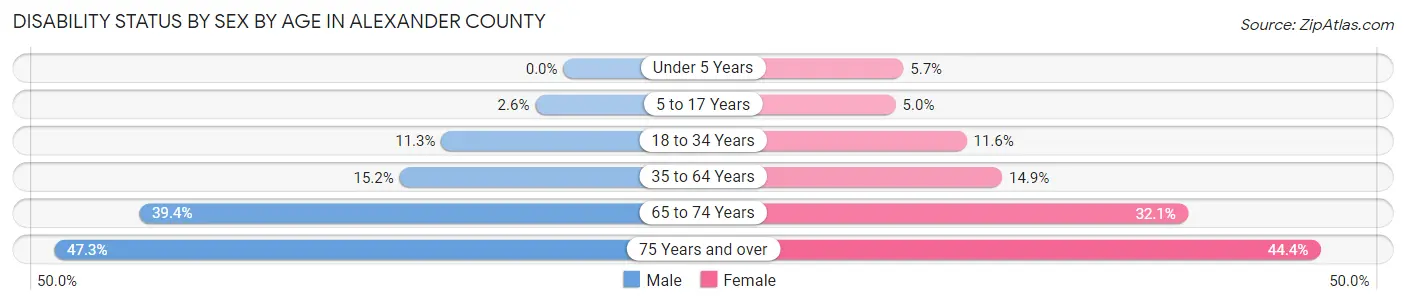
| Age Bracket | Male | Female |
| Under 5 Years | 0 (0.0%) | 45 (5.7%) |
| 5 to 17 Years | 74 (2.6%) | 133 (5.0%) |
| 18 to 34 Years | 413 (11.3%) | 370 (11.6%) |
| 35 to 64 Years | 1,076 (15.2%) | 1,030 (14.9%) |
| 65 to 74 Years | 792 (39.4%) | 684 (32.1%) |
| 75 Years and over | 629 (47.3%) | 796 (44.4%) |
Disability Class by Sex by Age in Alexander County
Disability Class: Hearing Difficulty
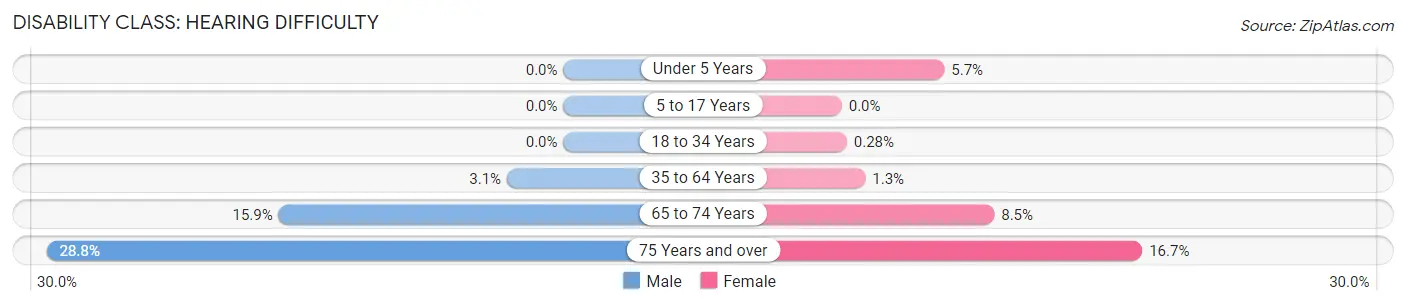
| Age Bracket | Male | Female |
| Under 5 Years | 0 (0.0%) | 45 (5.7%) |
| 5 to 17 Years | 0 (0.0%) | 0 (0.0%) |
| 18 to 34 Years | 0 (0.0%) | 9 (0.3%) |
| 35 to 64 Years | 222 (3.1%) | 91 (1.3%) |
| 65 to 74 Years | 319 (15.9%) | 181 (8.5%) |
| 75 Years and over | 383 (28.8%) | 300 (16.7%) |
Disability Class: Vision Difficulty
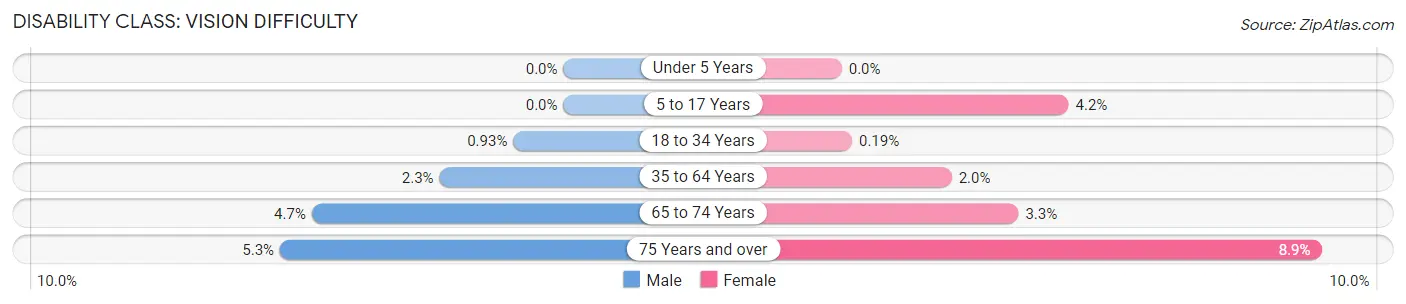
| Age Bracket | Male | Female |
| Under 5 Years | 0 (0.0%) | 0 (0.0%) |
| 5 to 17 Years | 0 (0.0%) | 112 (4.2%) |
| 18 to 34 Years | 34 (0.9%) | 6 (0.2%) |
| 35 to 64 Years | 163 (2.3%) | 141 (2.0%) |
| 65 to 74 Years | 94 (4.7%) | 70 (3.3%) |
| 75 Years and over | 70 (5.3%) | 160 (8.9%) |
Disability Class: Cognitive Difficulty
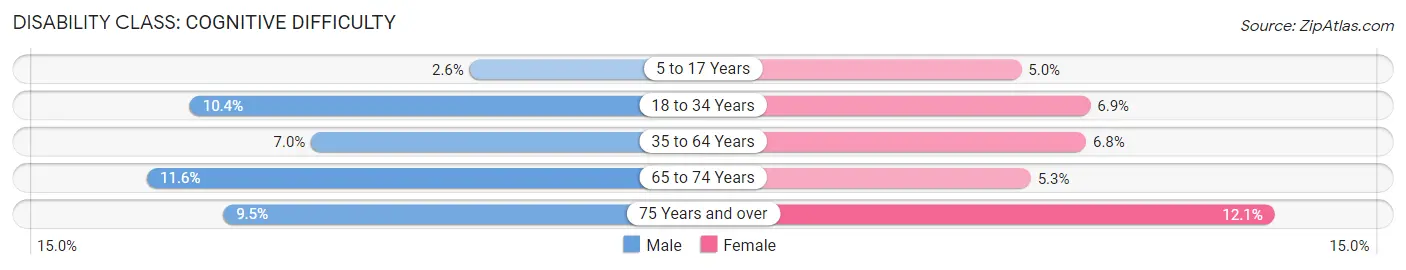
| Age Bracket | Male | Female |
| 5 to 17 Years | 74 (2.6%) | 133 (5.0%) |
| 18 to 34 Years | 379 (10.4%) | 221 (6.9%) |
| 35 to 64 Years | 497 (7.0%) | 471 (6.8%) |
| 65 to 74 Years | 233 (11.6%) | 112 (5.3%) |
| 75 Years and over | 126 (9.5%) | 216 (12.0%) |
Disability Class: Ambulatory Difficulty
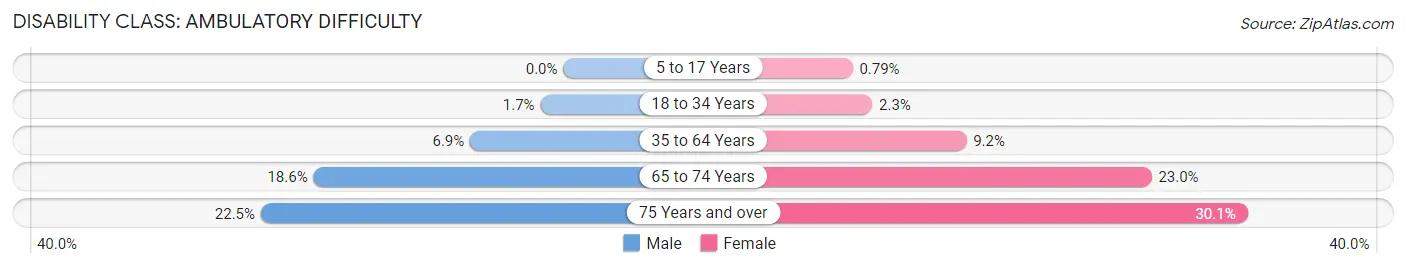
| Age Bracket | Male | Female |
| 5 to 17 Years | 0 (0.0%) | 21 (0.8%) |
| 18 to 34 Years | 62 (1.7%) | 72 (2.2%) |
| 35 to 64 Years | 490 (6.9%) | 640 (9.2%) |
| 65 to 74 Years | 373 (18.5%) | 490 (23.0%) |
| 75 Years and over | 299 (22.5%) | 540 (30.1%) |
Disability Class: Self-Care Difficulty
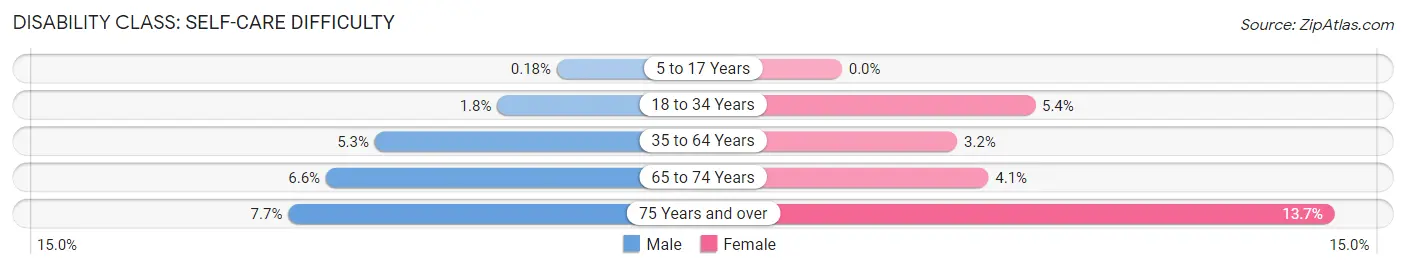
| Age Bracket | Male | Female |
| 5 to 17 Years | 5 (0.2%) | 0 (0.0%) |
| 18 to 34 Years | 67 (1.8%) | 172 (5.4%) |
| 35 to 64 Years | 372 (5.2%) | 222 (3.2%) |
| 65 to 74 Years | 133 (6.6%) | 87 (4.1%) |
| 75 Years and over | 102 (7.7%) | 246 (13.7%) |
Technology Access in Alexander County
Computing Device Access in Alexander County
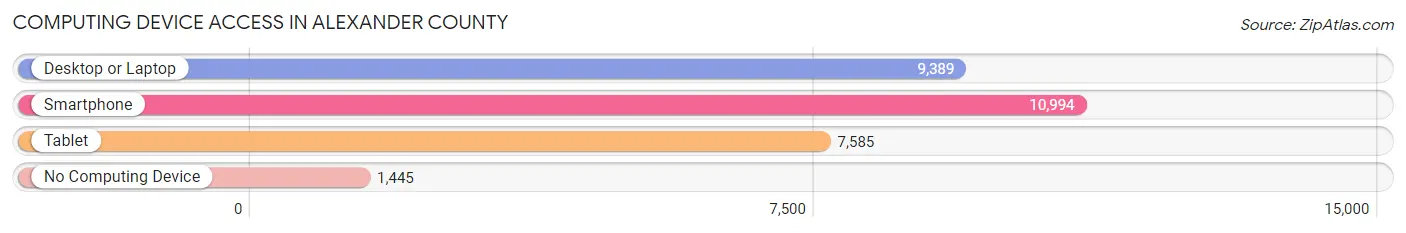
| Device Type | # Households | % Households |
| Desktop or Laptop | 9,389 | 68.2% |
| Smartphone | 10,994 | 79.9% |
| Tablet | 7,585 | 55.1% |
| No Computing Device | 1,445 | 10.5% |
| Total | 13,761 | 100.0% |
Internet Access in Alexander County
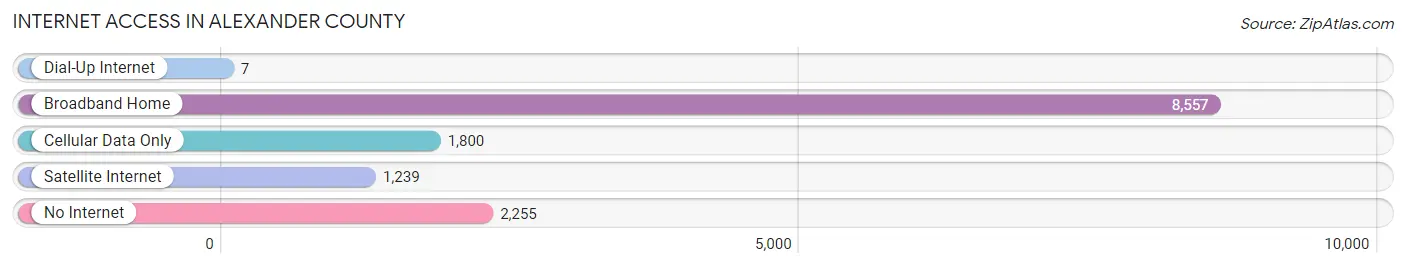
| Internet Type | # Households | % Households |
| Dial-Up Internet | 7 | 0.1% |
| Broadband Home | 8,557 | 62.2% |
| Cellular Data Only | 1,800 | 13.1% |
| Satellite Internet | 1,239 | 9.0% |
| No Internet | 2,255 | 16.4% |
| Total | 13,761 | 100.0% |
Alexander County Summary
Alexander County is located in the western part of North Carolina, in the foothills of the Blue Ridge Mountains. It is bordered by Wilkes County to the north, Caldwell County to the east, Catawba County to the south, and Iredell County to the west. The county seat is Taylorsville, and the largest city is Hiddenite. The county was formed in 1847 from parts of Wilkes and Iredell counties.
Geography
Alexander County covers an area of approximately 250 square miles. The terrain is mostly hilly, with elevations ranging from 600 to 1,400 feet above sea level. The county is drained by the Catawba River and its tributaries, including the South Yadkin River, the Little River, and the Rocky River. The county is home to several state parks, including South Mountains State Park, Elk Knob State Park, and Lake Hickory State Park.
Economy
Alexander County has a diverse economy, with a mix of manufacturing, agriculture, and tourism. The county is home to several large manufacturing companies, including Alexander Furniture, Alexander Plastics, and Alexander Textiles. Agriculture is also an important part of the local economy, with the county producing a variety of crops, including corn, soybeans, wheat, and hay. Tourism is also an important part of the local economy, with the county being home to several popular attractions, including the Hiddenite Gem Mine, the South Mountains State Park, and the Lake Hickory State Park.
Demographics
As of the 2010 census, Alexander County had a population of 37,198. The racial makeup of the county was 92.3% White, 4.3% African American, 0.5% Native American, 0.4% Asian, 0.1% Pacific Islander, 1.2% from other races, and 1.2% from two or more races. Hispanic or Latino of any race were 3.2% of the population.
The median income for a household in the county was $37,845, and the median income for a family was $45,945. The per capita income for the county was $19,845. About 13.2% of families and 16.2% of the population were below the poverty line, including 22.2% of those under age 18 and 13.2% of those age 65 or over.
Conclusion
Alexander County is a diverse county located in the western part of North Carolina. It has a mix of manufacturing, agriculture, and tourism, and is home to several popular attractions. The population of the county is mostly white, with a small percentage of African Americans, Native Americans, Asians, and Pacific Islanders. The median income for a household in the county is slightly below the state average, and the poverty rate is slightly higher than the state average.
Common Questions
What is Per Capita Income in Alexander County?
Per Capita income in Alexander County is $30,510.
What is the Median Family Income in Alexander County?
Median Family Income in Alexander County is $72,821.
What is the Median Household income in Alexander County?
Median Household Income in Alexander County is $62,764.
What is Income or Wage Gap in Alexander County?
Income or Wage Gap in Alexander County is 21.4%.
Women in Alexander County earn 78.6 cents for every dollar earned by a man.
What is Family Income Deficit in Alexander County?
Family Income Deficit in Alexander County is $10,473.
Families that are below poverty line in Alexander County earn $10,473 less on average than the poverty threshold level.
What is Inequality or Gini Index in Alexander County?
Inequality or Gini Index in Alexander County is 0.43.
What is the Total Population of Alexander County?
Total Population of Alexander County is 36,505.
What is the Total Male Population of Alexander County?
Total Male Population of Alexander County is 18,896.
What is the Total Female Population of Alexander County?
Total Female Population of Alexander County is 17,609.
What is the Ratio of Males per 100 Females in Alexander County?
There are 107.31 Males per 100 Females in Alexander County.
What is the Ratio of Females per 100 Males in Alexander County?
There are 93.19 Females per 100 Males in Alexander County.
What is the Median Population Age in Alexander County?
Median Population Age in Alexander County is 43.9 Years.
What is the Average Family Size in Alexander County
Average Family Size in Alexander County is 3.0 People.
What is the Average Household Size in Alexander County
Average Household Size in Alexander County is 2.6 People.
How Large is the Labor Force in Alexander County?
There are 17,598 People in the Labor Forcein in Alexander County.
What is the Percentage of People in the Labor Force in Alexander County?
58.1% of People are in the Labor Force in Alexander County.
What is the Unemployment Rate in Alexander County?
Unemployment Rate in Alexander County is 5.6%.