Zip Codes with the Highest Percentage of Population Employed in Security & Protection in Inver Grove Heights, MN
RELATED REPORTS & OPTIONS
Security & Protection
Inver Grove Heights
Compare Zip Codes
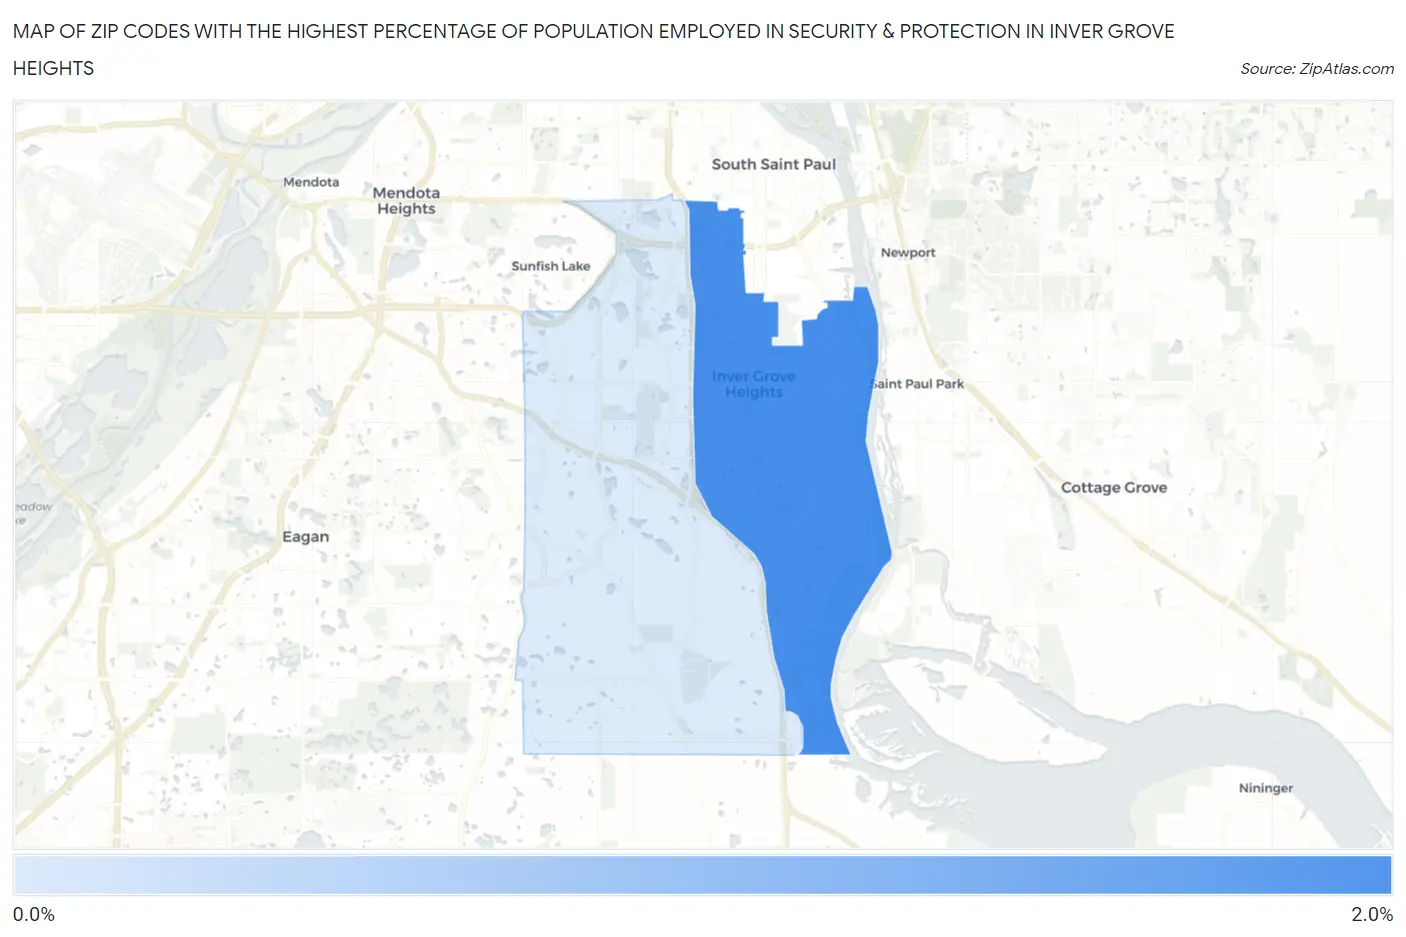
Map of Zip Codes with the Highest Percentage of Population Employed in Security & Protection in Inver Grove Heights
0.81%
1.9%
Zip Codes with the Highest Percentage of Population Employed in Security & Protection in Inver Grove Heights, MN
| Zip Code | % Employed | vs State | vs National | |
| 1. | 55076 | 1.9% | 1.3%(+0.540)#187 | 2.1%(-0.289)#13,494 |
| 2. | 55077 | 0.81% | 1.3%(-0.507)#485 | 2.1%(-1.34)#21,344 |
1
Common Questions
What are the Top Zip Codes with the Highest Percentage of Population Employed in Security & Protection in Inver Grove Heights, MN?
Top Zip Codes with the Highest Percentage of Population Employed in Security & Protection in Inver Grove Heights, MN are:
What zip code has the Highest Percentage of Population Employed in Security & Protection in Inver Grove Heights, MN?
55076 has the Highest Percentage of Population Employed in Security & Protection in Inver Grove Heights, MN with 1.9%.
What is the Percentage of Population Employed in Security & Protection in Inver Grove Heights, MN?
Percentage of Population Employed in Security & Protection in Inver Grove Heights is 1.4%.
What is the Percentage of Population Employed in Security & Protection in Minnesota?
Percentage of Population Employed in Security & Protection in Minnesota is 1.3%.
What is the Percentage of Population Employed in Security & Protection in the United States?
Percentage of Population Employed in Security & Protection in the United States is 2.1%.