Zip Codes with the Highest Percentage of Population with a Degree in Literature and Languages in Minnesota
RELATED REPORTS & OPTIONS
Literature and Languages
Minnesota
Compare Zip Codes
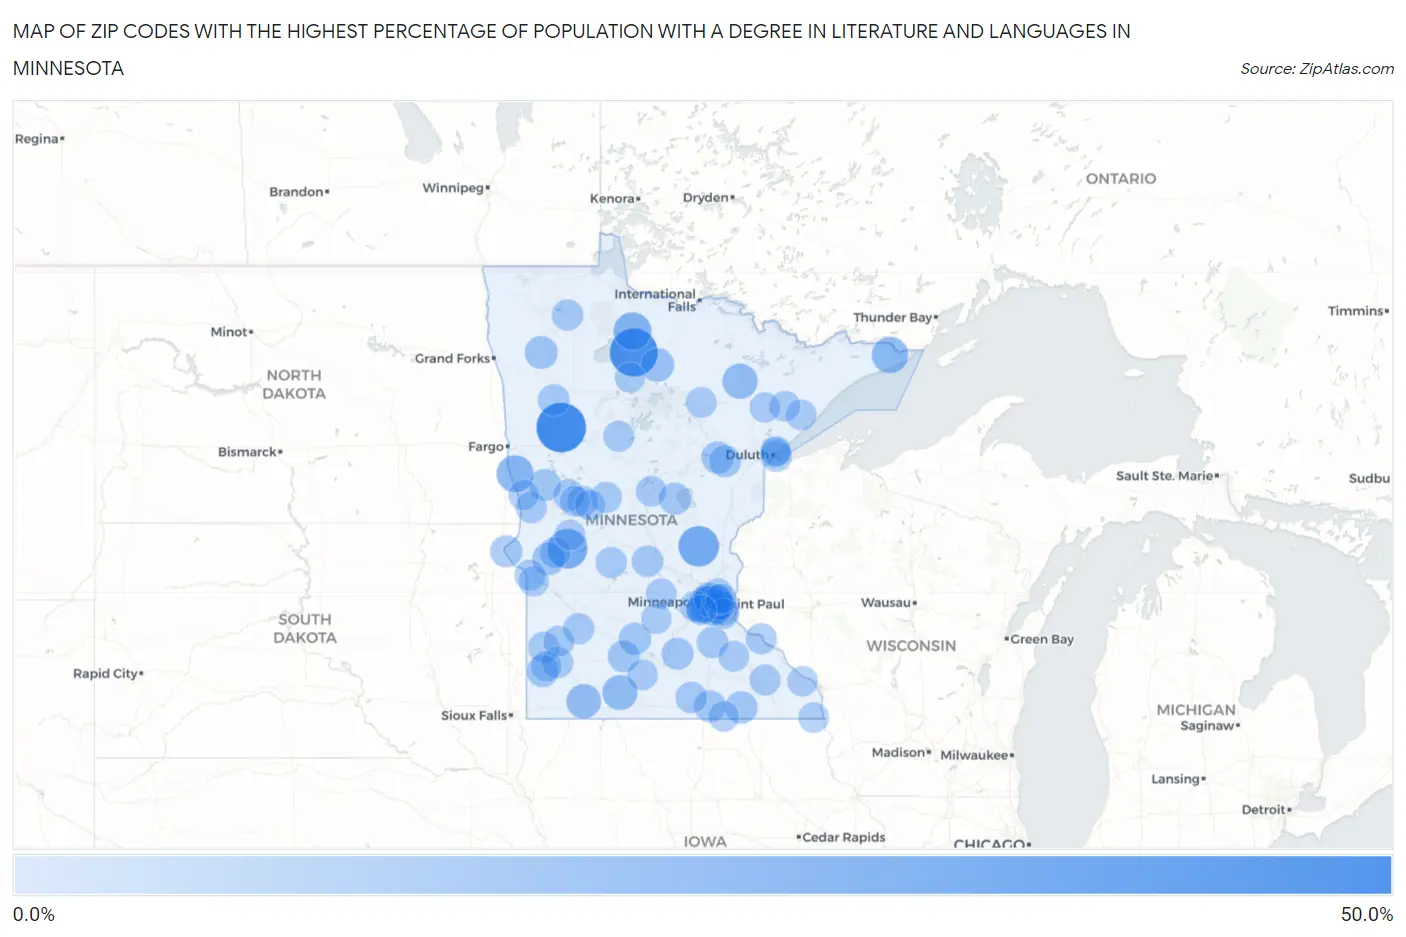
Map of Zip Codes with the Highest Percentage of Population with a Degree in Literature and Languages in Minnesota
0.0%
50.0%
Zip Codes with the Highest Percentage of Population with a Degree in Literature and Languages in Minnesota
| Zip Code | % Graduates | vs State | vs National | |
| 1. | 56591 | 45.7% | 4.6%(+41.2)#1 | 4.4%(+41.3)#91 |
| 2. | 56650 | 42.3% | 4.6%(+37.7)#2 | 4.4%(+37.9)#109 |
| 3. | 55017 | 27.0% | 4.6%(+22.5)#3 | 4.4%(+22.6)#257 |
| 4. | 56323 | 25.4% | 4.6%(+20.8)#4 | 4.4%(+21.0)#297 |
| 5. | 56685 | 21.4% | 4.6%(+16.8)#5 | 4.4%(+17.0)#423 |
| 6. | 56594 | 19.6% | 4.6%(+15.0)#6 | 4.4%(+15.2)#495 |
| 7. | 55606 | 18.6% | 4.6%(+14.0)#7 | 4.4%(+14.1)#544 |
| 8. | 55710 | 16.2% | 4.6%(+11.6)#8 | 4.4%(+11.8)#695 |
| 9. | 56160 | 15.8% | 4.6%(+11.2)#9 | 4.4%(+11.4)#744 |
| 10. | 56119 | 14.9% | 4.6%(+10.3)#10 | 4.4%(+10.5)#821 |
| 11. | 55150 | 13.0% | 4.6%(+8.45)#11 | 4.4%(+8.63)#1,043 |
| 12. | 56661 | 12.8% | 4.6%(+8.19)#12 | 4.4%(+8.37)#1,085 |
| 13. | 55406 | 11.9% | 4.6%(+7.32)#13 | 4.4%(+7.50)#1,237 |
| 14. | 55405 | 11.9% | 4.6%(+7.30)#14 | 4.4%(+7.49)#1,239 |
| 15. | 56754 | 11.4% | 4.6%(+6.84)#15 | 4.4%(+7.02)#1,351 |
| 16. | 56207 | 11.4% | 4.6%(+6.84)#16 | 4.4%(+7.02)#1,355 |
| 17. | 55103 | 11.2% | 4.6%(+6.64)#17 | 4.4%(+6.83)#1,400 |
| 18. | 55107 | 10.7% | 4.6%(+6.07)#18 | 4.4%(+6.25)#1,571 |
| 19. | 55933 | 10.6% | 4.6%(+6.04)#19 | 4.4%(+6.23)#1,581 |
| 20. | 55104 | 10.4% | 4.6%(+5.78)#20 | 4.4%(+5.97)#1,686 |
| 21. | 55787 | 10.3% | 4.6%(+5.70)#21 | 4.4%(+5.88)#1,716 |
| 22. | 55335 | 10.0% | 4.6%(+5.45)#22 | 4.4%(+5.63)#1,799 |
| 23. | 56450 | 10.0% | 4.6%(+5.41)#23 | 4.4%(+5.59)#1,819 |
| 24. | 56219 | 10.0% | 4.6%(+5.41)#24 | 4.4%(+5.59)#1,820 |
| 25. | 56533 | 10.0% | 4.6%(+5.41)#25 | 4.4%(+5.59)#1,828 |
| 26. | 55404 | 9.9% | 4.6%(+5.32)#26 | 4.4%(+5.51)#1,864 |
| 27. | 56085 | 9.9% | 4.6%(+5.31)#27 | 4.4%(+5.50)#1,871 |
| 28. | 56017 | 9.8% | 4.6%(+5.18)#28 | 4.4%(+5.36)#1,926 |
| 29. | 55798 | 9.7% | 4.6%(+5.12)#29 | 4.4%(+5.30)#1,954 |
| 30. | 56139 | 9.4% | 4.6%(+4.78)#30 | 4.4%(+4.97)#2,104 |
| 31. | 55409 | 9.3% | 4.6%(+4.74)#31 | 4.4%(+4.93)#2,128 |
| 32. | 56043 | 9.3% | 4.6%(+4.71)#32 | 4.4%(+4.89)#2,145 |
| 33. | 55417 | 9.3% | 4.6%(+4.67)#33 | 4.4%(+4.86)#2,167 |
| 34. | 56516 | 9.1% | 4.6%(+4.50)#34 | 4.4%(+4.68)#2,277 |
| 35. | 55105 | 9.0% | 4.6%(+4.44)#35 | 4.4%(+4.63)#2,301 |
| 36. | 56369 | 9.0% | 4.6%(+4.36)#36 | 4.4%(+4.55)#2,341 |
| 37. | 55102 | 8.8% | 4.6%(+4.19)#37 | 4.4%(+4.38)#2,426 |
| 38. | 55413 | 8.7% | 4.6%(+4.14)#38 | 4.4%(+4.33)#2,447 |
| 39. | 56032 | 8.7% | 4.6%(+4.10)#39 | 4.4%(+4.29)#2,487 |
| 40. | 55057 | 8.6% | 4.6%(+4.01)#40 | 4.4%(+4.20)#2,541 |
| 41. | 56515 | 8.6% | 4.6%(+3.96)#41 | 4.4%(+4.15)#2,574 |
| 42. | 55407 | 8.5% | 4.6%(+3.92)#42 | 4.4%(+4.10)#2,610 |
| 43. | 55108 | 8.5% | 4.6%(+3.86)#43 | 4.4%(+4.04)#2,644 |
| 44. | 56267 | 8.4% | 4.6%(+3.80)#44 | 4.4%(+3.99)#2,680 |
| 45. | 56522 | 8.3% | 4.6%(+3.74)#45 | 4.4%(+3.92)#2,728 |
| 46. | 56113 | 8.3% | 4.6%(+3.74)#46 | 4.4%(+3.92)#2,735 |
| 47. | 56724 | 8.3% | 4.6%(+3.74)#47 | 4.4%(+3.92)#2,739 |
| 48. | 56115 | 8.3% | 4.6%(+3.68)#48 | 4.4%(+3.86)#2,766 |
| 49. | 56297 | 8.3% | 4.6%(+3.66)#49 | 4.4%(+3.85)#2,776 |
| 50. | 55802 | 8.2% | 4.6%(+3.61)#50 | 4.4%(+3.79)#2,816 |
| 51. | 56312 | 8.2% | 4.6%(+3.57)#51 | 4.4%(+3.75)#2,851 |
| 52. | 55120 | 8.1% | 4.6%(+3.52)#52 | 4.4%(+3.71)#2,890 |
| 53. | 56437 | 8.1% | 4.6%(+3.48)#53 | 4.4%(+3.66)#2,925 |
| 54. | 55026 | 7.9% | 4.6%(+3.30)#54 | 4.4%(+3.49)#3,069 |
| 55. | 55419 | 7.8% | 4.6%(+3.25)#55 | 4.4%(+3.43)#3,120 |
| 56. | 55116 | 7.7% | 4.6%(+3.12)#56 | 4.4%(+3.31)#3,236 |
| 57. | 56239 | 7.7% | 4.6%(+3.10)#57 | 4.4%(+3.28)#3,267 |
| 58. | 56467 | 7.7% | 4.6%(+3.07)#58 | 4.4%(+3.25)#3,292 |
| 59. | 55934 | 7.7% | 4.6%(+3.06)#59 | 4.4%(+3.25)#3,297 |
| 60. | 56588 | 7.6% | 4.6%(+3.00)#60 | 4.4%(+3.19)#3,354 |
| 61. | 55424 | 7.5% | 4.6%(+2.93)#61 | 4.4%(+3.12)#3,414 |
| 62. | 55408 | 7.5% | 4.6%(+2.90)#62 | 4.4%(+3.08)#3,449 |
| 63. | 55127 | 7.5% | 4.6%(+2.88)#63 | 4.4%(+3.06)#3,469 |
| 64. | 56278 | 7.5% | 4.6%(+2.88)#64 | 4.4%(+3.06)#3,472 |
| 65. | 55414 | 7.5% | 4.6%(+2.86)#65 | 4.4%(+3.04)#3,491 |
| 66. | 56425 | 7.4% | 4.6%(+2.84)#66 | 4.4%(+3.02)#3,516 |
| 67. | 55709 | 7.4% | 4.6%(+2.82)#67 | 4.4%(+3.00)#3,532 |
| 68. | 55983 | 7.4% | 4.6%(+2.81)#68 | 4.4%(+3.00)#3,539 |
| 69. | 55436 | 7.4% | 4.6%(+2.76)#69 | 4.4%(+2.94)#3,599 |
| 70. | 55403 | 7.3% | 4.6%(+2.73)#70 | 4.4%(+2.91)#3,635 |
| 71. | 55055 | 7.3% | 4.6%(+2.68)#71 | 4.4%(+2.87)#3,677 |
| 72. | 55101 | 7.3% | 4.6%(+2.68)#72 | 4.4%(+2.86)#3,688 |
| 73. | 55113 | 7.2% | 4.6%(+2.63)#73 | 4.4%(+2.82)#3,729 |
| 74. | 55616 | 7.2% | 4.6%(+2.63)#74 | 4.4%(+2.81)#3,736 |
| 75. | 55345 | 7.2% | 4.6%(+2.57)#75 | 4.4%(+2.76)#3,786 |
| 76. | 56170 | 7.1% | 4.6%(+2.55)#76 | 4.4%(+2.73)#3,819 |
| 77. | 55602 | 7.1% | 4.6%(+2.49)#77 | 4.4%(+2.67)#3,904 |
| 78. | 56062 | 7.1% | 4.6%(+2.48)#78 | 4.4%(+2.66)#3,916 |
| 79. | 55953 | 7.1% | 4.6%(+2.48)#79 | 4.4%(+2.66)#3,919 |
| 80. | 56524 | 7.0% | 4.6%(+2.42)#80 | 4.4%(+2.61)#3,976 |
| 81. | 56361 | 7.0% | 4.6%(+2.41)#81 | 4.4%(+2.59)#3,992 |
| 82. | 55349 | 7.0% | 4.6%(+2.40)#82 | 4.4%(+2.58)#4,000 |
| 83. | 56343 | 7.0% | 4.6%(+2.40)#83 | 4.4%(+2.58)#4,004 |
| 84. | 55454 | 6.9% | 4.6%(+2.35)#84 | 4.4%(+2.53)#4,065 |
| 85. | 56520 | 6.9% | 4.6%(+2.34)#85 | 4.4%(+2.53)#4,069 |
| 86. | 55763 | 6.9% | 4.6%(+2.30)#86 | 4.4%(+2.49)#4,113 |
| 87. | 55336 | 6.9% | 4.6%(+2.29)#87 | 4.4%(+2.47)#4,132 |
| 88. | 55931 | 6.8% | 4.6%(+2.16)#88 | 4.4%(+2.35)#4,294 |
| 89. | 55418 | 6.8% | 4.6%(+2.16)#89 | 4.4%(+2.35)#4,297 |
| 90. | 55118 | 6.8% | 4.6%(+2.16)#90 | 4.4%(+2.34)#4,300 |
| 91. | 55106 | 6.7% | 4.6%(+2.13)#91 | 4.4%(+2.32)#4,333 |
| 92. | 55987 | 6.7% | 4.6%(+2.12)#92 | 4.4%(+2.30)#4,345 |
| 93. | 56276 | 6.7% | 4.6%(+2.07)#93 | 4.4%(+2.26)#4,411 |
| 94. | 55117 | 6.7% | 4.6%(+2.06)#94 | 4.4%(+2.24)#4,431 |
| 95. | 55805 | 6.6% | 4.6%(+2.04)#95 | 4.4%(+2.22)#4,453 |
| 96. | 55071 | 6.6% | 4.6%(+1.98)#96 | 4.4%(+2.17)#4,533 |
| 97. | 56647 | 6.5% | 4.6%(+1.93)#97 | 4.4%(+2.11)#4,611 |
| 98. | 55109 | 6.5% | 4.6%(+1.90)#98 | 4.4%(+2.08)#4,652 |
| 99. | 55812 | 6.5% | 4.6%(+1.89)#99 | 4.4%(+2.08)#4,662 |
| 100. | 55439 | 6.5% | 4.6%(+1.87)#100 | 4.4%(+2.05)#4,700 |
Common Questions
What are the Top 10 Zip Codes with the Highest Percentage of Population with a Degree in Literature and Languages in Minnesota?
Top 10 Zip Codes with the Highest Percentage of Population with a Degree in Literature and Languages in Minnesota are:
What zip code has the Highest Percentage of Population with a Degree in Literature and Languages in Minnesota?
56591 has the Highest Percentage of Population with a Degree in Literature and Languages in Minnesota with 45.7%.
What is the Percentage of Population with a Degree in Literature and Languages in the State of Minnesota?
Percentage of Population with a Degree in Literature and Languages in Minnesota is 4.6%.
What is the Percentage of Population with a Degree in Literature and Languages in the United States?
Percentage of Population with a Degree in Literature and Languages in the United States is 4.4%.