Zip Codes with the Highest Percentage of Families with Income Below $10,000 in Minnesota
RELATED REPORTS & OPTIONS
Family Income | $0-10k
Minnesota
Compare Zip Codes
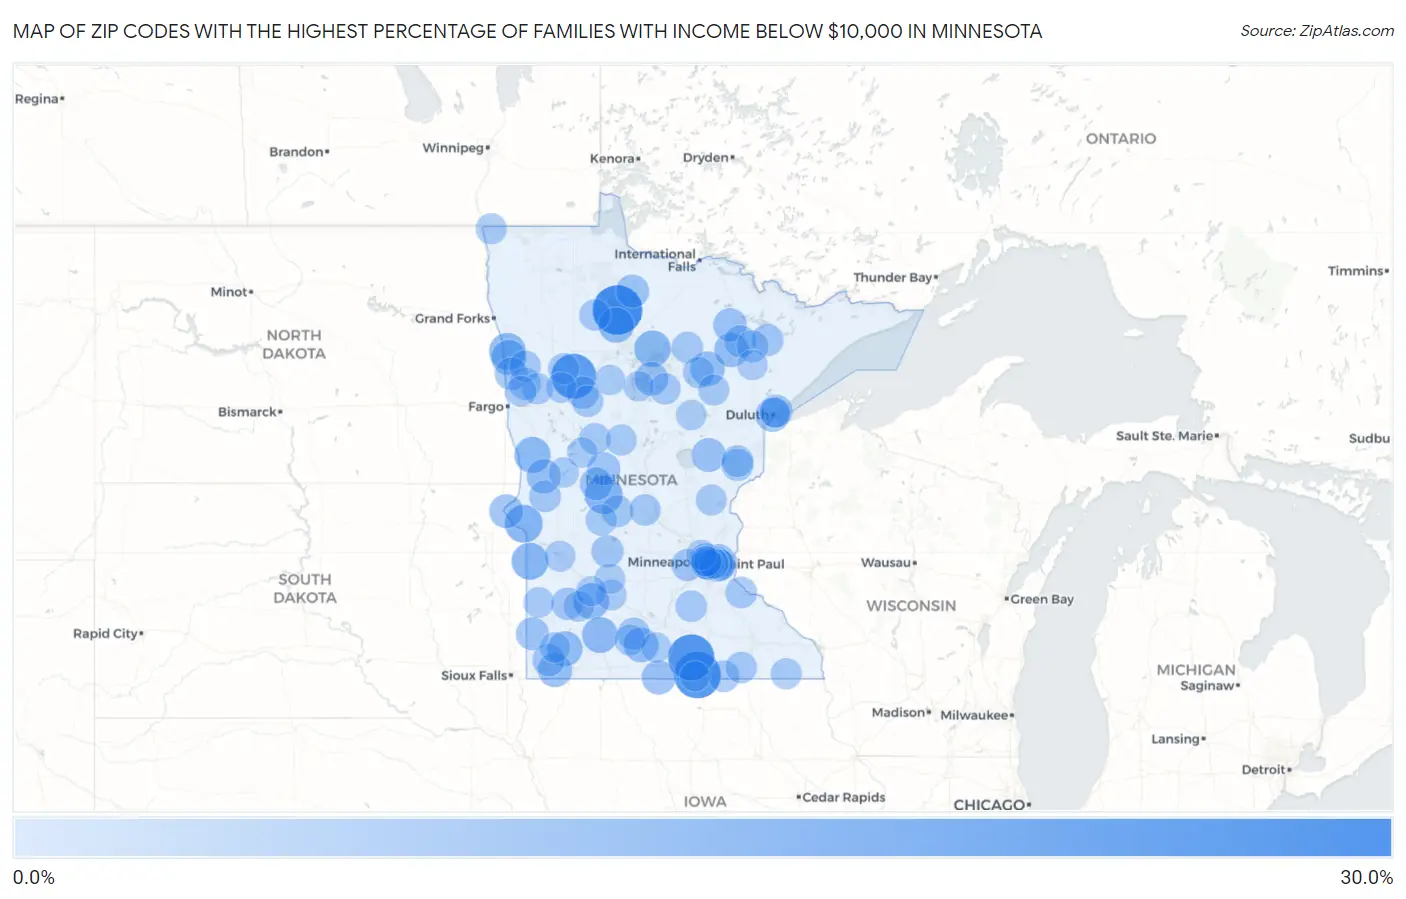
Map of Zip Codes with the Highest Percentage of Families with Income Below $10,000 in Minnesota
0.0%
30.0%
Zip Codes with the Highest Percentage of Families with Income Below $10,000 in Minnesota
| Zip Code | Families with Income < $10k | vs State | vs National | |
| 1. | 56666 | 28.8% | 1.8%(+27.0)#1 | 3.1%(+25.7)#213 |
| 2. | 56089 | 25.0% | 1.8%(+23.2)#2 | 3.1%(+21.9)#305 |
| 3. | 56032 | 24.4% | 1.8%(+22.6)#3 | 3.1%(+21.3)#320 |
| 4. | 56566 | 22.6% | 1.8%(+20.8)#4 | 3.1%(+19.5)#384 |
| 5. | 56225 | 13.6% | 1.8%(+11.8)#5 | 3.1%(+10.5)#1,038 |
| 6. | 56389 | 13.6% | 1.8%(+11.8)#6 | 3.1%(+10.5)#1,040 |
| 7. | 56257 | 12.4% | 1.8%(+10.6)#7 | 3.1%(+9.30)#1,253 |
| 8. | 56568 | 11.9% | 1.8%(+10.1)#8 | 3.1%(+8.80)#1,366 |
| 9. | 56681 | 11.8% | 1.8%(+10.00)#9 | 3.1%(+8.70)#1,386 |
| 10. | 56543 | 11.3% | 1.8%(+9.50)#10 | 3.1%(+8.20)#1,525 |
| 11. | 56287 | 11.1% | 1.8%(+9.30)#11 | 3.1%(+8.00)#1,579 |
| 12. | 56145 | 11.0% | 1.8%(+9.20)#12 | 3.1%(+7.90)#1,606 |
| 13. | 56670 | 10.5% | 1.8%(+8.70)#13 | 3.1%(+7.40)#1,755 |
| 14. | 56581 | 10.0% | 1.8%(+8.20)#14 | 3.1%(+6.90)#1,934 |
| 15. | 56141 | 9.9% | 1.8%(+8.10)#15 | 3.1%(+6.80)#1,979 |
| 16. | 56060 | 9.5% | 1.8%(+7.70)#16 | 3.1%(+6.40)#2,142 |
| 17. | 55716 | 9.4% | 1.8%(+7.60)#17 | 3.1%(+6.30)#2,186 |
| 18. | 55719 | 8.9% | 1.8%(+7.10)#18 | 3.1%(+5.80)#2,415 |
| 19. | 56110 | 8.9% | 1.8%(+7.10)#19 | 3.1%(+5.80)#2,427 |
| 20. | 56590 | 8.9% | 1.8%(+7.10)#20 | 3.1%(+5.80)#2,445 |
| 21. | 56027 | 8.7% | 1.8%(+6.90)#21 | 3.1%(+5.60)#2,542 |
| 22. | 55130 | 8.6% | 1.8%(+6.80)#22 | 3.1%(+5.50)#2,569 |
| 23. | 55806 | 8.5% | 1.8%(+6.70)#23 | 3.1%(+5.40)#2,644 |
| 24. | 56219 | 8.5% | 1.8%(+6.70)#24 | 3.1%(+5.40)#2,681 |
| 25. | 56350 | 8.5% | 1.8%(+6.70)#25 | 3.1%(+5.40)#2,692 |
| 26. | 56641 | 8.3% | 1.8%(+6.50)#26 | 3.1%(+5.20)#2,817 |
| 27. | 55723 | 8.0% | 1.8%(+6.20)#27 | 3.1%(+4.90)#2,992 |
| 28. | 55107 | 7.9% | 1.8%(+6.10)#28 | 3.1%(+4.80)#3,031 |
| 29. | 55411 | 7.8% | 1.8%(+6.00)#29 | 3.1%(+4.70)#3,078 |
| 30. | 56685 | 7.5% | 1.8%(+5.70)#30 | 3.1%(+4.40)#3,329 |
| 31. | 56446 | 7.4% | 1.8%(+5.60)#31 | 3.1%(+4.30)#3,369 |
| 32. | 56164 | 7.3% | 1.8%(+5.50)#32 | 3.1%(+4.20)#3,419 |
| 33. | 56355 | 7.3% | 1.8%(+5.50)#33 | 3.1%(+4.20)#3,459 |
| 34. | 55812 | 7.2% | 1.8%(+5.40)#34 | 3.1%(+4.10)#3,492 |
| 35. | 55454 | 7.1% | 1.8%(+5.30)#35 | 3.1%(+4.00)#3,565 |
| 36. | 55405 | 7.0% | 1.8%(+5.20)#36 | 3.1%(+3.90)#3,636 |
| 37. | 56147 | 6.9% | 1.8%(+5.10)#37 | 3.1%(+3.80)#3,785 |
| 38. | 56550 | 6.8% | 1.8%(+5.00)#38 | 3.1%(+3.70)#3,877 |
| 39. | 55103 | 6.7% | 1.8%(+4.90)#39 | 3.1%(+3.60)#3,908 |
| 40. | 56056 | 6.7% | 1.8%(+4.90)#40 | 3.1%(+3.60)#3,983 |
| 41. | 56575 | 6.6% | 1.8%(+4.80)#41 | 3.1%(+3.50)#4,072 |
| 42. | 56258 | 6.5% | 1.8%(+4.70)#42 | 3.1%(+3.40)#4,117 |
| 43. | 56201 | 6.4% | 1.8%(+4.60)#43 | 3.1%(+3.30)#4,210 |
| 44. | 55384 | 6.4% | 1.8%(+4.60)#44 | 3.1%(+3.30)#4,262 |
| 45. | 55710 | 6.3% | 1.8%(+4.50)#45 | 3.1%(+3.20)#4,374 |
| 46. | 55732 | 6.3% | 1.8%(+4.50)#46 | 3.1%(+3.20)#4,375 |
| 47. | 55792 | 6.2% | 1.8%(+4.40)#47 | 3.1%(+3.10)#4,460 |
| 48. | 55072 | 6.0% | 1.8%(+4.20)#48 | 3.1%(+2.90)#4,700 |
| 49. | 56248 | 5.9% | 1.8%(+4.10)#49 | 3.1%(+2.80)#4,872 |
| 50. | 56519 | 5.9% | 1.8%(+4.10)#50 | 3.1%(+2.80)#4,883 |
| 51. | 56335 | 5.9% | 1.8%(+4.10)#51 | 3.1%(+2.80)#4,886 |
| 52. | 55704 | 5.8% | 1.8%(+4.00)#52 | 3.1%(+2.70)#4,981 |
| 53. | 55089 | 5.6% | 1.8%(+3.80)#53 | 3.1%(+2.50)#5,242 |
| 54. | 56570 | 5.6% | 1.8%(+3.80)#54 | 3.1%(+2.50)#5,257 |
| 55. | 55953 | 5.6% | 1.8%(+3.80)#55 | 3.1%(+2.50)#5,261 |
| 56. | 56518 | 5.6% | 1.8%(+3.80)#56 | 3.1%(+2.50)#5,279 |
| 57. | 56671 | 5.5% | 1.8%(+3.70)#57 | 3.1%(+2.40)#5,377 |
| 58. | 56510 | 5.5% | 1.8%(+3.70)#58 | 3.1%(+2.40)#5,384 |
| 59. | 55933 | 5.5% | 1.8%(+3.70)#59 | 3.1%(+2.40)#5,421 |
| 60. | 56657 | 5.5% | 1.8%(+3.70)#60 | 3.1%(+2.40)#5,422 |
| 61. | 55414 | 5.4% | 1.8%(+3.60)#61 | 3.1%(+2.30)#5,446 |
| 62. | 56069 | 5.4% | 1.8%(+3.60)#62 | 3.1%(+2.30)#5,514 |
| 63. | 56672 | 5.4% | 1.8%(+3.60)#63 | 3.1%(+2.30)#5,543 |
| 64. | 55106 | 5.3% | 1.8%(+3.50)#64 | 3.1%(+2.20)#5,591 |
| 65. | 56374 | 5.3% | 1.8%(+3.50)#65 | 3.1%(+2.20)#5,643 |
| 66. | 55722 | 5.3% | 1.8%(+3.50)#66 | 3.1%(+2.20)#5,708 |
| 67. | 56316 | 5.2% | 1.8%(+3.40)#67 | 3.1%(+2.10)#5,873 |
| 68. | 56557 | 5.0% | 1.8%(+3.20)#68 | 3.1%(+1.90)#6,183 |
| 69. | 56585 | 5.0% | 1.8%(+3.20)#69 | 3.1%(+1.90)#6,212 |
| 70. | 56081 | 4.9% | 1.8%(+3.10)#70 | 3.1%(+1.80)#6,330 |
| 71. | 55114 | 4.9% | 1.8%(+3.10)#71 | 3.1%(+1.80)#6,353 |
| 72. | 55784 | 4.9% | 1.8%(+3.10)#72 | 3.1%(+1.80)#6,409 |
| 73. | 56479 | 4.8% | 1.8%(+3.00)#73 | 3.1%(+1.70)#6,513 |
| 74. | 55006 | 4.8% | 1.8%(+3.00)#74 | 3.1%(+1.70)#6,526 |
| 75. | 55922 | 4.8% | 1.8%(+3.00)#75 | 3.1%(+1.70)#6,565 |
| 76. | 56755 | 4.8% | 1.8%(+3.00)#76 | 3.1%(+1.70)#6,596 |
| 77. | 56295 | 4.7% | 1.8%(+2.90)#77 | 3.1%(+1.60)#6,792 |
| 78. | 56270 | 4.6% | 1.8%(+2.80)#78 | 3.1%(+1.50)#6,941 |
| 79. | 56263 | 4.6% | 1.8%(+2.80)#79 | 3.1%(+1.50)#6,968 |
| 80. | 55404 | 4.5% | 1.8%(+2.70)#80 | 3.1%(+1.40)#7,009 |
| 81. | 55408 | 4.4% | 1.8%(+2.60)#81 | 3.1%(+1.30)#7,223 |
| 82. | 56142 | 4.4% | 1.8%(+2.60)#82 | 3.1%(+1.30)#7,361 |
| 83. | 56591 | 4.4% | 1.8%(+2.60)#83 | 3.1%(+1.30)#7,371 |
| 84. | 56536 | 4.4% | 1.8%(+2.60)#84 | 3.1%(+1.30)#7,383 |
| 85. | 56122 | 4.3% | 1.8%(+2.50)#85 | 3.1%(+1.20)#7,591 |
| 86. | 55407 | 4.2% | 1.8%(+2.40)#86 | 3.1%(+1.10)#7,645 |
| 87. | 55805 | 4.2% | 1.8%(+2.40)#87 | 3.1%(+1.10)#7,724 |
| 88. | 55734 | 4.2% | 1.8%(+2.40)#88 | 3.1%(+1.10)#7,745 |
| 89. | 56484 | 4.1% | 1.8%(+2.30)#89 | 3.1%(+1.000)#8,020 |
| 90. | 56277 | 4.1% | 1.8%(+2.30)#90 | 3.1%(+1.000)#8,023 |
| 91. | 56551 | 4.1% | 1.8%(+2.30)#91 | 3.1%(+1.000)#8,034 |
| 92. | 56309 | 4.1% | 1.8%(+2.30)#92 | 3.1%(+1.000)#8,065 |
| 93. | 56469 | 4.1% | 1.8%(+2.30)#93 | 3.1%(+1.000)#8,078 |
| 94. | 56029 | 4.1% | 1.8%(+2.30)#94 | 3.1%(+1.000)#8,089 |
| 95. | 55104 | 4.0% | 1.8%(+2.20)#95 | 3.1%(+0.900)#8,124 |
| 96. | 55428 | 4.0% | 1.8%(+2.20)#96 | 3.1%(+0.900)#8,149 |
| 97. | 55403 | 4.0% | 1.8%(+2.20)#97 | 3.1%(+0.900)#8,193 |
| 98. | 56010 | 4.0% | 1.8%(+2.20)#98 | 3.1%(+0.900)#8,324 |
| 99. | 56214 | 4.0% | 1.8%(+2.20)#99 | 3.1%(+0.900)#8,344 |
| 100. | 56458 | 4.0% | 1.8%(+2.20)#100 | 3.1%(+0.900)#8,353 |
Common Questions
What are the Top 10 Zip Codes with the Highest Percentage of Families with Income Below $10,000 in Minnesota?
Top 10 Zip Codes with the Highest Percentage of Families with Income Below $10,000 in Minnesota are:
What zip code has the Highest Percentage of Families with Income Below $10,000 in Minnesota?
56666 has the Highest Percentage of Families with Income Below $10,000 in Minnesota with 28.8%.
What is the Percentage of Families with Income Below $10,000 in the State of Minnesota?
Percentage of Families with Income Below $10,000 in Minnesota is 1.8%.
What is the Percentage of Families with Income Below $10,000 in the United States?
Percentage of Families with Income Below $10,000 in the United States is 3.1%.