Zip Codes with the Highest Percentage of Population with a Degree in Physical and Health Sciences in Minnesota
RELATED REPORTS & OPTIONS
Physical and Health Sciences
Minnesota
Compare Zip Codes
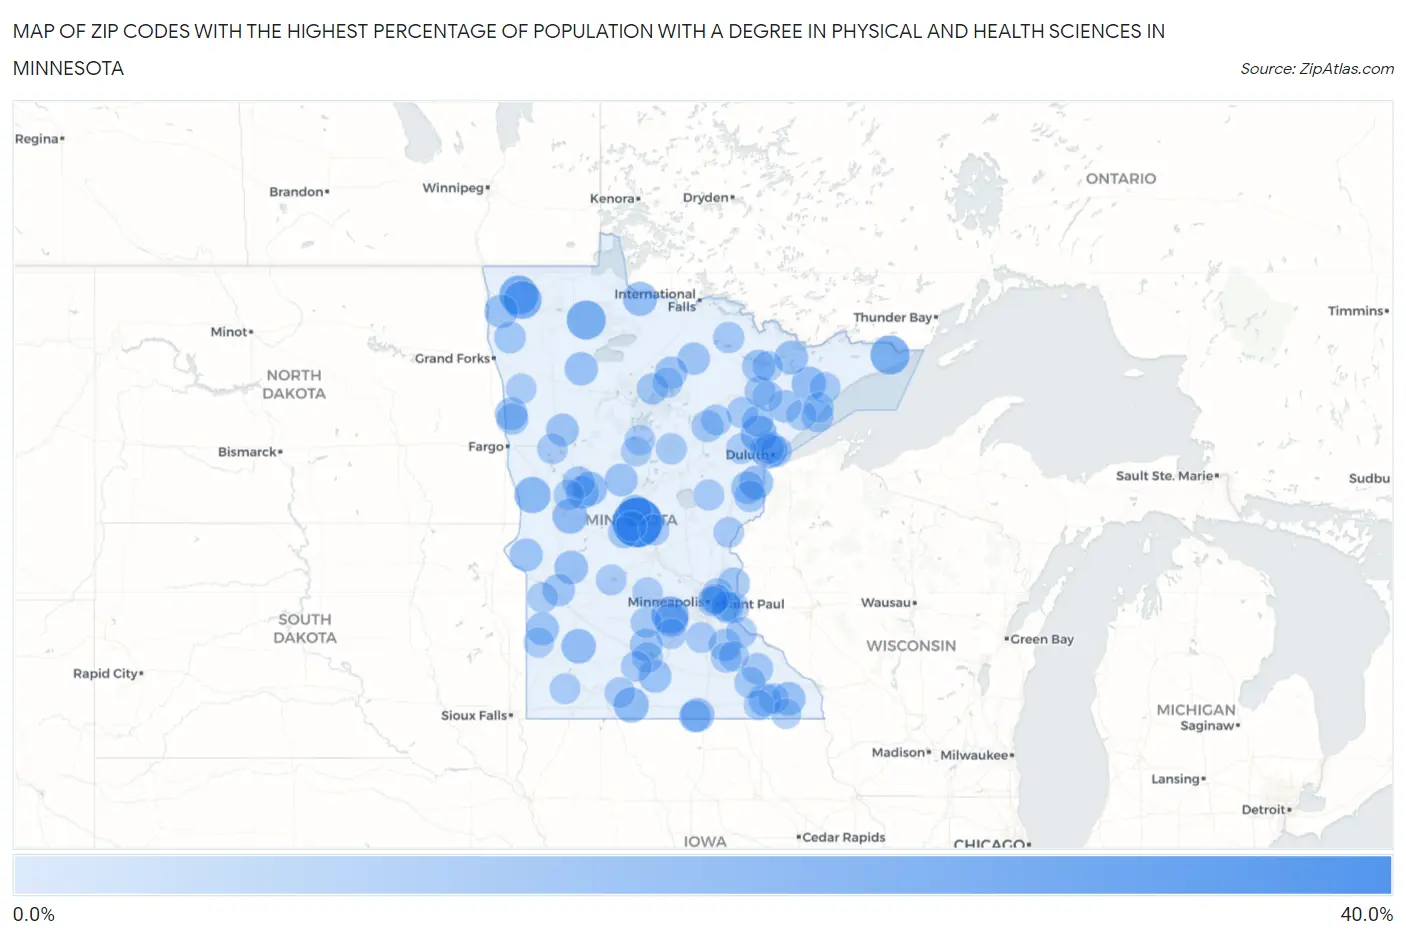
Map of Zip Codes with the Highest Percentage of Population with a Degree in Physical and Health Sciences in Minnesota
0.0%
40.0%
Zip Codes with the Highest Percentage of Population with a Degree in Physical and Health Sciences in Minnesota
| Zip Code | % Graduates | vs State | vs National | |
| 1. | 56328 | 40.0% | 2.9%(+37.1)#1 | 3.1%(+36.9)#105 |
| 2. | 55606 | 20.6% | 2.9%(+17.8)#2 | 3.1%(+17.5)#389 |
| 3. | 56727 | 20.5% | 2.9%(+17.7)#3 | 3.1%(+17.4)#394 |
| 4. | 56729 | 20.0% | 2.9%(+17.1)#4 | 3.1%(+16.9)#410 |
| 5. | 56732 | 18.6% | 2.9%(+15.7)#5 | 3.1%(+15.5)#469 |
| 6. | 55397 | 17.4% | 2.9%(+14.5)#6 | 3.1%(+14.3)#529 |
| 7. | 55814 | 16.7% | 2.9%(+13.8)#7 | 3.1%(+13.6)#565 |
| 8. | 55717 | 15.6% | 2.9%(+12.8)#8 | 3.1%(+12.5)#621 |
| 9. | 56543 | 15.4% | 2.9%(+12.5)#9 | 3.1%(+12.3)#641 |
| 10. | 56181 | 13.5% | 2.9%(+10.7)#10 | 3.1%(+10.4)#819 |
| 11. | 56326 | 13.1% | 2.9%(+10.3)#11 | 3.1%(+10.0)#859 |
| 12. | 56263 | 12.3% | 2.9%(+9.45)#12 | 3.1%(+9.21)#971 |
| 13. | 55607 | 12.3% | 2.9%(+9.43)#13 | 3.1%(+9.18)#975 |
| 14. | 56623 | 12.0% | 2.9%(+9.11)#14 | 3.1%(+8.86)#1,009 |
| 15. | 56527 | 11.8% | 2.9%(+8.99)#15 | 3.1%(+8.74)#1,025 |
| 16. | 55368 | 11.1% | 2.9%(+8.26)#16 | 3.1%(+8.01)#1,138 |
| 17. | 56089 | 11.1% | 2.9%(+8.26)#17 | 3.1%(+8.01)#1,148 |
| 18. | 55749 | 10.9% | 2.9%(+8.08)#18 | 3.1%(+7.84)#1,177 |
| 19. | 56226 | 10.7% | 2.9%(+7.86)#19 | 3.1%(+7.61)#1,223 |
| 20. | 55796 | 10.7% | 2.9%(+7.86)#20 | 3.1%(+7.61)#1,224 |
| 21. | 55962 | 10.6% | 2.9%(+7.74)#21 | 3.1%(+7.49)#1,243 |
| 22. | 56757 | 10.4% | 2.9%(+7.51)#22 | 3.1%(+7.26)#1,283 |
| 23. | 56644 | 10.1% | 2.9%(+7.27)#23 | 3.1%(+7.03)#1,336 |
| 24. | 56551 | 9.9% | 2.9%(+7.08)#24 | 3.1%(+6.83)#1,387 |
| 25. | 55790 | 9.9% | 2.9%(+7.03)#25 | 3.1%(+6.79)#1,398 |
| 26. | 56240 | 9.6% | 2.9%(+6.80)#26 | 3.1%(+6.55)#1,455 |
| 27. | 56034 | 9.6% | 2.9%(+6.74)#27 | 3.1%(+6.49)#1,470 |
| 28. | 56479 | 9.5% | 2.9%(+6.62)#28 | 3.1%(+6.37)#1,501 |
| 29. | 56475 | 9.5% | 2.9%(+6.61)#29 | 3.1%(+6.36)#1,508 |
| 30. | 56280 | 9.5% | 2.9%(+6.61)#30 | 3.1%(+6.36)#1,509 |
| 31. | 55990 | 9.3% | 2.9%(+6.48)#31 | 3.1%(+6.23)#1,544 |
| 32. | 56569 | 9.1% | 2.9%(+6.29)#32 | 3.1%(+6.04)#1,609 |
| 33. | 56054 | 9.1% | 2.9%(+6.24)#33 | 3.1%(+5.99)#1,628 |
| 34. | 55756 | 9.1% | 2.9%(+6.24)#34 | 3.1%(+5.99)#1,636 |
| 35. | 56550 | 8.9% | 2.9%(+6.04)#35 | 3.1%(+5.79)#1,705 |
| 36. | 55602 | 8.8% | 2.9%(+6.00)#36 | 3.1%(+5.75)#1,717 |
| 37. | 56639 | 8.7% | 2.9%(+5.84)#37 | 3.1%(+5.60)#1,771 |
| 38. | 56688 | 8.7% | 2.9%(+5.84)#38 | 3.1%(+5.60)#1,773 |
| 39. | 56262 | 8.6% | 2.9%(+5.76)#39 | 3.1%(+5.51)#1,800 |
| 40. | 55047 | 8.5% | 2.9%(+5.63)#40 | 3.1%(+5.38)#1,843 |
| 41. | 56571 | 8.4% | 2.9%(+5.50)#41 | 3.1%(+5.25)#1,879 |
| 42. | 55018 | 8.3% | 2.9%(+5.48)#42 | 3.1%(+5.23)#1,891 |
| 43. | 55793 | 8.0% | 2.9%(+5.10)#43 | 3.1%(+4.85)#2,037 |
| 44. | 56574 | 7.7% | 2.9%(+4.84)#44 | 3.1%(+4.59)#2,155 |
| 45. | 55601 | 7.7% | 2.9%(+4.84)#45 | 3.1%(+4.59)#2,157 |
| 46. | 56029 | 7.6% | 2.9%(+4.72)#46 | 3.1%(+4.48)#2,211 |
| 47. | 56762 | 7.3% | 2.9%(+4.45)#47 | 3.1%(+4.20)#2,351 |
| 48. | 55712 | 7.3% | 2.9%(+4.40)#48 | 3.1%(+4.16)#2,380 |
| 49. | 55129 | 7.0% | 2.9%(+4.13)#49 | 3.1%(+3.89)#2,514 |
| 50. | 55738 | 6.9% | 2.9%(+4.09)#50 | 3.1%(+3.84)#2,541 |
| 51. | 56336 | 6.9% | 2.9%(+4.06)#51 | 3.1%(+3.81)#2,563 |
| 52. | 55906 | 6.9% | 2.9%(+4.06)#52 | 3.1%(+3.81)#2,564 |
| 53. | 56681 | 6.9% | 2.9%(+4.04)#53 | 3.1%(+3.80)#2,579 |
| 54. | 55812 | 6.9% | 2.9%(+4.00)#54 | 3.1%(+3.76)#2,595 |
| 55. | 55724 | 6.8% | 2.9%(+3.94)#55 | 3.1%(+3.70)#2,631 |
| 56. | 55902 | 6.7% | 2.9%(+3.89)#56 | 3.1%(+3.65)#2,665 |
| 57. | 55771 | 6.6% | 2.9%(+3.78)#57 | 3.1%(+3.54)#2,745 |
| 58. | 56662 | 6.5% | 2.9%(+3.68)#58 | 3.1%(+3.44)#2,806 |
| 59. | 55127 | 6.5% | 2.9%(+3.66)#59 | 3.1%(+3.41)#2,819 |
| 60. | 56373 | 6.4% | 2.9%(+3.54)#60 | 3.1%(+3.29)#2,910 |
| 61. | 55001 | 6.2% | 2.9%(+3.40)#61 | 3.1%(+3.15)#3,029 |
| 62. | 55089 | 6.2% | 2.9%(+3.36)#62 | 3.1%(+3.11)#3,070 |
| 63. | 55312 | 6.1% | 2.9%(+3.24)#63 | 3.1%(+3.00)#3,171 |
| 64. | 55603 | 6.1% | 2.9%(+3.21)#64 | 3.1%(+2.96)#3,204 |
| 65. | 56350 | 6.1% | 2.9%(+3.21)#65 | 3.1%(+2.96)#3,205 |
| 66. | 55742 | 6.1% | 2.9%(+3.21)#66 | 3.1%(+2.96)#3,206 |
| 67. | 56021 | 6.0% | 2.9%(+3.18)#67 | 3.1%(+2.93)#3,228 |
| 68. | 55708 | 6.0% | 2.9%(+3.11)#68 | 3.1%(+2.86)#3,306 |
| 69. | 56256 | 5.8% | 2.9%(+2.98)#69 | 3.1%(+2.74)#3,434 |
| 70. | 56511 | 5.8% | 2.9%(+2.95)#70 | 3.1%(+2.71)#3,466 |
| 71. | 55946 | 5.7% | 2.9%(+2.85)#71 | 3.1%(+2.60)#3,567 |
| 72. | 55088 | 5.7% | 2.9%(+2.84)#72 | 3.1%(+2.59)#3,571 |
| 73. | 56288 | 5.6% | 2.9%(+2.71)#73 | 3.1%(+2.47)#3,729 |
| 74. | 56382 | 5.6% | 2.9%(+2.70)#74 | 3.1%(+2.46)#3,746 |
| 75. | 56141 | 5.6% | 2.9%(+2.70)#75 | 3.1%(+2.46)#3,760 |
| 76. | 56041 | 5.5% | 2.9%(+2.66)#76 | 3.1%(+2.41)#3,812 |
| 77. | 55935 | 5.5% | 2.9%(+2.62)#77 | 3.1%(+2.37)#3,873 |
| 78. | 55811 | 5.4% | 2.9%(+2.57)#78 | 3.1%(+2.33)#3,916 |
| 79. | 55063 | 5.4% | 2.9%(+2.51)#79 | 3.1%(+2.26)#4,002 |
| 80. | 55117 | 5.3% | 2.9%(+2.44)#80 | 3.1%(+2.19)#4,094 |
| 81. | 56160 | 5.3% | 2.9%(+2.41)#81 | 3.1%(+2.16)#4,142 |
| 82. | 56515 | 5.3% | 2.9%(+2.40)#82 | 3.1%(+2.16)#4,150 |
| 83. | 56452 | 5.2% | 2.9%(+2.39)#83 | 3.1%(+2.14)#4,168 |
| 84. | 55125 | 5.2% | 2.9%(+2.33)#84 | 3.1%(+2.08)#4,258 |
| 85. | 56435 | 5.2% | 2.9%(+2.30)#85 | 3.1%(+2.05)#4,301 |
| 86. | 55113 | 5.1% | 2.9%(+2.29)#86 | 3.1%(+2.04)#4,322 |
| 87. | 55325 | 5.1% | 2.9%(+2.28)#87 | 3.1%(+2.03)#4,336 |
| 88. | 56517 | 5.1% | 2.9%(+2.28)#88 | 3.1%(+2.03)#4,350 |
| 89. | 55614 | 5.1% | 2.9%(+2.27)#89 | 3.1%(+2.02)#4,364 |
| 90. | 55616 | 5.1% | 2.9%(+2.22)#90 | 3.1%(+1.98)#4,431 |
| 91. | 55705 | 5.1% | 2.9%(+2.20)#91 | 3.1%(+1.96)#4,460 |
| 92. | 55108 | 5.0% | 2.9%(+2.20)#92 | 3.1%(+1.95)#4,471 |
| 93. | 56044 | 5.0% | 2.9%(+2.19)#93 | 3.1%(+1.94)#4,477 |
| 94. | 56142 | 5.0% | 2.9%(+2.15)#94 | 3.1%(+1.90)#4,549 |
| 95. | 55711 | 5.0% | 2.9%(+2.15)#95 | 3.1%(+1.90)#4,555 |
| 96. | 55782 | 5.0% | 2.9%(+2.15)#96 | 3.1%(+1.90)#4,557 |
| 97. | 56680 | 5.0% | 2.9%(+2.15)#97 | 3.1%(+1.90)#4,563 |
| 98. | 55983 | 4.9% | 2.9%(+2.09)#98 | 3.1%(+1.84)#4,677 |
| 99. | 55922 | 4.8% | 2.9%(+1.97)#99 | 3.1%(+1.72)#4,889 |
| 100. | 55975 | 4.8% | 2.9%(+1.96)#100 | 3.1%(+1.72)#4,896 |
Common Questions
What are the Top 10 Zip Codes with the Highest Percentage of Population with a Degree in Physical and Health Sciences in Minnesota?
Top 10 Zip Codes with the Highest Percentage of Population with a Degree in Physical and Health Sciences in Minnesota are:
What zip code has the Highest Percentage of Population with a Degree in Physical and Health Sciences in Minnesota?
56328 has the Highest Percentage of Population with a Degree in Physical and Health Sciences in Minnesota with 40.0%.
What is the Percentage of Population with a Degree in Physical and Health Sciences in the State of Minnesota?
Percentage of Population with a Degree in Physical and Health Sciences in Minnesota is 2.9%.
What is the Percentage of Population with a Degree in Physical and Health Sciences in the United States?
Percentage of Population with a Degree in Physical and Health Sciences in the United States is 3.1%.