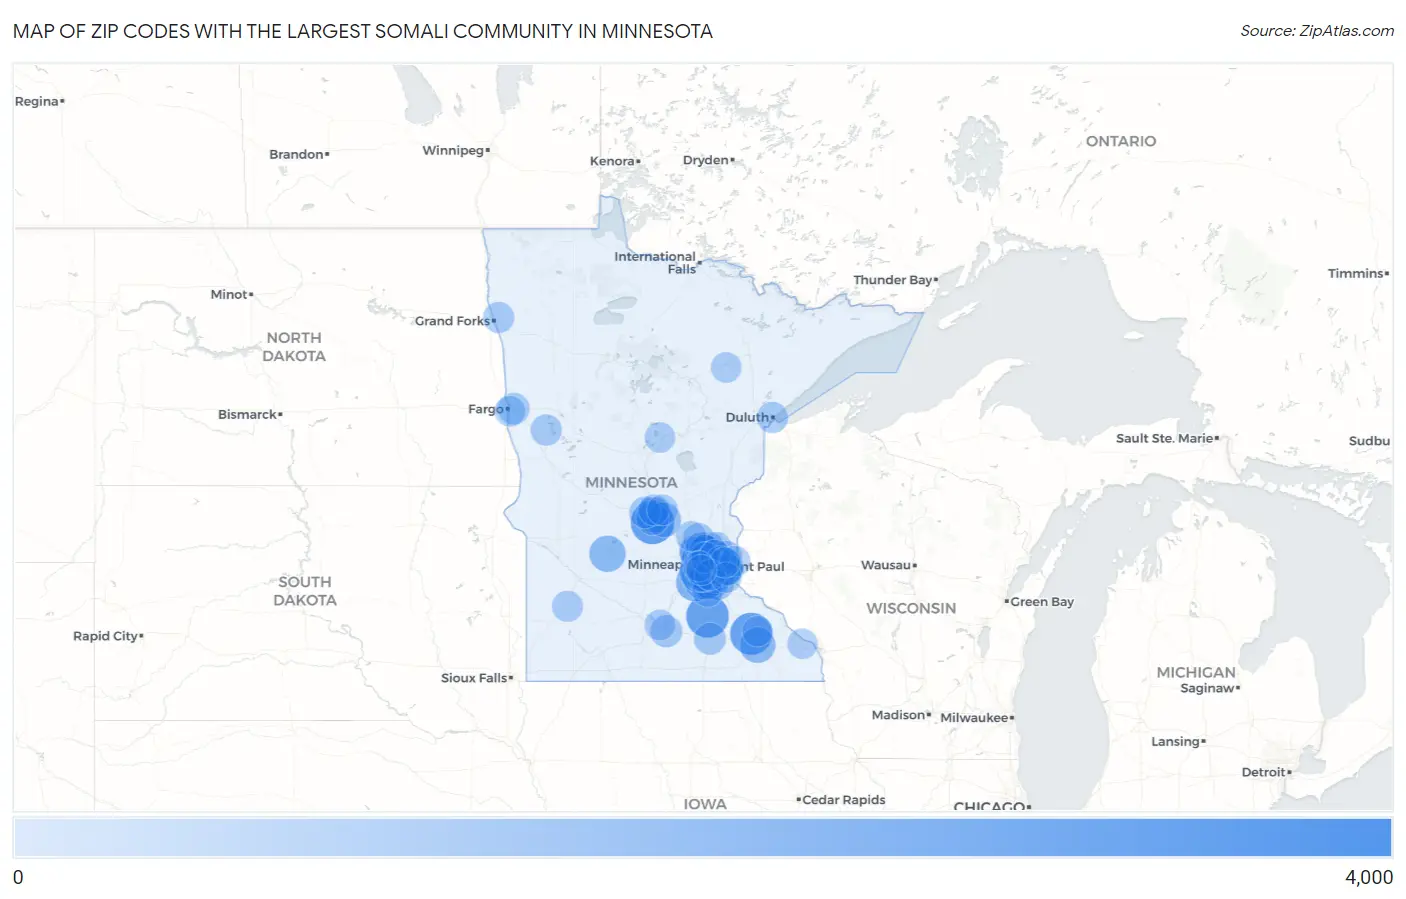
Zip Codes with the Largest Somali Community in Minnesota
RELATED REPORTS & OPTIONS
Somali
Minnesota
Compare Zip Codes
Map of Zip Codes with the Largest Somali Community in Minnesota
0
4,000
Zip Codes with the Largest Somali Community in Minnesota
| Zip Code | Somali | vs State | vs National | |
| 1. | 55411 | 3,743 | 63,569(5.89%)#1 | 167,300(2.24%)#2 |
| 2. | 55454 | 3,698 | 63,569(5.82%)#2 | 167,300(2.21%)#3 |
| 3. | 55404 | 3,476 | 63,569(5.47%)#3 | 167,300(2.08%)#5 |
| 4. | 55407 | 2,614 | 63,569(4.11%)#4 | 167,300(1.56%)#7 |
| 5. | 56301 | 2,542 | 63,569(4.00%)#5 | 167,300(1.52%)#8 |
| 6. | 55021 | 2,406 | 63,569(3.78%)#6 | 167,300(1.44%)#9 |
| 7. | 55421 | 2,317 | 63,569(3.64%)#7 | 167,300(1.38%)#10 |
| 8. | 55901 | 2,300 | 63,569(3.62%)#8 | 167,300(1.37%)#11 |
| 9. | 55119 | 1,940 | 63,569(3.05%)#9 | 167,300(1.16%)#15 |
| 10. | 55408 | 1,524 | 63,569(2.40%)#10 | 167,300(0.91%)#20 |
| 11. | 55379 | 1,463 | 63,569(2.30%)#11 | 167,300(0.87%)#22 |
| 12. | 55405 | 1,423 | 63,569(2.24%)#12 | 167,300(0.85%)#23 |
| 13. | 55420 | 1,398 | 63,569(2.20%)#13 | 167,300(0.84%)#24 |
| 14. | 55344 | 1,321 | 63,569(2.08%)#14 | 167,300(0.79%)#25 |
| 15. | 55104 | 1,269 | 63,569(2.00%)#15 | 167,300(0.76%)#26 |
| 16. | 55406 | 1,250 | 63,569(1.97%)#16 | 167,300(0.75%)#27 |
| 17. | 56201 | 1,167 | 63,569(1.84%)#17 | 167,300(0.70%)#28 |
| 18. | 55378 | 1,157 | 63,569(1.82%)#18 | 167,300(0.69%)#30 |
| 19. | 55904 | 1,070 | 63,569(1.68%)#19 | 167,300(0.64%)#32 |
| 20. | 56303 | 1,012 | 63,569(1.59%)#20 | 167,300(0.60%)#35 |
| 21. | 55337 | 994 | 63,569(1.56%)#21 | 167,300(0.59%)#37 |
| 22. | 55122 | 974 | 63,569(1.53%)#22 | 167,300(0.58%)#39 |
| 23. | 55432 | 946 | 63,569(1.49%)#23 | 167,300(0.57%)#40 |
| 24. | 55419 | 905 | 63,569(1.42%)#24 | 167,300(0.54%)#41 |
| 25. | 55418 | 856 | 63,569(1.35%)#25 | 167,300(0.51%)#42 |
| 26. | 56304 | 833 | 63,569(1.31%)#26 | 167,300(0.50%)#44 |
| 27. | 55124 | 795 | 63,569(1.25%)#27 | 167,300(0.48%)#46 |
| 28. | 55130 | 693 | 63,569(1.09%)#28 | 167,300(0.41%)#53 |
| 29. | 55103 | 678 | 63,569(1.07%)#29 | 167,300(0.41%)#56 |
| 30. | 55106 | 652 | 63,569(1.03%)#30 | 167,300(0.39%)#59 |
| 31. | 55369 | 527 | 63,569(0.83%)#31 | 167,300(0.32%)#72 |
| 32. | 55435 | 525 | 63,569(0.83%)#32 | 167,300(0.31%)#73 |
| 33. | 55113 | 515 | 63,569(0.81%)#33 | 167,300(0.31%)#74 |
| 34. | 55445 | 468 | 63,569(0.74%)#34 | 167,300(0.28%)#82 |
| 35. | 55346 | 462 | 63,569(0.73%)#35 | 167,300(0.28%)#84 |
| 36. | 55125 | 454 | 63,569(0.71%)#36 | 167,300(0.27%)#86 |
| 37. | 55068 | 445 | 63,569(0.70%)#37 | 167,300(0.27%)#87 |
| 38. | 55434 | 443 | 63,569(0.70%)#38 | 167,300(0.26%)#88 |
| 39. | 55423 | 436 | 63,569(0.69%)#39 | 167,300(0.26%)#91 |
| 40. | 56387 | 426 | 63,569(0.67%)#40 | 167,300(0.25%)#93 |
| 41. | 55120 | 417 | 63,569(0.66%)#41 | 167,300(0.25%)#95 |
| 42. | 55414 | 409 | 63,569(0.64%)#42 | 167,300(0.24%)#97 |
| 43. | 55121 | 397 | 63,569(0.62%)#43 | 167,300(0.24%)#102 |
| 44. | 55416 | 382 | 63,569(0.60%)#44 | 167,300(0.23%)#103 |
| 45. | 55428 | 381 | 63,569(0.60%)#45 | 167,300(0.23%)#104 |
| 46. | 56001 | 353 | 63,569(0.56%)#46 | 167,300(0.21%)#117 |
| 47. | 55343 | 347 | 63,569(0.55%)#47 | 167,300(0.21%)#121 |
| 48. | 55117 | 346 | 63,569(0.54%)#48 | 167,300(0.21%)#122 |
| 49. | 55306 | 338 | 63,569(0.53%)#49 | 167,300(0.20%)#126 |
| 50. | 55413 | 338 | 63,569(0.53%)#50 | 167,300(0.20%)#127 |
| 51. | 55107 | 336 | 63,569(0.53%)#51 | 167,300(0.20%)#129 |
| 52. | 55060 | 328 | 63,569(0.52%)#52 | 167,300(0.20%)#132 |
| 53. | 55448 | 314 | 63,569(0.49%)#53 | 167,300(0.19%)#135 |
| 54. | 55112 | 299 | 63,569(0.47%)#54 | 167,300(0.18%)#141 |
| 55. | 56374 | 280 | 63,569(0.44%)#55 | 167,300(0.17%)#148 |
| 56. | 55422 | 258 | 63,569(0.41%)#56 | 167,300(0.15%)#160 |
| 57. | 55347 | 255 | 63,569(0.40%)#57 | 167,300(0.15%)#162 |
| 58. | 55311 | 249 | 63,569(0.39%)#58 | 167,300(0.15%)#165 |
| 59. | 56529 | 235 | 63,569(0.37%)#59 | 167,300(0.14%)#173 |
| 60. | 55443 | 198 | 63,569(0.31%)#60 | 167,300(0.12%)#196 |
| 61. | 55303 | 193 | 63,569(0.30%)#61 | 167,300(0.12%)#200 |
| 62. | 56572 | 188 | 63,569(0.30%)#62 | 167,300(0.11%)#201 |
| 63. | 55431 | 174 | 63,569(0.27%)#63 | 167,300(0.10%)#208 |
| 64. | 55806 | 172 | 63,569(0.27%)#64 | 167,300(0.10%)#211 |
| 65. | 55014 | 167 | 63,569(0.26%)#65 | 167,300(0.10%)#218 |
| 66. | 55417 | 166 | 63,569(0.26%)#66 | 167,300(0.10%)#220 |
| 67. | 55115 | 165 | 63,569(0.26%)#67 | 167,300(0.10%)#221 |
| 68. | 55123 | 161 | 63,569(0.25%)#68 | 167,300(0.10%)#225 |
| 69. | 55102 | 161 | 63,569(0.25%)#69 | 167,300(0.10%)#226 |
| 70. | 56721 | 158 | 63,569(0.25%)#70 | 167,300(0.09%)#227 |
| 71. | 55316 | 157 | 63,569(0.25%)#71 | 167,300(0.09%)#229 |
| 72. | 56258 | 143 | 63,569(0.22%)#72 | 167,300(0.09%)#244 |
| 73. | 55437 | 139 | 63,569(0.22%)#73 | 167,300(0.08%)#249 |
| 74. | 55114 | 135 | 63,569(0.21%)#74 | 167,300(0.08%)#254 |
| 75. | 55108 | 130 | 63,569(0.20%)#75 | 167,300(0.08%)#264 |
| 76. | 55426 | 126 | 63,569(0.20%)#76 | 167,300(0.08%)#274 |
| 77. | 56377 | 126 | 63,569(0.20%)#77 | 167,300(0.08%)#275 |
| 78. | 55044 | 125 | 63,569(0.20%)#78 | 167,300(0.07%)#276 |
| 79. | 55075 | 123 | 63,569(0.19%)#79 | 167,300(0.07%)#282 |
| 80. | 55438 | 123 | 63,569(0.19%)#80 | 167,300(0.07%)#283 |
| 81. | 55433 | 119 | 63,569(0.19%)#81 | 167,300(0.07%)#288 |
| 82. | 55129 | 119 | 63,569(0.19%)#82 | 167,300(0.07%)#289 |
| 83. | 55429 | 117 | 63,569(0.18%)#83 | 167,300(0.07%)#291 |
| 84. | 56003 | 115 | 63,569(0.18%)#84 | 167,300(0.07%)#296 |
| 85. | 55430 | 109 | 63,569(0.17%)#85 | 167,300(0.07%)#304 |
| 86. | 55109 | 104 | 63,569(0.16%)#86 | 167,300(0.06%)#312 |
| 87. | 56379 | 100 | 63,569(0.16%)#87 | 167,300(0.06%)#319 |
| 88. | 55126 | 93 | 63,569(0.15%)#88 | 167,300(0.06%)#325 |
| 89. | 55425 | 89 | 63,569(0.14%)#89 | 167,300(0.05%)#329 |
| 90. | 56560 | 66 | 63,569(0.10%)#90 | 167,300(0.04%)#380 |
| 91. | 55746 | 63 | 63,569(0.10%)#91 | 167,300(0.04%)#395 |
| 92. | 55906 | 56 | 63,569(0.09%)#92 | 167,300(0.03%)#406 |
| 93. | 55003 | 55 | 63,569(0.09%)#93 | 167,300(0.03%)#410 |
| 94. | 55016 | 54 | 63,569(0.08%)#94 | 167,300(0.03%)#412 |
| 95. | 56465 | 48 | 63,569(0.08%)#95 | 167,300(0.03%)#436 |
| 96. | 55987 | 41 | 63,569(0.06%)#96 | 167,300(0.02%)#458 |
| 97. | 55128 | 41 | 63,569(0.06%)#97 | 167,300(0.02%)#459 |
| 98. | 55305 | 37 | 63,569(0.06%)#98 | 167,300(0.02%)#467 |
| 99. | 55330 | 33 | 63,569(0.05%)#99 | 167,300(0.02%)#482 |
| 100. | 55436 | 32 | 63,569(0.05%)#100 | 167,300(0.02%)#491 |
Common Questions
What are the Top 10 Zip Codes with the Largest Somali Community in Minnesota?
Top 10 Zip Codes with the Largest Somali Community in Minnesota are:
What zip code has the Largest Somali Community in Minnesota?
55411 has the Largest Somali Community in Minnesota with 3,743.
What is the Total Somali Population in the State of Minnesota?
Total Somali Population in Minnesota is 63,569.
What is the Total Somali Population in the United States?
Total Somali Population in the United States is 167,300.