Zip Codes with the Highest Percentage of Population with a Degree in Business in Minnesota
RELATED REPORTS & OPTIONS
Business
Minnesota
Compare Zip Codes
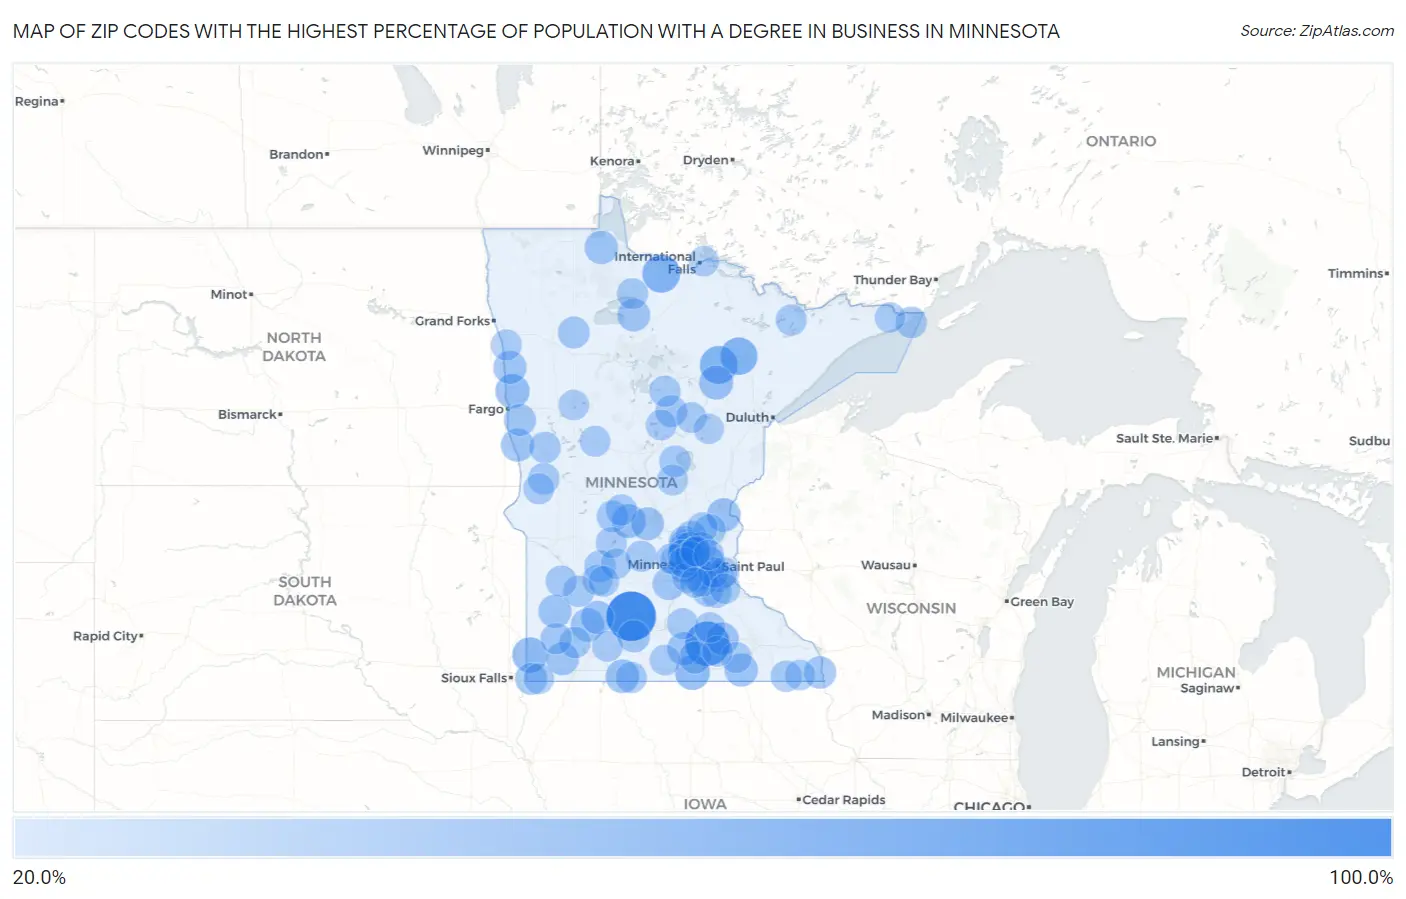
Map of Zip Codes with the Highest Percentage of Population with a Degree in Business in Minnesota
20.0%
100.0%
Zip Codes with the Highest Percentage of Population with a Degree in Business in Minnesota
| Zip Code | % Graduates | vs State | vs National | |
| 1. | 56030 | 100.0% | 18.9%(+81.1)#1 | 19.5%(+80.5)#180 |
| 2. | 56046 | 80.0% | 18.9%(+61.1)#2 | 19.5%(+60.5)#229 |
| 3. | 55753 | 54.2% | 18.9%(+35.3)#3 | 19.5%(+34.7)#535 |
| 4. | 56629 | 53.8% | 18.9%(+35.0)#4 | 19.5%(+34.3)#543 |
| 5. | 55758 | 52.6% | 18.9%(+33.7)#5 | 19.5%(+33.1)#571 |
| 6. | 55402 | 45.7% | 18.9%(+26.8)#6 | 19.5%(+26.2)#857 |
| 7. | 56144 | 44.4% | 18.9%(+25.6)#7 | 19.5%(+24.9)#913 |
| 8. | 56020 | 42.9% | 18.9%(+24.0)#8 | 19.5%(+23.4)#1,021 |
| 9. | 56546 | 40.0% | 18.9%(+21.1)#9 | 19.5%(+20.5)#1,227 |
| 10. | 55742 | 39.4% | 18.9%(+20.5)#10 | 19.5%(+19.9)#1,275 |
| 11. | 56376 | 38.5% | 18.9%(+19.6)#11 | 19.5%(+19.0)#1,339 |
| 12. | 56127 | 38.1% | 18.9%(+19.2)#12 | 19.5%(+18.6)#1,374 |
| 13. | 55032 | 37.9% | 18.9%(+19.0)#13 | 19.5%(+18.4)#1,393 |
| 14. | 56166 | 36.8% | 18.9%(+18.0)#14 | 19.5%(+17.3)#1,508 |
| 15. | 56673 | 36.7% | 18.9%(+17.9)#15 | 19.5%(+17.2)#1,520 |
| 16. | 55933 | 36.2% | 18.9%(+17.3)#16 | 19.5%(+16.7)#1,580 |
| 17. | 56553 | 36.1% | 18.9%(+17.2)#17 | 19.5%(+16.6)#1,589 |
| 18. | 56294 | 36.0% | 18.9%(+17.1)#18 | 19.5%(+16.5)#1,607 |
| 19. | 56548 | 35.8% | 18.9%(+17.0)#19 | 19.5%(+16.4)#1,620 |
| 20. | 56091 | 35.8% | 18.9%(+17.0)#20 | 19.5%(+16.4)#1,621 |
| 21. | 56157 | 35.8% | 18.9%(+17.0)#21 | 19.5%(+16.3)#1,622 |
| 22. | 56369 | 35.8% | 18.9%(+16.9)#22 | 19.5%(+16.3)#1,626 |
| 23. | 56185 | 35.2% | 18.9%(+16.3)#23 | 19.5%(+15.7)#1,704 |
| 24. | 56650 | 35.1% | 18.9%(+16.2)#24 | 19.5%(+15.6)#1,717 |
| 25. | 55301 | 34.6% | 18.9%(+15.7)#25 | 19.5%(+15.1)#1,788 |
| 26. | 55924 | 34.0% | 18.9%(+15.1)#26 | 19.5%(+14.5)#1,885 |
| 27. | 55339 | 33.9% | 18.9%(+15.0)#27 | 19.5%(+14.4)#1,901 |
| 28. | 55919 | 33.5% | 18.9%(+14.6)#28 | 19.5%(+14.0)#1,950 |
| 29. | 56042 | 33.3% | 18.9%(+14.5)#29 | 19.5%(+13.8)#1,983 |
| 30. | 56056 | 33.3% | 18.9%(+14.5)#30 | 19.5%(+13.8)#2,037 |
| 31. | 56138 | 32.3% | 18.9%(+13.4)#31 | 19.5%(+12.8)#2,191 |
| 32. | 56580 | 31.6% | 18.9%(+12.7)#32 | 19.5%(+12.1)#2,372 |
| 33. | 56662 | 31.4% | 18.9%(+12.5)#33 | 19.5%(+11.9)#2,427 |
| 34. | 56646 | 31.2% | 18.9%(+12.4)#34 | 19.5%(+11.8)#2,463 |
| 35. | 56281 | 30.7% | 18.9%(+11.8)#35 | 19.5%(+11.2)#2,630 |
| 36. | 55376 | 30.1% | 18.9%(+11.2)#36 | 19.5%(+10.6)#2,805 |
| 37. | 55005 | 30.0% | 18.9%(+11.1)#37 | 19.5%(+10.5)#2,820 |
| 38. | 56450 | 30.0% | 18.9%(+11.1)#38 | 19.5%(+10.5)#2,828 |
| 39. | 56533 | 30.0% | 18.9%(+11.1)#39 | 19.5%(+10.5)#2,836 |
| 40. | 56325 | 30.0% | 18.9%(+11.1)#40 | 19.5%(+10.5)#2,839 |
| 41. | 55341 | 29.8% | 18.9%(+11.0)#41 | 19.5%(+10.3)#2,888 |
| 42. | 56114 | 29.7% | 18.9%(+10.8)#42 | 19.5%(+10.2)#2,921 |
| 43. | 55605 | 29.6% | 18.9%(+10.7)#43 | 19.5%(+10.1)#2,964 |
| 44. | 56590 | 29.5% | 18.9%(+10.7)#44 | 19.5%(+10.0)#2,994 |
| 45. | 56151 | 29.5% | 18.9%(+10.6)#45 | 19.5%(+9.97)#3,019 |
| 46. | 56297 | 29.4% | 18.9%(+10.5)#46 | 19.5%(+9.86)#3,069 |
| 47. | 55356 | 29.2% | 18.9%(+10.3)#47 | 19.5%(+9.72)#3,122 |
| 48. | 56223 | 29.2% | 18.9%(+10.3)#48 | 19.5%(+9.67)#3,142 |
| 49. | 56352 | 29.1% | 18.9%(+10.2)#49 | 19.5%(+9.63)#3,158 |
| 50. | 55922 | 28.9% | 18.9%(+10.0)#50 | 19.5%(+9.42)#3,237 |
| 51. | 56672 | 28.9% | 18.9%(+10.0)#51 | 19.5%(+9.38)#3,253 |
| 52. | 56121 | 28.8% | 18.9%(+9.96)#52 | 19.5%(+9.35)#3,271 |
| 53. | 55364 | 28.8% | 18.9%(+9.94)#53 | 19.5%(+9.32)#3,280 |
| 54. | 55330 | 28.8% | 18.9%(+9.93)#54 | 19.5%(+9.32)#3,282 |
| 55. | 55374 | 28.8% | 18.9%(+9.91)#55 | 19.5%(+9.29)#3,293 |
| 56. | 56028 | 28.7% | 18.9%(+9.79)#56 | 19.5%(+9.17)#3,341 |
| 57. | 55796 | 28.6% | 18.9%(+9.69)#57 | 19.5%(+9.07)#3,412 |
| 58. | 56685 | 28.6% | 18.9%(+9.69)#58 | 19.5%(+9.07)#3,413 |
| 59. | 55077 | 28.5% | 18.9%(+9.59)#59 | 19.5%(+8.98)#3,440 |
| 60. | 55328 | 28.2% | 18.9%(+9.27)#60 | 19.5%(+8.66)#3,595 |
| 61. | 55324 | 28.0% | 18.9%(+9.10)#61 | 19.5%(+8.48)#3,700 |
| 62. | 56338 | 27.9% | 18.9%(+9.04)#62 | 19.5%(+8.42)#3,723 |
| 63. | 56288 | 27.9% | 18.9%(+9.03)#63 | 19.5%(+8.41)#3,730 |
| 64. | 55973 | 27.9% | 18.9%(+9.03)#64 | 19.5%(+8.41)#3,738 |
| 65. | 56518 | 27.8% | 18.9%(+8.90)#65 | 19.5%(+8.28)#3,801 |
| 66. | 55316 | 27.7% | 18.9%(+8.83)#66 | 19.5%(+8.22)#3,820 |
| 67. | 55917 | 27.7% | 18.9%(+8.80)#67 | 19.5%(+8.19)#3,831 |
| 68. | 56523 | 27.7% | 18.9%(+8.80)#68 | 19.5%(+8.18)#3,838 |
| 69. | 56284 | 27.5% | 18.9%(+8.58)#69 | 19.5%(+7.96)#3,950 |
| 70. | 56274 | 27.5% | 18.9%(+8.57)#70 | 19.5%(+7.95)#3,960 |
| 71. | 56118 | 27.4% | 18.9%(+8.50)#71 | 19.5%(+7.88)#4,001 |
| 72. | 55024 | 27.3% | 18.9%(+8.46)#72 | 19.5%(+7.84)#4,023 |
| 73. | 56023 | 27.3% | 18.9%(+8.39)#73 | 19.5%(+7.77)#4,058 |
| 74. | 56442 | 27.1% | 18.9%(+8.26)#74 | 19.5%(+7.64)#4,125 |
| 75. | 55055 | 27.1% | 18.9%(+8.21)#75 | 19.5%(+7.59)#4,150 |
| 76. | 55044 | 26.9% | 18.9%(+8.06)#76 | 19.5%(+7.45)#4,221 |
| 77. | 55347 | 26.9% | 18.9%(+8.06)#77 | 19.5%(+7.45)#4,222 |
| 78. | 56469 | 26.9% | 18.9%(+8.04)#78 | 19.5%(+7.42)#4,235 |
| 79. | 55363 | 26.9% | 18.9%(+8.02)#79 | 19.5%(+7.40)#4,250 |
| 80. | 55373 | 26.9% | 18.9%(+7.97)#80 | 19.5%(+7.35)#4,282 |
| 81. | 55378 | 26.7% | 18.9%(+7.79)#81 | 19.5%(+7.18)#4,397 |
| 82. | 56173 | 26.7% | 18.9%(+7.78)#82 | 19.5%(+7.17)#4,421 |
| 83. | 55318 | 26.6% | 18.9%(+7.75)#83 | 19.5%(+7.14)#4,440 |
| 84. | 56253 | 26.6% | 18.9%(+7.73)#84 | 19.5%(+7.11)#4,455 |
| 85. | 56230 | 26.6% | 18.9%(+7.70)#85 | 19.5%(+7.08)#4,481 |
| 86. | 55340 | 26.6% | 18.9%(+7.68)#86 | 19.5%(+7.07)#4,496 |
| 87. | 55049 | 26.5% | 18.9%(+7.63)#87 | 19.5%(+7.02)#4,536 |
| 88. | 55120 | 26.5% | 18.9%(+7.63)#88 | 19.5%(+7.01)#4,538 |
| 89. | 56578 | 26.4% | 18.9%(+7.49)#89 | 19.5%(+6.87)#4,632 |
| 90. | 55070 | 26.3% | 18.9%(+7.46)#90 | 19.5%(+6.84)#4,649 |
| 91. | 55311 | 26.3% | 18.9%(+7.40)#91 | 19.5%(+6.78)#4,696 |
| 92. | 55085 | 26.1% | 18.9%(+7.21)#92 | 19.5%(+6.59)#4,821 |
| 93. | 55974 | 26.1% | 18.9%(+7.19)#93 | 19.5%(+6.58)#4,832 |
| 94. | 56668 | 26.0% | 18.9%(+7.12)#94 | 19.5%(+6.50)#4,880 |
| 95. | 55760 | 26.0% | 18.9%(+7.08)#95 | 19.5%(+6.47)#4,904 |
| 96. | 55359 | 25.9% | 18.9%(+7.05)#96 | 19.5%(+6.43)#4,928 |
| 97. | 55379 | 25.9% | 18.9%(+6.99)#97 | 19.5%(+6.38)#4,972 |
| 98. | 55606 | 25.8% | 18.9%(+6.89)#98 | 19.5%(+6.27)#5,038 |
| 99. | 55369 | 25.8% | 18.9%(+6.88)#99 | 19.5%(+6.26)#5,047 |
| 100. | 55432 | 25.7% | 18.9%(+6.86)#100 | 19.5%(+6.24)#5,063 |
Common Questions
What are the Top 10 Zip Codes with the Highest Percentage of Population with a Degree in Business in Minnesota?
Top 10 Zip Codes with the Highest Percentage of Population with a Degree in Business in Minnesota are:
What zip code has the Highest Percentage of Population with a Degree in Business in Minnesota?
56030 has the Highest Percentage of Population with a Degree in Business in Minnesota with 100.0%.
What is the Percentage of Population with a Degree in Business in the State of Minnesota?
Percentage of Population with a Degree in Business in Minnesota is 18.9%.
What is the Percentage of Population with a Degree in Business in the United States?
Percentage of Population with a Degree in Business in the United States is 19.5%.