Zip Codes with the Highest Percentage of Households Without a Vehicle in Minnesota
RELATED REPORTS & OPTIONS
Households without a Cars
Minnesota
Compare Zip Codes
Map of Zip Codes with the Highest Percentage of Households Without a Vehicle in Minnesota
0.0%
50.0%
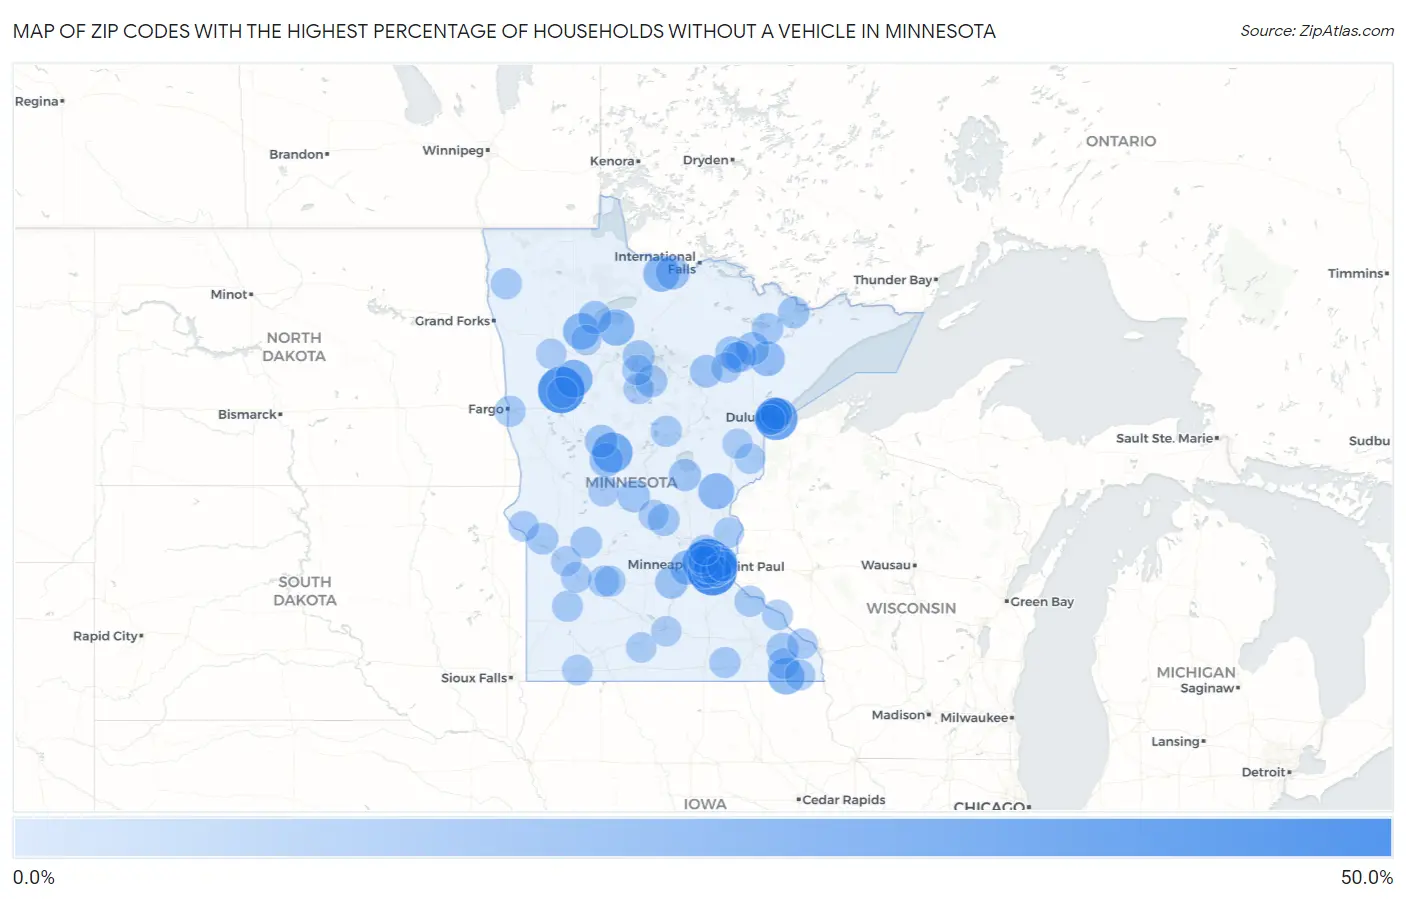
Zip Codes with the Highest Percentage of Households Without a Vehicle in Minnesota
| Zip Code | Housholds Without a Car | vs State | vs National | |
| 1. | 55402 | 44.3% | 6.6%(+37.7)#1 | 8.3%(+36.0)#419 |
| 2. | 55454 | 43.3% | 6.6%(+36.7)#2 | 8.3%(+35.0)#440 |
| 3. | 55111 | 42.0% | 6.6%(+35.4)#3 | 8.3%(+33.7)#473 |
| 4. | 56591 | 38.6% | 6.6%(+32.0)#4 | 8.3%(+30.3)#544 |
| 5. | 55404 | 35.0% | 6.6%(+28.4)#5 | 8.3%(+26.7)#636 |
| 6. | 55802 | 31.2% | 6.6%(+24.6)#6 | 8.3%(+22.9)#759 |
| 7. | 55403 | 27.9% | 6.6%(+21.3)#7 | 8.3%(+19.6)#894 |
| 8. | 55103 | 26.9% | 6.6%(+20.3)#8 | 8.3%(+18.6)#948 |
| 9. | 56434 | 26.7% | 6.6%(+20.1)#9 | 8.3%(+18.4)#967 |
| 10. | 55414 | 25.8% | 6.6%(+19.2)#10 | 8.3%(+17.5)#1,016 |
| 11. | 55411 | 23.1% | 6.6%(+16.5)#11 | 8.3%(+14.8)#1,203 |
| 12. | 56566 | 22.3% | 6.6%(+15.7)#12 | 8.3%(+14.0)#1,278 |
| 13. | 56644 | 20.0% | 6.6%(+13.4)#13 | 8.3%(+11.7)#1,507 |
| 14. | 55101 | 19.9% | 6.6%(+13.3)#14 | 8.3%(+11.6)#1,518 |
| 15. | 55922 | 19.9% | 6.6%(+13.3)#15 | 8.3%(+11.6)#1,519 |
| 16. | 56670 | 19.5% | 6.6%(+12.9)#16 | 8.3%(+11.2)#1,572 |
| 17. | 55130 | 19.3% | 6.6%(+12.7)#17 | 8.3%(+11.0)#1,593 |
| 18. | 56629 | 19.0% | 6.6%(+12.4)#18 | 8.3%(+10.7)#1,639 |
| 19. | 55036 | 19.0% | 6.6%(+12.4)#19 | 8.3%(+10.7)#1,643 |
| 20. | 55415 | 18.8% | 6.6%(+12.2)#20 | 8.3%(+10.5)#1,670 |
| 21. | 55405 | 18.2% | 6.6%(+11.6)#21 | 8.3%(+9.90)#1,750 |
| 22. | 55805 | 17.1% | 6.6%(+10.5)#22 | 8.3%(+8.80)#1,939 |
| 23. | 55705 | 16.7% | 6.6%(+10.1)#23 | 8.3%(+8.40)#2,014 |
| 24. | 55116 | 16.6% | 6.6%(+10.00)#24 | 8.3%(+8.30)#2,036 |
| 25. | 55384 | 16.2% | 6.6%(+9.60)#25 | 8.3%(+7.90)#2,118 |
| 26. | 55806 | 16.1% | 6.6%(+9.50)#26 | 8.3%(+7.80)#2,129 |
| 27. | 55114 | 16.1% | 6.6%(+9.50)#27 | 8.3%(+7.80)#2,134 |
| 28. | 56654 | 15.0% | 6.6%(+8.40)#28 | 8.3%(+6.70)#2,405 |
| 29. | 56437 | 14.6% | 6.6%(+8.00)#29 | 8.3%(+6.30)#2,508 |
| 30. | 55792 | 14.1% | 6.6%(+7.50)#30 | 8.3%(+5.80)#2,673 |
| 31. | 56671 | 13.8% | 6.6%(+7.20)#31 | 8.3%(+5.50)#2,780 |
| 32. | 55106 | 13.7% | 6.6%(+7.10)#32 | 8.3%(+5.40)#2,799 |
| 33. | 56482 | 13.3% | 6.6%(+6.70)#33 | 8.3%(+5.00)#2,979 |
| 34. | 55104 | 12.8% | 6.6%(+6.20)#34 | 8.3%(+4.50)#3,175 |
| 35. | 55435 | 12.8% | 6.6%(+6.20)#35 | 8.3%(+4.50)#3,187 |
| 36. | 55401 | 12.8% | 6.6%(+6.20)#36 | 8.3%(+4.50)#3,188 |
| 37. | 55408 | 12.7% | 6.6%(+6.10)#37 | 8.3%(+4.40)#3,221 |
| 38. | 55368 | 12.7% | 6.6%(+6.10)#38 | 8.3%(+4.40)#3,251 |
| 39. | 55764 | 12.7% | 6.6%(+6.10)#39 | 8.3%(+4.40)#3,258 |
| 40. | 56384 | 12.4% | 6.6%(+5.80)#40 | 8.3%(+4.10)#3,400 |
| 41. | 55102 | 12.3% | 6.6%(+5.70)#41 | 8.3%(+4.00)#3,420 |
| 42. | 55719 | 12.2% | 6.6%(+5.60)#42 | 8.3%(+3.90)#3,466 |
| 43. | 56359 | 12.1% | 6.6%(+5.50)#43 | 8.3%(+3.80)#3,526 |
| 44. | 56663 | 11.8% | 6.6%(+5.20)#44 | 8.3%(+3.50)#3,704 |
| 45. | 55107 | 11.7% | 6.6%(+5.10)#45 | 8.3%(+3.40)#3,718 |
| 46. | 56641 | 11.7% | 6.6%(+5.10)#46 | 8.3%(+3.40)#3,745 |
| 47. | 55407 | 11.6% | 6.6%(+5.00)#47 | 8.3%(+3.30)#3,754 |
| 48. | 55412 | 11.6% | 6.6%(+5.00)#48 | 8.3%(+3.30)#3,765 |
| 49. | 56304 | 11.6% | 6.6%(+5.00)#49 | 8.3%(+3.30)#3,771 |
| 50. | 55979 | 11.6% | 6.6%(+5.00)#50 | 8.3%(+3.30)#3,800 |
| 51. | 55117 | 11.5% | 6.6%(+4.90)#51 | 8.3%(+3.20)#3,817 |
| 52. | 55429 | 11.5% | 6.6%(+4.90)#52 | 8.3%(+3.20)#3,822 |
| 53. | 55413 | 11.5% | 6.6%(+4.90)#53 | 8.3%(+3.20)#3,833 |
| 54. | 55421 | 11.4% | 6.6%(+4.80)#54 | 8.3%(+3.10)#3,886 |
| 55. | 55731 | 11.3% | 6.6%(+4.70)#55 | 8.3%(+3.00)#3,963 |
| 56. | 56227 | 11.1% | 6.6%(+4.50)#56 | 8.3%(+2.80)#4,115 |
| 57. | 55782 | 11.0% | 6.6%(+4.40)#57 | 8.3%(+2.70)#4,170 |
| 58. | 56271 | 10.9% | 6.6%(+4.30)#58 | 8.3%(+2.60)#4,225 |
| 59. | 55406 | 10.6% | 6.6%(+4.00)#59 | 8.3%(+2.30)#4,383 |
| 60. | 55109 | 10.5% | 6.6%(+3.90)#60 | 8.3%(+2.20)#4,454 |
| 61. | 56230 | 10.4% | 6.6%(+3.80)#61 | 8.3%(+2.10)#4,599 |
| 62. | 55418 | 10.3% | 6.6%(+3.70)#62 | 8.3%(+2.00)#4,624 |
| 63. | 55812 | 10.3% | 6.6%(+3.70)#63 | 8.3%(+2.00)#4,650 |
| 64. | 55768 | 10.3% | 6.6%(+3.70)#64 | 8.3%(+2.00)#4,667 |
| 65. | 56713 | 10.2% | 6.6%(+3.60)#65 | 8.3%(+1.90)#4,749 |
| 66. | 55950 | 10.2% | 6.6%(+3.60)#66 | 8.3%(+1.90)#4,759 |
| 67. | 55423 | 10.1% | 6.6%(+3.50)#67 | 8.3%(+1.80)#4,768 |
| 68. | 55066 | 10.1% | 6.6%(+3.50)#68 | 8.3%(+1.80)#4,787 |
| 69. | 56441 | 10.1% | 6.6%(+3.50)#69 | 8.3%(+1.80)#4,808 |
| 70. | 55949 | 10.1% | 6.6%(+3.50)#70 | 8.3%(+1.80)#4,815 |
| 71. | 56569 | 10.1% | 6.6%(+3.50)#71 | 8.3%(+1.80)#4,818 |
| 72. | 55428 | 10.0% | 6.6%(+3.40)#72 | 8.3%(+1.70)#4,851 |
| 73. | 56560 | 9.9% | 6.6%(+3.30)#73 | 8.3%(+1.60)#4,927 |
| 74. | 56258 | 9.8% | 6.6%(+3.20)#74 | 8.3%(+1.50)#5,033 |
| 75. | 56277 | 9.8% | 6.6%(+3.20)#75 | 8.3%(+1.50)#5,061 |
| 76. | 55422 | 9.7% | 6.6%(+3.10)#76 | 8.3%(+1.40)#5,102 |
| 77. | 55118 | 9.6% | 6.6%(+3.00)#77 | 8.3%(+1.30)#5,194 |
| 78. | 56484 | 9.5% | 6.6%(+2.90)#78 | 8.3%(+1.20)#5,306 |
| 79. | 55974 | 9.4% | 6.6%(+2.80)#79 | 8.3%(+1.10)#5,389 |
| 80. | 55713 | 9.4% | 6.6%(+2.80)#80 | 8.3%(+1.10)#5,395 |
| 81. | 55119 | 9.3% | 6.6%(+2.70)#81 | 8.3%(+1.00)#5,417 |
| 82. | 55433 | 9.3% | 6.6%(+2.70)#82 | 8.3%(+1.00)#5,426 |
| 83. | 55981 | 9.3% | 6.6%(+2.70)#83 | 8.3%(+1.00)#5,471 |
| 84. | 55987 | 9.2% | 6.6%(+2.60)#84 | 8.3%(+0.900)#5,518 |
| 85. | 56187 | 9.2% | 6.6%(+2.60)#85 | 8.3%(+0.900)#5,538 |
| 86. | 56633 | 9.2% | 6.6%(+2.60)#86 | 8.3%(+0.900)#5,563 |
| 87. | 56360 | 9.2% | 6.6%(+2.60)#87 | 8.3%(+0.900)#5,567 |
| 88. | 56241 | 9.2% | 6.6%(+2.60)#88 | 8.3%(+0.900)#5,568 |
| 89. | 56225 | 9.2% | 6.6%(+2.60)#89 | 8.3%(+0.900)#5,604 |
| 90. | 55746 | 9.1% | 6.6%(+2.50)#90 | 8.3%(+0.800)#5,635 |
| 91. | 56303 | 9.0% | 6.6%(+2.40)#91 | 8.3%(+0.700)#5,741 |
| 92. | 56060 | 9.0% | 6.6%(+2.40)#92 | 8.3%(+0.700)#5,817 |
| 93. | 56265 | 8.9% | 6.6%(+2.30)#93 | 8.3%(+0.600)#5,872 |
| 94. | 56634 | 8.9% | 6.6%(+2.30)#94 | 8.3%(+0.600)#5,904 |
| 95. | 55712 | 8.9% | 6.6%(+2.30)#95 | 8.3%(+0.600)#5,928 |
| 96. | 55013 | 8.8% | 6.6%(+2.20)#96 | 8.3%(+0.500)#5,990 |
| 97. | 56592 | 8.8% | 6.6%(+2.20)#97 | 8.3%(+0.500)#6,034 |
| 98. | 56001 | 8.7% | 6.6%(+2.10)#98 | 8.3%(+0.400)#6,051 |
| 99. | 55807 | 8.7% | 6.6%(+2.10)#99 | 8.3%(+0.400)#6,096 |
| 100. | 55767 | 8.7% | 6.6%(+2.10)#100 | 8.3%(+0.400)#6,107 |
Common Questions
What are the Top 10 Zip Codes with the Highest Percentage of Households Without a Vehicle in Minnesota?
Top 10 Zip Codes with the Highest Percentage of Households Without a Vehicle in Minnesota are:
What zip code has the Highest Percentage of Households Without a Vehicle in Minnesota?
55402 has the Highest Percentage of Households Without a Vehicle in Minnesota with 44.3%.
What is the Percentage of Households Without a Vehicle in the State of Minnesota?
Percentage of Households Without a Vehicle in Minnesota is 6.6%.
What is the Percentage of Households Without a Vehicle in the United States?
Percentage of Households Without a Vehicle in the United States is 8.3%.