Zip Codes with the Highest Percentage of Population with a Degree in Engineering in Minnesota
RELATED REPORTS & OPTIONS
Engineering
Minnesota
Compare Zip Codes
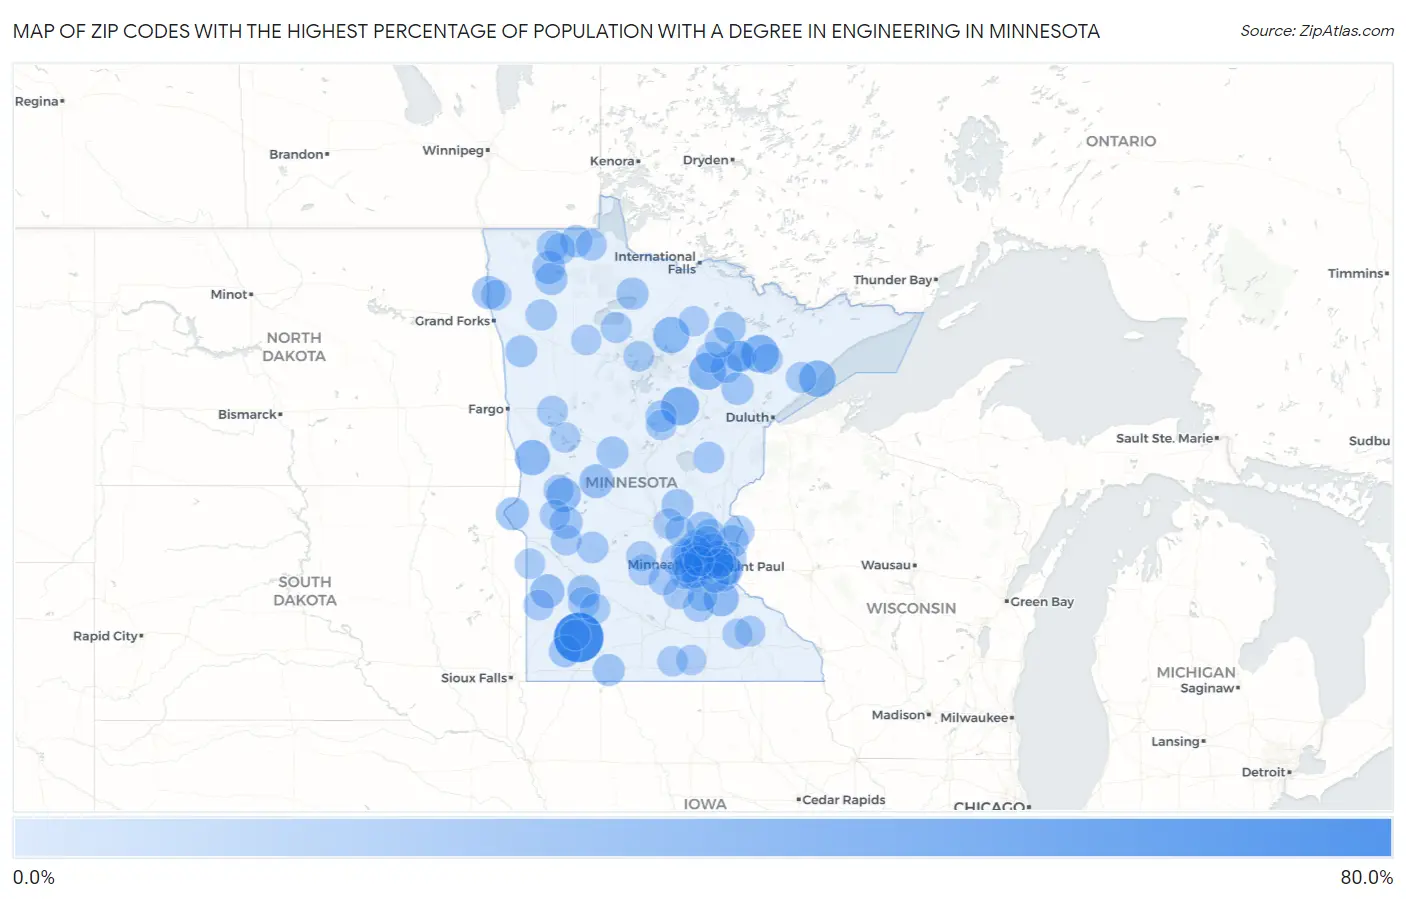
Map of Zip Codes with the Highest Percentage of Population with a Degree in Engineering in Minnesota
0.0%
80.0%
Zip Codes with the Highest Percentage of Population with a Degree in Engineering in Minnesota
| Zip Code | % Graduates | vs State | vs National | |
| 1. | 56125 | 66.7% | 6.3%(+60.4)#1 | 7.6%(+59.0)#79 |
| 2. | 55785 | 32.1% | 6.3%(+25.9)#2 | 7.6%(+24.5)#329 |
| 3. | 55708 | 30.5% | 6.3%(+24.2)#3 | 7.6%(+22.8)#364 |
| 4. | 55716 | 28.6% | 6.3%(+22.3)#4 | 7.6%(+20.9)#411 |
| 5. | 55601 | 26.9% | 6.3%(+20.7)#5 | 7.6%(+19.3)#466 |
| 6. | 56688 | 26.1% | 6.3%(+19.8)#6 | 7.6%(+18.4)#496 |
| 7. | 56543 | 23.1% | 6.3%(+16.8)#7 | 7.6%(+15.4)#649 |
| 8. | 55065 | 22.4% | 6.3%(+16.1)#8 | 7.6%(+14.7)#693 |
| 9. | 56339 | 20.2% | 6.3%(+13.9)#9 | 7.6%(+12.5)#892 |
| 10. | 56319 | 19.3% | 6.3%(+13.0)#10 | 7.6%(+11.6)#994 |
| 11. | 56291 | 19.1% | 6.3%(+12.9)#11 | 7.6%(+11.5)#1,010 |
| 12. | 55446 | 16.6% | 6.3%(+10.3)#12 | 7.6%(+8.92)#1,393 |
| 13. | 56744 | 16.4% | 6.3%(+10.1)#13 | 7.6%(+8.72)#1,424 |
| 14. | 56211 | 16.2% | 6.3%(+9.96)#14 | 7.6%(+8.57)#1,459 |
| 15. | 56759 | 15.9% | 6.3%(+9.65)#15 | 7.6%(+8.26)#1,521 |
| 16. | 56237 | 15.5% | 6.3%(+9.24)#16 | 7.6%(+7.85)#1,615 |
| 17. | 56244 | 14.9% | 6.3%(+8.66)#17 | 7.6%(+7.27)#1,763 |
| 18. | 56737 | 14.8% | 6.3%(+8.56)#18 | 7.6%(+7.17)#1,793 |
| 19. | 55765 | 14.7% | 6.3%(+8.48)#19 | 7.6%(+7.09)#1,817 |
| 20. | 56685 | 14.3% | 6.3%(+8.03)#20 | 7.6%(+6.64)#1,949 |
| 21. | 56141 | 13.9% | 6.3%(+7.63)#21 | 7.6%(+6.24)#2,063 |
| 22. | 55073 | 13.9% | 6.3%(+7.60)#22 | 7.6%(+6.21)#2,073 |
| 23. | 55327 | 13.8% | 6.3%(+7.54)#23 | 7.6%(+6.15)#2,099 |
| 24. | 56357 | 13.6% | 6.3%(+7.33)#24 | 7.6%(+5.94)#2,172 |
| 25. | 56143 | 13.5% | 6.3%(+7.28)#25 | 7.6%(+5.89)#2,193 |
| 26. | 56756 | 13.4% | 6.3%(+7.17)#26 | 7.6%(+5.79)#2,246 |
| 27. | 56434 | 13.3% | 6.3%(+7.08)#27 | 7.6%(+5.69)#2,285 |
| 28. | 55340 | 13.3% | 6.3%(+7.05)#28 | 7.6%(+5.66)#2,302 |
| 29. | 55723 | 13.2% | 6.3%(+6.91)#29 | 7.6%(+5.52)#2,350 |
| 30. | 55011 | 12.9% | 6.3%(+6.65)#30 | 7.6%(+5.26)#2,444 |
| 31. | 56517 | 12.8% | 6.3%(+6.56)#31 | 7.6%(+5.17)#2,485 |
| 32. | 55442 | 12.4% | 6.3%(+6.15)#32 | 7.6%(+4.76)#2,677 |
| 33. | 56714 | 12.3% | 6.3%(+6.06)#33 | 7.6%(+4.67)#2,736 |
| 34. | 55070 | 12.3% | 6.3%(+6.05)#34 | 7.6%(+4.67)#2,739 |
| 35. | 56252 | 12.2% | 6.3%(+5.96)#35 | 7.6%(+4.57)#2,789 |
| 36. | 56292 | 12.1% | 6.3%(+5.86)#36 | 7.6%(+4.47)#2,834 |
| 37. | 56350 | 12.1% | 6.3%(+5.86)#37 | 7.6%(+4.47)#2,835 |
| 38. | 56448 | 11.9% | 6.3%(+5.69)#38 | 7.6%(+4.30)#2,921 |
| 39. | 55414 | 11.7% | 6.3%(+5.45)#39 | 7.6%(+4.06)#3,048 |
| 40. | 55746 | 11.4% | 6.3%(+5.19)#40 | 7.6%(+3.80)#3,214 |
| 41. | 56751 | 11.4% | 6.3%(+5.18)#41 | 7.6%(+3.79)#3,220 |
| 42. | 55074 | 11.4% | 6.3%(+5.17)#42 | 7.6%(+3.78)#3,224 |
| 43. | 56754 | 11.4% | 6.3%(+5.17)#43 | 7.6%(+3.78)#3,226 |
| 44. | 55046 | 11.2% | 6.3%(+4.96)#44 | 7.6%(+3.57)#3,384 |
| 45. | 56763 | 11.2% | 6.3%(+4.93)#45 | 7.6%(+3.54)#3,415 |
| 46. | 55126 | 11.1% | 6.3%(+4.87)#46 | 7.6%(+3.48)#3,441 |
| 47. | 55305 | 11.0% | 6.3%(+4.72)#47 | 7.6%(+3.33)#3,561 |
| 48. | 56670 | 10.7% | 6.3%(+4.46)#48 | 7.6%(+3.07)#3,766 |
| 49. | 56011 | 10.7% | 6.3%(+4.41)#49 | 7.6%(+3.02)#3,809 |
| 50. | 55768 | 10.6% | 6.3%(+4.38)#50 | 7.6%(+2.99)#3,831 |
| 51. | 55347 | 10.6% | 6.3%(+4.38)#51 | 7.6%(+2.99)#3,834 |
| 52. | 55317 | 10.6% | 6.3%(+4.31)#52 | 7.6%(+2.92)#3,912 |
| 53. | 56123 | 10.5% | 6.3%(+4.27)#53 | 7.6%(+2.88)#3,952 |
| 54. | 55758 | 10.5% | 6.3%(+4.27)#54 | 7.6%(+2.88)#3,959 |
| 55. | 55616 | 10.4% | 6.3%(+4.11)#55 | 7.6%(+2.72)#4,119 |
| 56. | 56511 | 10.3% | 6.3%(+4.03)#56 | 7.6%(+2.64)#4,186 |
| 57. | 55769 | 10.3% | 6.3%(+4.02)#57 | 7.6%(+2.63)#4,195 |
| 58. | 55350 | 10.2% | 6.3%(+3.99)#58 | 7.6%(+2.60)#4,226 |
| 59. | 56231 | 10.2% | 6.3%(+3.95)#59 | 7.6%(+2.56)#4,268 |
| 60. | 55386 | 10.1% | 6.3%(+3.85)#60 | 7.6%(+2.46)#4,344 |
| 61. | 55127 | 10.1% | 6.3%(+3.85)#61 | 7.6%(+2.46)#4,347 |
| 62. | 55346 | 10.0% | 6.3%(+3.78)#62 | 7.6%(+2.39)#4,412 |
| 63. | 55125 | 9.9% | 6.3%(+3.68)#63 | 7.6%(+2.29)#4,505 |
| 64. | 55319 | 9.9% | 6.3%(+3.62)#64 | 7.6%(+2.23)#4,553 |
| 65. | 55071 | 9.7% | 6.3%(+3.42)#65 | 7.6%(+2.03)#4,769 |
| 66. | 55960 | 9.7% | 6.3%(+3.42)#66 | 7.6%(+2.03)#4,771 |
| 67. | 55370 | 9.7% | 6.3%(+3.42)#67 | 7.6%(+2.03)#4,776 |
| 68. | 55429 | 9.6% | 6.3%(+3.39)#68 | 7.6%(+2.00)#4,807 |
| 69. | 55357 | 9.6% | 6.3%(+3.39)#69 | 7.6%(+2.00)#4,813 |
| 70. | 56663 | 9.5% | 6.3%(+3.27)#70 | 7.6%(+1.88)#4,951 |
| 71. | 56142 | 9.4% | 6.3%(+3.19)#71 | 7.6%(+1.80)#5,038 |
| 72. | 55082 | 9.4% | 6.3%(+3.17)#72 | 7.6%(+1.78)#5,060 |
| 73. | 55328 | 9.4% | 6.3%(+3.16)#73 | 7.6%(+1.77)#5,065 |
| 74. | 55449 | 9.4% | 6.3%(+3.16)#74 | 7.6%(+1.77)#5,068 |
| 75. | 55415 | 9.4% | 6.3%(+3.16)#75 | 7.6%(+1.77)#5,071 |
| 76. | 56710 | 9.4% | 6.3%(+3.12)#76 | 7.6%(+1.73)#5,119 |
| 77. | 55369 | 9.3% | 6.3%(+3.02)#77 | 7.6%(+1.63)#5,234 |
| 78. | 56311 | 9.2% | 6.3%(+2.95)#78 | 7.6%(+1.56)#5,306 |
| 79. | 56267 | 9.2% | 6.3%(+2.91)#79 | 7.6%(+1.52)#5,356 |
| 80. | 55129 | 9.1% | 6.3%(+2.88)#80 | 7.6%(+1.49)#5,397 |
| 81. | 55054 | 9.1% | 6.3%(+2.86)#81 | 7.6%(+1.47)#5,428 |
| 82. | 55781 | 9.1% | 6.3%(+2.83)#82 | 7.6%(+1.44)#5,465 |
| 83. | 56257 | 9.1% | 6.3%(+2.83)#83 | 7.6%(+1.44)#5,471 |
| 84. | 55109 | 9.1% | 6.3%(+2.81)#84 | 7.6%(+1.42)#5,504 |
| 85. | 56528 | 9.1% | 6.3%(+2.81)#85 | 7.6%(+1.42)#5,505 |
| 86. | 56442 | 9.0% | 6.3%(+2.75)#86 | 7.6%(+1.36)#5,582 |
| 87. | 56293 | 9.0% | 6.3%(+2.75)#87 | 7.6%(+1.36)#5,594 |
| 88. | 55705 | 9.0% | 6.3%(+2.73)#88 | 7.6%(+1.34)#5,620 |
| 89. | 55123 | 9.0% | 6.3%(+2.72)#89 | 7.6%(+1.33)#5,632 |
| 90. | 56025 | 8.8% | 6.3%(+2.59)#90 | 7.6%(+1.20)#5,809 |
| 91. | 55384 | 8.8% | 6.3%(+2.54)#91 | 7.6%(+1.15)#5,876 |
| 92. | 55130 | 8.8% | 6.3%(+2.53)#92 | 7.6%(+1.14)#5,894 |
| 93. | 56639 | 8.7% | 6.3%(+2.44)#93 | 7.6%(+1.05)#6,018 |
| 94. | 56032 | 8.7% | 6.3%(+2.44)#94 | 7.6%(+1.05)#6,019 |
| 95. | 55309 | 8.7% | 6.3%(+2.43)#95 | 7.6%(+1.04)#6,024 |
| 96. | 55955 | 8.7% | 6.3%(+2.42)#96 | 7.6%(+1.03)#6,035 |
| 97. | 55441 | 8.7% | 6.3%(+2.40)#97 | 7.6%(+1.01)#6,072 |
| 98. | 55324 | 8.6% | 6.3%(+2.38)#98 | 7.6%(+0.994)#6,095 |
| 99. | 55304 | 8.6% | 6.3%(+2.29)#99 | 7.6%(+0.905)#6,209 |
| 100. | 56634 | 8.5% | 6.3%(+2.27)#100 | 7.6%(+0.885)#6,231 |
Common Questions
What are the Top 10 Zip Codes with the Highest Percentage of Population with a Degree in Engineering in Minnesota?
Top 10 Zip Codes with the Highest Percentage of Population with a Degree in Engineering in Minnesota are:
What zip code has the Highest Percentage of Population with a Degree in Engineering in Minnesota?
56125 has the Highest Percentage of Population with a Degree in Engineering in Minnesota with 66.7%.
What is the Percentage of Population with a Degree in Engineering in the State of Minnesota?
Percentage of Population with a Degree in Engineering in Minnesota is 6.3%.
What is the Percentage of Population with a Degree in Engineering in the United States?
Percentage of Population with a Degree in Engineering in the United States is 7.6%.