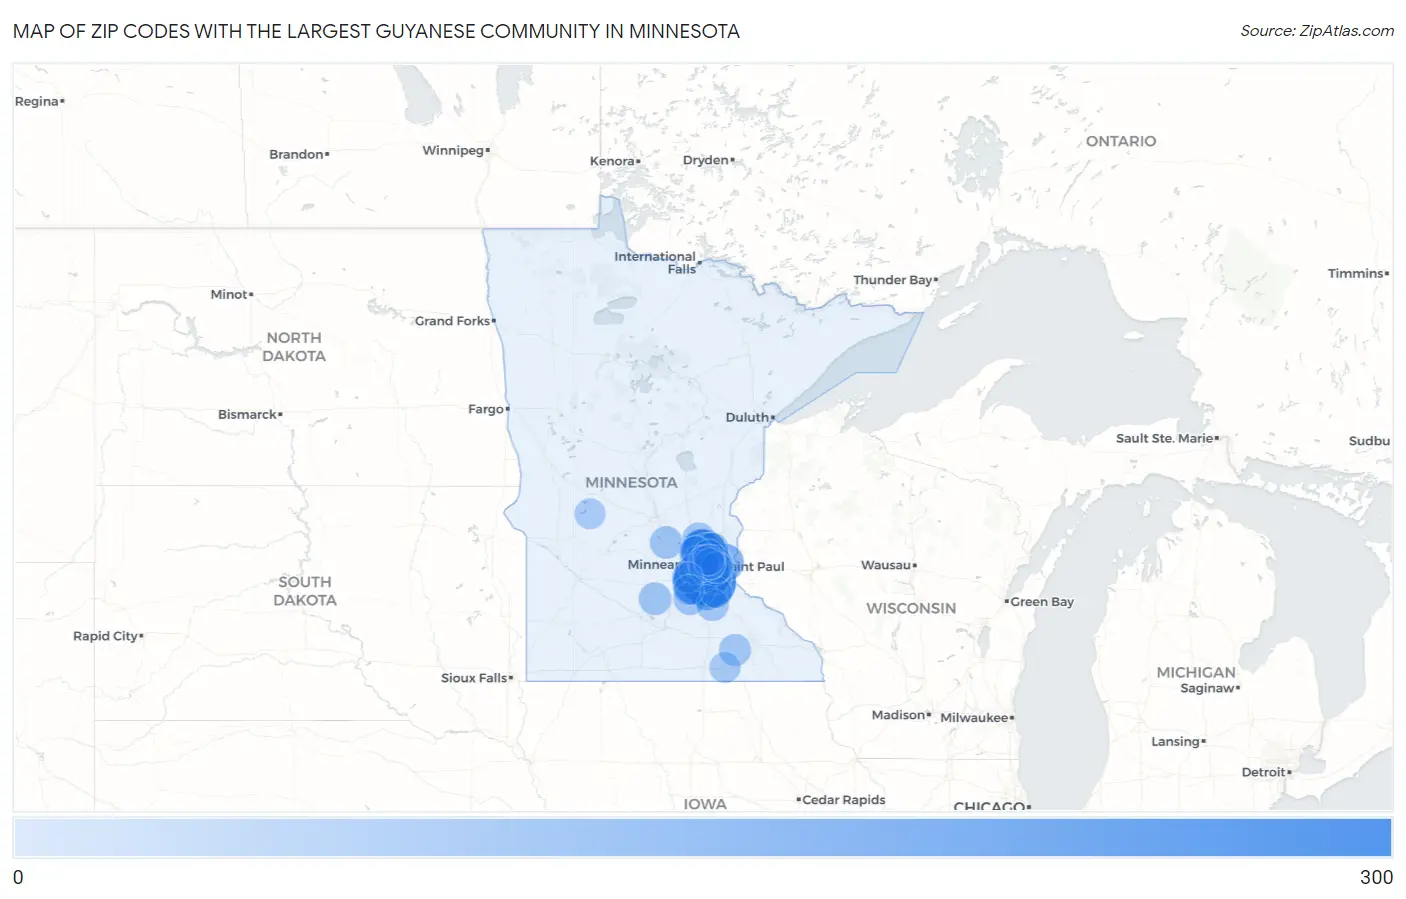
Zip Codes with the Largest Guyanese Community in Minnesota
RELATED REPORTS & OPTIONS
Guyanese
Minnesota
Compare Zip Codes
Map of Zip Codes with the Largest Guyanese Community in Minnesota
0
300
Zip Codes with the Largest Guyanese Community in Minnesota
| Zip Code | Guyanese | vs State | vs National | |
| 1. | 55124 | 278 | 2,667(10.42%)#1 | 258,522(0.11%)#137 |
| 2. | 55443 | 227 | 2,667(8.51%)#2 | 258,522(0.09%)#172 |
| 3. | 55347 | 225 | 2,667(8.44%)#3 | 258,522(0.09%)#176 |
| 4. | 55379 | 205 | 2,667(7.69%)#4 | 258,522(0.08%)#193 |
| 5. | 55406 | 142 | 2,667(5.32%)#5 | 258,522(0.05%)#293 |
| 6. | 55430 | 115 | 2,667(4.31%)#6 | 258,522(0.04%)#356 |
| 7. | 55128 | 108 | 2,667(4.05%)#7 | 258,522(0.04%)#376 |
| 8. | 55044 | 105 | 2,667(3.94%)#8 | 258,522(0.04%)#389 |
| 9. | 55423 | 93 | 2,667(3.49%)#9 | 258,522(0.04%)#436 |
| 10. | 55316 | 92 | 2,667(3.45%)#10 | 258,522(0.04%)#442 |
| 11. | 55420 | 75 | 2,667(2.81%)#11 | 258,522(0.03%)#531 |
| 12. | 55122 | 65 | 2,667(2.44%)#12 | 258,522(0.03%)#599 |
| 13. | 55121 | 65 | 2,667(2.44%)#13 | 258,522(0.03%)#603 |
| 14. | 55103 | 55 | 2,667(2.06%)#14 | 258,522(0.02%)#676 |
| 15. | 55112 | 53 | 2,667(1.99%)#15 | 258,522(0.02%)#688 |
| 16. | 55433 | 52 | 2,667(1.95%)#16 | 258,522(0.02%)#705 |
| 17. | 55421 | 48 | 2,667(1.80%)#17 | 258,522(0.02%)#746 |
| 18. | 55123 | 47 | 2,667(1.76%)#18 | 258,522(0.02%)#761 |
| 19. | 55372 | 33 | 2,667(1.24%)#19 | 258,522(0.01%)#958 |
| 20. | 55411 | 33 | 2,667(1.24%)#20 | 258,522(0.01%)#962 |
| 21. | 55334 | 33 | 2,667(1.24%)#21 | 258,522(0.01%)#965 |
| 22. | 56071 | 32 | 2,667(1.20%)#22 | 258,522(0.01%)#982 |
| 23. | 55358 | 32 | 2,667(1.20%)#23 | 258,522(0.01%)#983 |
| 24. | 55303 | 31 | 2,667(1.16%)#24 | 258,522(0.01%)#986 |
| 25. | 55426 | 31 | 2,667(1.16%)#25 | 258,522(0.01%)#997 |
| 26. | 55434 | 30 | 2,667(1.12%)#26 | 258,522(0.01%)#1,019 |
| 27. | 55449 | 27 | 2,667(1.01%)#27 | 258,522(0.01%)#1,083 |
| 28. | 55311 | 24 | 2,667(0.90%)#28 | 258,522(0.01%)#1,181 |
| 29. | 55057 | 24 | 2,667(0.90%)#29 | 258,522(0.01%)#1,189 |
| 30. | 55437 | 23 | 2,667(0.86%)#30 | 258,522(0.01%)#1,224 |
| 31. | 55940 | 23 | 2,667(0.86%)#31 | 258,522(0.01%)#1,234 |
| 32. | 55113 | 22 | 2,667(0.82%)#32 | 258,522(0.01%)#1,245 |
| 33. | 55107 | 21 | 2,667(0.79%)#33 | 258,522(0.01%)#1,292 |
| 34. | 55441 | 18 | 2,667(0.67%)#34 | 258,522(0.01%)#1,393 |
| 35. | 55116 | 17 | 2,667(0.64%)#35 | 258,522(0.01%)#1,424 |
| 36. | 55404 | 15 | 2,667(0.56%)#36 | 258,522(0.01%)#1,502 |
| 37. | 55455 | 15 | 2,667(0.56%)#37 | 258,522(0.01%)#1,517 |
| 38. | 55024 | 14 | 2,667(0.52%)#38 | 258,522(0.01%)#1,530 |
| 39. | 55345 | 13 | 2,667(0.49%)#39 | 258,522(0.01%)#1,591 |
| 40. | 55369 | 11 | 2,667(0.41%)#40 | 258,522(0.00%)#1,679 |
| 41. | 55412 | 11 | 2,667(0.41%)#41 | 258,522(0.00%)#1,696 |
| 42. | 55912 | 10 | 2,667(0.37%)#42 | 258,522(0.00%)#1,748 |
| 43. | 55410 | 10 | 2,667(0.37%)#43 | 258,522(0.00%)#1,757 |
| 44. | 55416 | 9 | 2,667(0.34%)#44 | 258,522(0.00%)#1,801 |
| 45. | 55432 | 9 | 2,667(0.34%)#45 | 258,522(0.00%)#1,808 |
| 46. | 55422 | 9 | 2,667(0.34%)#46 | 258,522(0.00%)#1,814 |
| 47. | 55102 | 9 | 2,667(0.34%)#47 | 258,522(0.00%)#1,825 |
| 48. | 55414 | 7 | 2,667(0.26%)#48 | 258,522(0.00%)#1,916 |
| 49. | 55418 | 7 | 2,667(0.26%)#49 | 258,522(0.00%)#1,917 |
| 50. | 56334 | 7 | 2,667(0.26%)#50 | 258,522(0.00%)#1,941 |
| 51. | 55318 | 6 | 2,667(0.22%)#51 | 258,522(0.00%)#1,968 |
| 52. | 55352 | 1 | 2,667(0.04%)#52 | 258,522(0.00%)#2,187 |
Common Questions
What are the Top 10 Zip Codes with the Largest Guyanese Community in Minnesota?
Top 10 Zip Codes with the Largest Guyanese Community in Minnesota are:
What zip code has the Largest Guyanese Community in Minnesota?
55124 has the Largest Guyanese Community in Minnesota with 278.
What is the Total Guyanese Population in the State of Minnesota?
Total Guyanese Population in Minnesota is 2,667.
What is the Total Guyanese Population in the United States?
Total Guyanese Population in the United States is 258,522.