Zip Codes with the Highest Percentage of Population Employed in Security & Protection in Burnsville, MN
RELATED REPORTS & OPTIONS
Security & Protection
Burnsville
Compare Zip Codes
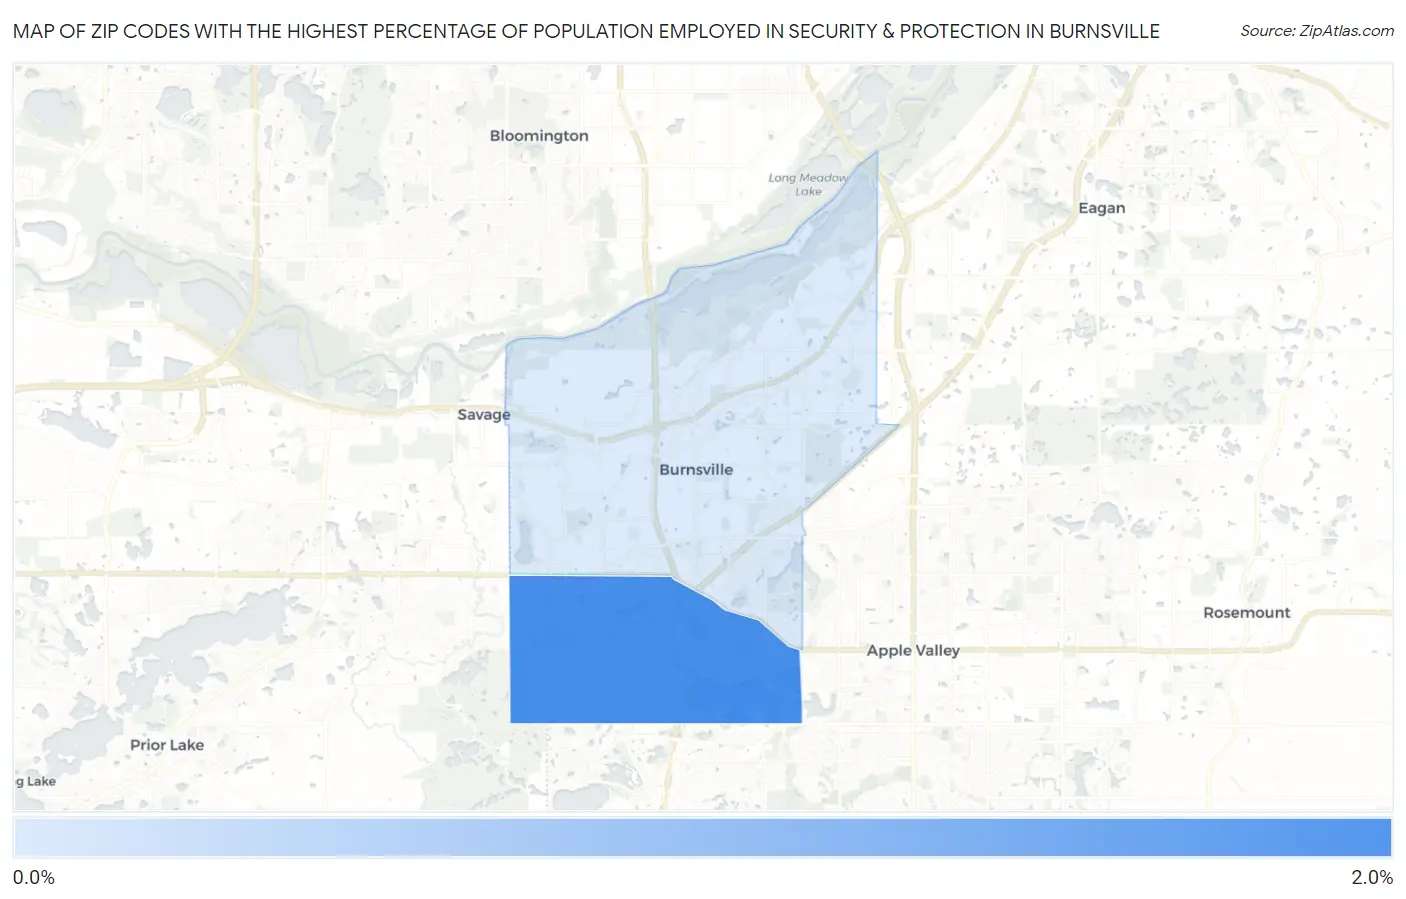
Map of Zip Codes with the Highest Percentage of Population Employed in Security & Protection in Burnsville
0.82%
1.5%
Zip Codes with the Highest Percentage of Population Employed in Security & Protection in Burnsville, MN
| Zip Code | % Employed | vs State | vs National | |
| 1. | 55306 | 1.5% | 1.3%(+0.222)#252 | 2.1%(-0.607)#15,872 |
| 2. | 55337 | 0.82% | 1.3%(-0.501)#484 | 2.1%(-1.33)#21,308 |
1
Common Questions
What are the Top Zip Codes with the Highest Percentage of Population Employed in Security & Protection in Burnsville, MN?
Top Zip Codes with the Highest Percentage of Population Employed in Security & Protection in Burnsville, MN are:
What zip code has the Highest Percentage of Population Employed in Security & Protection in Burnsville, MN?
55306 has the Highest Percentage of Population Employed in Security & Protection in Burnsville, MN with 1.5%.
What is the Percentage of Population Employed in Security & Protection in Burnsville, MN?
Percentage of Population Employed in Security & Protection in Burnsville is 1.0%.
What is the Percentage of Population Employed in Security & Protection in Minnesota?
Percentage of Population Employed in Security & Protection in Minnesota is 1.3%.
What is the Percentage of Population Employed in Security & Protection in the United States?
Percentage of Population Employed in Security & Protection in the United States is 2.1%.