Zip Codes with the Largest Italian Community in Minnesota
RELATED REPORTS & OPTIONS
Italian
Minnesota
Compare Zip Codes
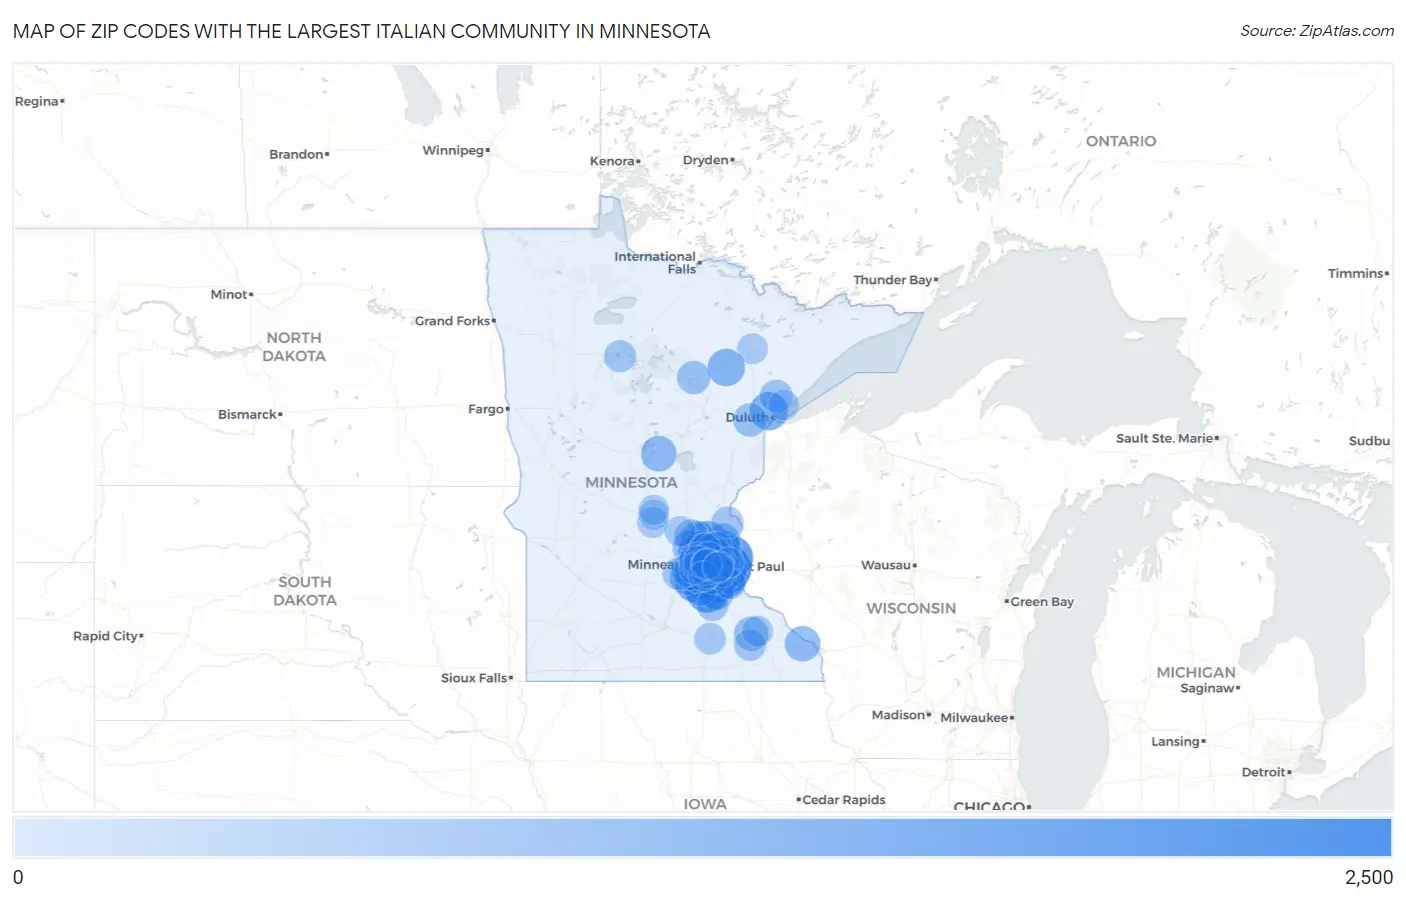
Map of Zip Codes with the Largest Italian Community in Minnesota
0
2,500
Zip Codes with the Largest Italian Community in Minnesota
| Zip Code | Italian | vs State | vs National | |
| 1. | 55125 | 2,309 | 125,847(1.83%)#1 | 16,316,728(0.01%)#1,774 |
| 2. | 55124 | 1,877 | 125,847(1.49%)#2 | 16,316,728(0.01%)#2,486 |
| 3. | 55082 | 1,742 | 125,847(1.38%)#3 | 16,316,728(0.01%)#2,759 |
| 4. | 55044 | 1,652 | 125,847(1.31%)#4 | 16,316,728(0.01%)#2,986 |
| 5. | 55016 | 1,469 | 125,847(1.17%)#5 | 16,316,728(0.01%)#3,445 |
| 6. | 55304 | 1,426 | 125,847(1.13%)#6 | 16,316,728(0.01%)#3,574 |
| 7. | 55379 | 1,359 | 125,847(1.08%)#7 | 16,316,728(0.01%)#3,771 |
| 8. | 55112 | 1,336 | 125,847(1.06%)#8 | 16,316,728(0.01%)#3,844 |
| 9. | 55113 | 1,331 | 125,847(1.06%)#9 | 16,316,728(0.01%)#3,864 |
| 10. | 55104 | 1,316 | 125,847(1.05%)#10 | 16,316,728(0.01%)#3,909 |
| 11. | 55129 | 1,300 | 125,847(1.03%)#11 | 16,316,728(0.01%)#3,948 |
| 12. | 55106 | 1,287 | 125,847(1.02%)#12 | 16,316,728(0.01%)#3,991 |
| 13. | 55378 | 1,279 | 125,847(1.02%)#13 | 16,316,728(0.01%)#4,016 |
| 14. | 55337 | 1,238 | 125,847(0.98%)#14 | 16,316,728(0.01%)#4,165 |
| 15. | 55811 | 1,234 | 125,847(0.98%)#15 | 16,316,728(0.01%)#4,177 |
| 16. | 55068 | 1,220 | 125,847(0.97%)#16 | 16,316,728(0.01%)#4,229 |
| 17. | 55408 | 1,140 | 125,847(0.91%)#17 | 16,316,728(0.01%)#4,506 |
| 18. | 55746 | 1,132 | 125,847(0.90%)#18 | 16,316,728(0.01%)#4,544 |
| 19. | 55109 | 1,129 | 125,847(0.90%)#19 | 16,316,728(0.01%)#4,554 |
| 20. | 55118 | 1,123 | 125,847(0.89%)#20 | 16,316,728(0.01%)#4,585 |
| 21. | 55416 | 1,073 | 125,847(0.85%)#21 | 16,316,728(0.01%)#4,806 |
| 22. | 55116 | 1,052 | 125,847(0.84%)#22 | 16,316,728(0.01%)#4,882 |
| 23. | 55369 | 1,039 | 125,847(0.83%)#23 | 16,316,728(0.01%)#4,937 |
| 24. | 55105 | 1,038 | 125,847(0.82%)#24 | 16,316,728(0.01%)#4,941 |
| 25. | 55418 | 1,032 | 125,847(0.82%)#25 | 16,316,728(0.01%)#4,964 |
| 26. | 55427 | 1,025 | 125,847(0.81%)#26 | 16,316,728(0.01%)#4,991 |
| 27. | 55414 | 1,024 | 125,847(0.81%)#27 | 16,316,728(0.01%)#4,994 |
| 28. | 55076 | 1,016 | 125,847(0.81%)#28 | 16,316,728(0.01%)#5,032 |
| 29. | 55025 | 968 | 125,847(0.77%)#29 | 16,316,728(0.01%)#5,218 |
| 30. | 56401 | 966 | 125,847(0.77%)#30 | 16,316,728(0.01%)#5,230 |
| 31. | 55417 | 963 | 125,847(0.77%)#31 | 16,316,728(0.01%)#5,248 |
| 32. | 55987 | 957 | 125,847(0.76%)#32 | 16,316,728(0.01%)#5,267 |
| 33. | 55110 | 956 | 125,847(0.76%)#33 | 16,316,728(0.01%)#5,274 |
| 34. | 55434 | 944 | 125,847(0.75%)#34 | 16,316,728(0.01%)#5,336 |
| 35. | 55024 | 940 | 125,847(0.75%)#35 | 16,316,728(0.01%)#5,354 |
| 36. | 55303 | 939 | 125,847(0.75%)#36 | 16,316,728(0.01%)#5,364 |
| 37. | 55419 | 923 | 125,847(0.73%)#37 | 16,316,728(0.01%)#5,436 |
| 38. | 55318 | 904 | 125,847(0.72%)#38 | 16,316,728(0.01%)#5,532 |
| 39. | 55406 | 890 | 125,847(0.71%)#39 | 16,316,728(0.01%)#5,597 |
| 40. | 55374 | 887 | 125,847(0.70%)#40 | 16,316,728(0.01%)#5,618 |
| 41. | 55311 | 878 | 125,847(0.70%)#41 | 16,316,728(0.01%)#5,672 |
| 42. | 55128 | 869 | 125,847(0.69%)#42 | 16,316,728(0.01%)#5,710 |
| 43. | 55038 | 866 | 125,847(0.69%)#43 | 16,316,728(0.01%)#5,726 |
| 44. | 55901 | 853 | 125,847(0.68%)#44 | 16,316,728(0.01%)#5,803 |
| 45. | 55123 | 842 | 125,847(0.67%)#45 | 16,316,728(0.01%)#5,863 |
| 46. | 55102 | 837 | 125,847(0.67%)#46 | 16,316,728(0.01%)#5,889 |
| 47. | 55372 | 805 | 125,847(0.64%)#47 | 16,316,728(0.00%)#6,052 |
| 48. | 55316 | 788 | 125,847(0.63%)#48 | 16,316,728(0.00%)#6,142 |
| 49. | 55330 | 781 | 125,847(0.62%)#49 | 16,316,728(0.00%)#6,175 |
| 50. | 55407 | 777 | 125,847(0.62%)#50 | 16,316,728(0.00%)#6,197 |
| 51. | 55119 | 763 | 125,847(0.61%)#51 | 16,316,728(0.00%)#6,275 |
| 52. | 55720 | 759 | 125,847(0.60%)#52 | 16,316,728(0.00%)#6,302 |
| 53. | 55744 | 756 | 125,847(0.60%)#53 | 16,316,728(0.00%)#6,319 |
| 54. | 55432 | 753 | 125,847(0.60%)#54 | 16,316,728(0.00%)#6,331 |
| 55. | 55127 | 749 | 125,847(0.60%)#55 | 16,316,728(0.00%)#6,360 |
| 56. | 55347 | 742 | 125,847(0.59%)#56 | 16,316,728(0.00%)#6,399 |
| 57. | 55433 | 741 | 125,847(0.59%)#57 | 16,316,728(0.00%)#6,404 |
| 58. | 55317 | 739 | 125,847(0.59%)#58 | 16,316,728(0.00%)#6,413 |
| 59. | 55126 | 734 | 125,847(0.58%)#59 | 16,316,728(0.00%)#6,439 |
| 60. | 55803 | 719 | 125,847(0.57%)#60 | 16,316,728(0.00%)#6,532 |
| 61. | 55122 | 694 | 125,847(0.55%)#61 | 16,316,728(0.00%)#6,684 |
| 62. | 55117 | 691 | 125,847(0.55%)#62 | 16,316,728(0.00%)#6,701 |
| 63. | 55331 | 689 | 125,847(0.55%)#63 | 16,316,728(0.00%)#6,717 |
| 64. | 55422 | 686 | 125,847(0.55%)#64 | 16,316,728(0.00%)#6,737 |
| 65. | 55343 | 681 | 125,847(0.54%)#65 | 16,316,728(0.00%)#6,759 |
| 66. | 55449 | 671 | 125,847(0.53%)#66 | 16,316,728(0.00%)#6,806 |
| 67. | 55410 | 671 | 125,847(0.53%)#67 | 16,316,728(0.00%)#6,812 |
| 68. | 55387 | 657 | 125,847(0.52%)#68 | 16,316,728(0.00%)#6,903 |
| 69. | 55446 | 636 | 125,847(0.51%)#69 | 16,316,728(0.00%)#7,024 |
| 70. | 55014 | 633 | 125,847(0.50%)#70 | 16,316,728(0.00%)#7,037 |
| 71. | 56601 | 632 | 125,847(0.50%)#71 | 16,316,728(0.00%)#7,045 |
| 72. | 55426 | 624 | 125,847(0.50%)#72 | 16,316,728(0.00%)#7,093 |
| 73. | 55056 | 620 | 125,847(0.49%)#73 | 16,316,728(0.00%)#7,123 |
| 74. | 55057 | 610 | 125,847(0.48%)#74 | 16,316,728(0.00%)#7,185 |
| 75. | 55902 | 608 | 125,847(0.48%)#75 | 16,316,728(0.00%)#7,197 |
| 76. | 55447 | 605 | 125,847(0.48%)#76 | 16,316,728(0.00%)#7,213 |
| 77. | 55075 | 598 | 125,847(0.48%)#77 | 16,316,728(0.00%)#7,252 |
| 78. | 55428 | 586 | 125,847(0.47%)#78 | 16,316,728(0.00%)#7,333 |
| 79. | 55060 | 576 | 125,847(0.46%)#79 | 16,316,728(0.00%)#7,413 |
| 80. | 55305 | 576 | 125,847(0.46%)#80 | 16,316,728(0.00%)#7,416 |
| 81. | 55448 | 575 | 125,847(0.46%)#81 | 16,316,728(0.00%)#7,425 |
| 82. | 55423 | 574 | 125,847(0.46%)#82 | 16,316,728(0.00%)#7,430 |
| 83. | 55345 | 558 | 125,847(0.44%)#83 | 16,316,728(0.00%)#7,524 |
| 84. | 55421 | 546 | 125,847(0.43%)#84 | 16,316,728(0.00%)#7,607 |
| 85. | 55906 | 529 | 125,847(0.42%)#85 | 16,316,728(0.00%)#7,740 |
| 86. | 55033 | 522 | 125,847(0.41%)#86 | 16,316,728(0.00%)#7,794 |
| 87. | 55403 | 518 | 125,847(0.41%)#87 | 16,316,728(0.00%)#7,819 |
| 88. | 55309 | 512 | 125,847(0.41%)#88 | 16,316,728(0.00%)#7,877 |
| 89. | 56301 | 507 | 125,847(0.40%)#89 | 16,316,728(0.00%)#7,917 |
| 90. | 55792 | 504 | 125,847(0.40%)#90 | 16,316,728(0.00%)#7,949 |
| 91. | 55441 | 502 | 125,847(0.40%)#91 | 16,316,728(0.00%)#7,971 |
| 92. | 55804 | 500 | 125,847(0.40%)#92 | 16,316,728(0.00%)#7,982 |
| 93. | 55042 | 498 | 125,847(0.40%)#93 | 16,316,728(0.00%)#8,000 |
| 94. | 55405 | 491 | 125,847(0.39%)#94 | 16,316,728(0.00%)#8,055 |
| 95. | 55401 | 485 | 125,847(0.39%)#95 | 16,316,728(0.00%)#8,105 |
| 96. | 56303 | 479 | 125,847(0.38%)#96 | 16,316,728(0.00%)#8,145 |
| 97. | 56377 | 475 | 125,847(0.38%)#97 | 16,316,728(0.00%)#8,176 |
| 98. | 55437 | 473 | 125,847(0.38%)#98 | 16,316,728(0.00%)#8,199 |
| 99. | 55101 | 471 | 125,847(0.37%)#99 | 16,316,728(0.00%)#8,216 |
| 100. | 55107 | 469 | 125,847(0.37%)#100 | 16,316,728(0.00%)#8,233 |
Common Questions
What are the Top 10 Zip Codes with the Largest Italian Community in Minnesota?
Top 10 Zip Codes with the Largest Italian Community in Minnesota are:
What zip code has the Largest Italian Community in Minnesota?
55125 has the Largest Italian Community in Minnesota with 2,309.
What is the Total Italian Population in the State of Minnesota?
Total Italian Population in Minnesota is 125,847.
What is the Total Italian Population in the United States?
Total Italian Population in the United States is 16,316,728.