Zip Codes with the Highest Percentage of Population Employed in Education Instruction & Library in Minnesota
RELATED REPORTS & OPTIONS
Education Instruction & Library
Minnesota
Compare Zip Codes
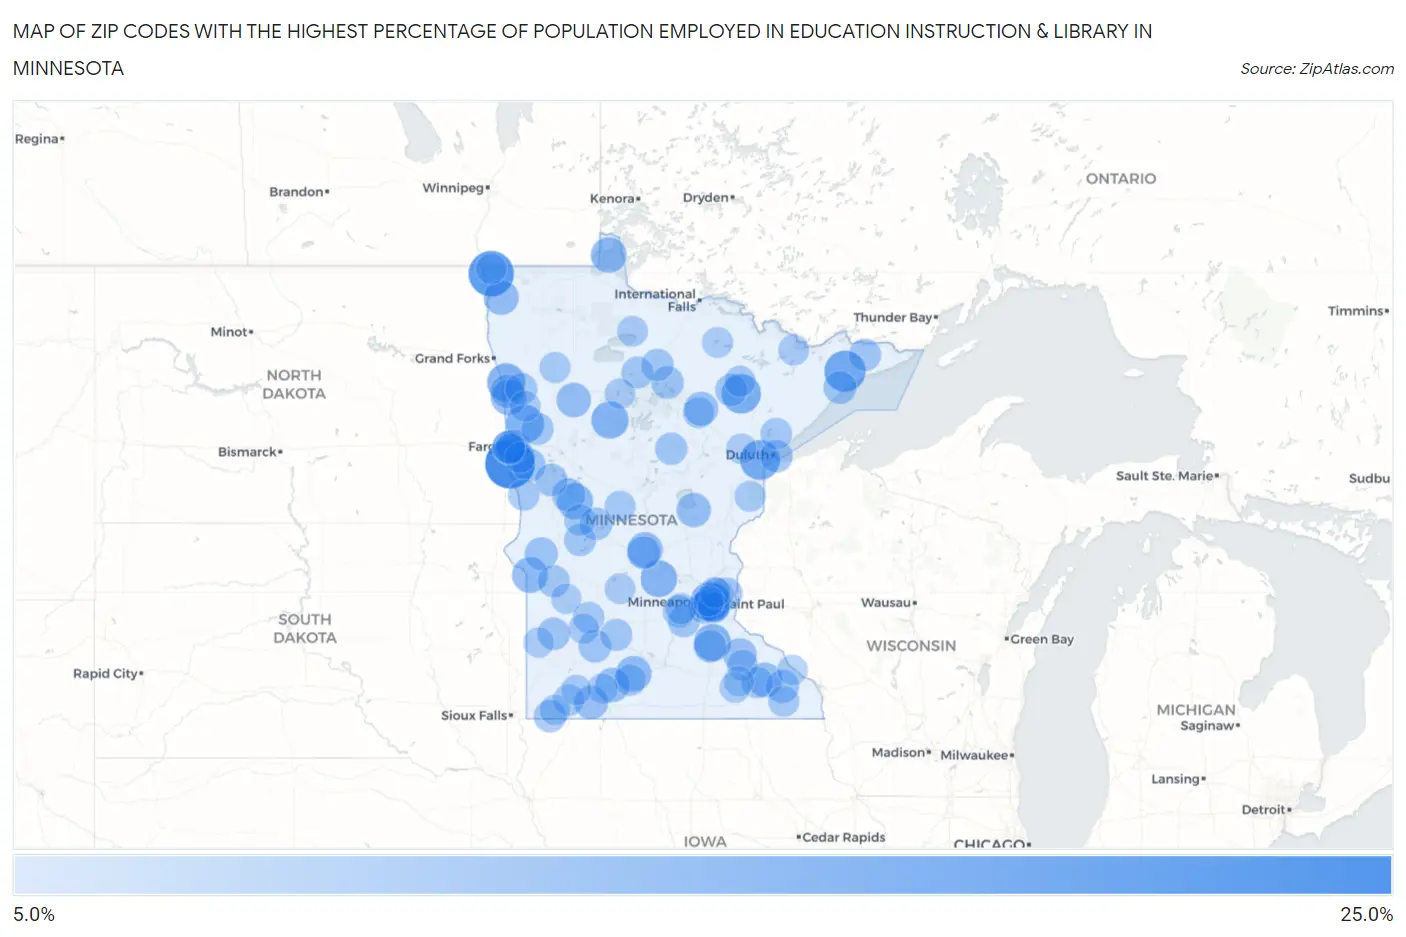
Map of Zip Codes with the Highest Percentage of Population Employed in Education Instruction & Library in Minnesota
5.0%
25.0%
Zip Codes with the Highest Percentage of Population Employed in Education Instruction & Library in Minnesota
| Zip Code | % Employed | vs State | vs National | |
| 1. | 56525 | 23.1% | 6.2%(+16.9)#1 | 6.2%(+16.9)#460 |
| 2. | 56731 | 19.7% | 6.2%(+13.5)#2 | 6.2%(+13.5)#673 |
| 3. | 55615 | 16.7% | 6.2%(+10.5)#3 | 6.2%(+10.5)#998 |
| 4. | 55733 | 15.5% | 6.2%(+9.34)#4 | 6.2%(+9.36)#1,177 |
| 5. | 55768 | 15.2% | 6.2%(+8.97)#5 | 6.2%(+8.99)#1,253 |
| 6. | 55414 | 14.5% | 6.2%(+8.25)#6 | 6.2%(+8.27)#1,402 |
| 7. | 56523 | 14.2% | 6.2%(+8.01)#7 | 6.2%(+8.03)#1,479 |
| 8. | 56519 | 14.1% | 6.2%(+7.93)#8 | 6.2%(+7.95)#1,503 |
| 9. | 56458 | 13.5% | 6.2%(+7.28)#9 | 6.2%(+7.29)#1,717 |
| 10. | 55114 | 13.4% | 6.2%(+7.22)#10 | 6.2%(+7.23)#1,741 |
| 11. | 55057 | 13.4% | 6.2%(+7.20)#11 | 6.2%(+7.21)#1,750 |
| 12. | 55302 | 13.2% | 6.2%(+6.96)#12 | 6.2%(+6.98)#1,839 |
| 13. | 56524 | 12.6% | 6.2%(+6.39)#13 | 6.2%(+6.40)#2,079 |
| 14. | 56278 | 12.4% | 6.2%(+6.17)#14 | 6.2%(+6.19)#2,188 |
| 15. | 56711 | 12.3% | 6.2%(+6.11)#15 | 6.2%(+6.12)#2,230 |
| 16. | 56056 | 12.2% | 6.2%(+6.05)#16 | 6.2%(+6.06)#2,266 |
| 17. | 56581 | 12.2% | 6.2%(+6.02)#17 | 6.2%(+6.03)#2,280 |
| 18. | 55108 | 12.2% | 6.2%(+5.97)#18 | 6.2%(+5.98)#2,299 |
| 19. | 56374 | 12.1% | 6.2%(+5.91)#19 | 6.2%(+5.92)#2,335 |
| 20. | 56563 | 11.7% | 6.2%(+5.48)#20 | 6.2%(+5.49)#2,584 |
| 21. | 56733 | 11.7% | 6.2%(+5.47)#21 | 6.2%(+5.48)#2,591 |
| 22. | 55934 | 11.4% | 6.2%(+5.25)#22 | 6.2%(+5.26)#2,743 |
| 23. | 56651 | 11.4% | 6.2%(+5.23)#23 | 6.2%(+5.25)#2,755 |
| 24. | 56159 | 11.4% | 6.2%(+5.19)#24 | 6.2%(+5.21)#2,791 |
| 25. | 56386 | 11.3% | 6.2%(+5.08)#25 | 6.2%(+5.09)#2,870 |
| 26. | 55786 | 11.0% | 6.2%(+4.79)#26 | 6.2%(+4.81)#3,065 |
| 27. | 56568 | 10.9% | 6.2%(+4.71)#27 | 6.2%(+4.73)#3,127 |
| 28. | 56161 | 10.9% | 6.2%(+4.66)#28 | 6.2%(+4.67)#3,162 |
| 29. | 55406 | 10.9% | 6.2%(+4.65)#29 | 6.2%(+4.67)#3,164 |
| 30. | 56529 | 10.8% | 6.2%(+4.65)#30 | 6.2%(+4.66)#3,172 |
| 31. | 55992 | 10.8% | 6.2%(+4.59)#31 | 6.2%(+4.60)#3,214 |
| 32. | 56515 | 10.7% | 6.2%(+4.50)#32 | 6.2%(+4.51)#3,274 |
| 33. | 56514 | 10.7% | 6.2%(+4.47)#33 | 6.2%(+4.48)#3,308 |
| 34. | 55105 | 10.6% | 6.2%(+4.43)#34 | 6.2%(+4.44)#3,333 |
| 35. | 55979 | 10.5% | 6.2%(+4.26)#35 | 6.2%(+4.28)#3,492 |
| 36. | 55613 | 10.4% | 6.2%(+4.18)#36 | 6.2%(+4.19)#3,573 |
| 37. | 56321 | 10.3% | 6.2%(+4.15)#37 | 6.2%(+4.16)#3,599 |
| 38. | 56221 | 10.3% | 6.2%(+4.14)#38 | 6.2%(+4.15)#3,608 |
| 39. | 56293 | 10.1% | 6.2%(+3.94)#39 | 6.2%(+3.95)#3,796 |
| 40. | 56562 | 10.1% | 6.2%(+3.93)#40 | 6.2%(+3.95)#3,799 |
| 41. | 55802 | 10.1% | 6.2%(+3.88)#41 | 6.2%(+3.89)#3,854 |
| 42. | 55019 | 10.0% | 6.2%(+3.81)#42 | 6.2%(+3.83)#3,909 |
| 43. | 56680 | 10.0% | 6.2%(+3.80)#43 | 6.2%(+3.82)#3,930 |
| 44. | 56534 | 10.0% | 6.2%(+3.75)#44 | 6.2%(+3.77)#3,987 |
| 45. | 56264 | 9.9% | 6.2%(+3.71)#45 | 6.2%(+3.73)#4,042 |
| 46. | 56355 | 9.9% | 6.2%(+3.71)#46 | 6.2%(+3.72)#4,046 |
| 47. | 56129 | 9.9% | 6.2%(+3.66)#47 | 6.2%(+3.68)#4,110 |
| 48. | 56662 | 9.8% | 6.2%(+3.61)#48 | 6.2%(+3.63)#4,161 |
| 49. | 56661 | 9.8% | 6.2%(+3.61)#49 | 6.2%(+3.62)#4,170 |
| 50. | 55719 | 9.7% | 6.2%(+3.53)#50 | 6.2%(+3.55)#4,255 |
| 51. | 55115 | 9.7% | 6.2%(+3.49)#51 | 6.2%(+3.51)#4,295 |
| 52. | 56585 | 9.7% | 6.2%(+3.48)#52 | 6.2%(+3.49)#4,305 |
| 53. | 55604 | 9.7% | 6.2%(+3.47)#53 | 6.2%(+3.49)#4,314 |
| 54. | 56517 | 9.6% | 6.2%(+3.39)#54 | 6.2%(+3.41)#4,419 |
| 55. | 55333 | 9.6% | 6.2%(+3.38)#55 | 6.2%(+3.39)#4,435 |
| 56. | 56349 | 9.6% | 6.2%(+3.37)#56 | 6.2%(+3.38)#4,447 |
| 57. | 56208 | 9.6% | 6.2%(+3.37)#57 | 6.2%(+3.38)#4,448 |
| 58. | 55387 | 9.6% | 6.2%(+3.36)#58 | 6.2%(+3.37)#4,462 |
| 59. | 55315 | 9.5% | 6.2%(+3.32)#59 | 6.2%(+3.34)#4,501 |
| 60. | 56630 | 9.5% | 6.2%(+3.31)#60 | 6.2%(+3.32)#4,517 |
| 61. | 55127 | 9.5% | 6.2%(+3.31)#61 | 6.2%(+3.32)#4,518 |
| 62. | 55424 | 9.3% | 6.2%(+3.15)#62 | 6.2%(+3.17)#4,712 |
| 63. | 55409 | 9.3% | 6.2%(+3.14)#63 | 6.2%(+3.15)#4,739 |
| 64. | 55803 | 9.3% | 6.2%(+3.08)#64 | 6.2%(+3.10)#4,825 |
| 65. | 56332 | 9.3% | 6.2%(+3.07)#65 | 6.2%(+3.09)#4,840 |
| 66. | 56081 | 9.2% | 6.2%(+3.04)#66 | 6.2%(+3.06)#4,878 |
| 67. | 56165 | 9.2% | 6.2%(+3.00)#67 | 6.2%(+3.02)#4,936 |
| 68. | 55904 | 9.2% | 6.2%(+2.96)#68 | 6.2%(+2.98)#4,982 |
| 69. | 56285 | 9.1% | 6.2%(+2.86)#69 | 6.2%(+2.87)#5,141 |
| 70. | 56520 | 9.0% | 6.2%(+2.85)#70 | 6.2%(+2.86)#5,165 |
| 71. | 55722 | 9.0% | 6.2%(+2.79)#71 | 6.2%(+2.81)#5,260 |
| 72. | 55375 | 8.9% | 6.2%(+2.69)#72 | 6.2%(+2.71)#5,409 |
| 73. | 55116 | 8.9% | 6.2%(+2.69)#73 | 6.2%(+2.70)#5,423 |
| 74. | 55949 | 8.8% | 6.2%(+2.64)#74 | 6.2%(+2.66)#5,480 |
| 75. | 55712 | 8.8% | 6.2%(+2.59)#75 | 6.2%(+2.60)#5,562 |
| 76. | 56715 | 8.8% | 6.2%(+2.56)#76 | 6.2%(+2.58)#5,610 |
| 77. | 55710 | 8.8% | 6.2%(+2.56)#77 | 6.2%(+2.57)#5,615 |
| 78. | 56438 | 8.7% | 6.2%(+2.53)#78 | 6.2%(+2.54)#5,672 |
| 79. | 56580 | 8.7% | 6.2%(+2.51)#79 | 6.2%(+2.53)#5,706 |
| 80. | 56510 | 8.7% | 6.2%(+2.51)#80 | 6.2%(+2.52)#5,715 |
| 81. | 55772 | 8.7% | 6.2%(+2.50)#81 | 6.2%(+2.51)#5,741 |
| 82. | 55731 | 8.6% | 6.2%(+2.44)#82 | 6.2%(+2.46)#5,840 |
| 83. | 55963 | 8.6% | 6.2%(+2.43)#83 | 6.2%(+2.45)#5,856 |
| 84. | 55940 | 8.6% | 6.2%(+2.40)#84 | 6.2%(+2.42)#5,925 |
| 85. | 55126 | 8.6% | 6.2%(+2.38)#85 | 6.2%(+2.40)#5,959 |
| 86. | 56685 | 8.6% | 6.2%(+2.37)#86 | 6.2%(+2.39)#5,978 |
| 87. | 56755 | 8.6% | 6.2%(+2.37)#87 | 6.2%(+2.39)#5,980 |
| 88. | 56209 | 8.5% | 6.2%(+2.34)#88 | 6.2%(+2.35)#6,028 |
| 89. | 56237 | 8.5% | 6.2%(+2.30)#89 | 6.2%(+2.32)#6,087 |
| 90. | 55454 | 8.5% | 6.2%(+2.30)#90 | 6.2%(+2.32)#6,097 |
| 91. | 56110 | 8.5% | 6.2%(+2.26)#91 | 6.2%(+2.28)#6,157 |
| 92. | 56101 | 8.5% | 6.2%(+2.26)#92 | 6.2%(+2.28)#6,162 |
| 93. | 56601 | 8.4% | 6.2%(+2.23)#93 | 6.2%(+2.24)#6,232 |
| 94. | 56142 | 8.4% | 6.2%(+2.22)#94 | 6.2%(+2.24)#6,245 |
| 95. | 56131 | 8.4% | 6.2%(+2.22)#95 | 6.2%(+2.23)#6,259 |
| 96. | 56560 | 8.4% | 6.2%(+2.19)#96 | 6.2%(+2.20)#6,317 |
| 97. | 55711 | 8.4% | 6.2%(+2.17)#97 | 6.2%(+2.19)#6,355 |
| 98. | 56265 | 8.3% | 6.2%(+2.14)#98 | 6.2%(+2.16)#6,420 |
| 99. | 55944 | 8.3% | 6.2%(+2.14)#99 | 6.2%(+2.16)#6,425 |
| 100. | 55959 | 8.3% | 6.2%(+2.07)#100 | 6.2%(+2.08)#6,582 |
Common Questions
What are the Top 10 Zip Codes with the Highest Percentage of Population Employed in Education Instruction & Library in Minnesota?
Top 10 Zip Codes with the Highest Percentage of Population Employed in Education Instruction & Library in Minnesota are:
What zip code has the Highest Percentage of Population Employed in Education Instruction & Library in Minnesota?
56525 has the Highest Percentage of Population Employed in Education Instruction & Library in Minnesota with 23.1%.
What is the Percentage of Population Employed in Education Instruction & Library in the State of Minnesota?
Percentage of Population Employed in Education Instruction & Library in Minnesota is 6.2%.
What is the Percentage of Population Employed in Education Instruction & Library in the United States?
Percentage of Population Employed in Education Instruction & Library in the United States is 6.2%.