Zip Codes with the Highest Percentage of Population Employed in Community & Social Service in Minnesota
RELATED REPORTS & OPTIONS
Community & Social Service
Minnesota
Compare Zip Codes
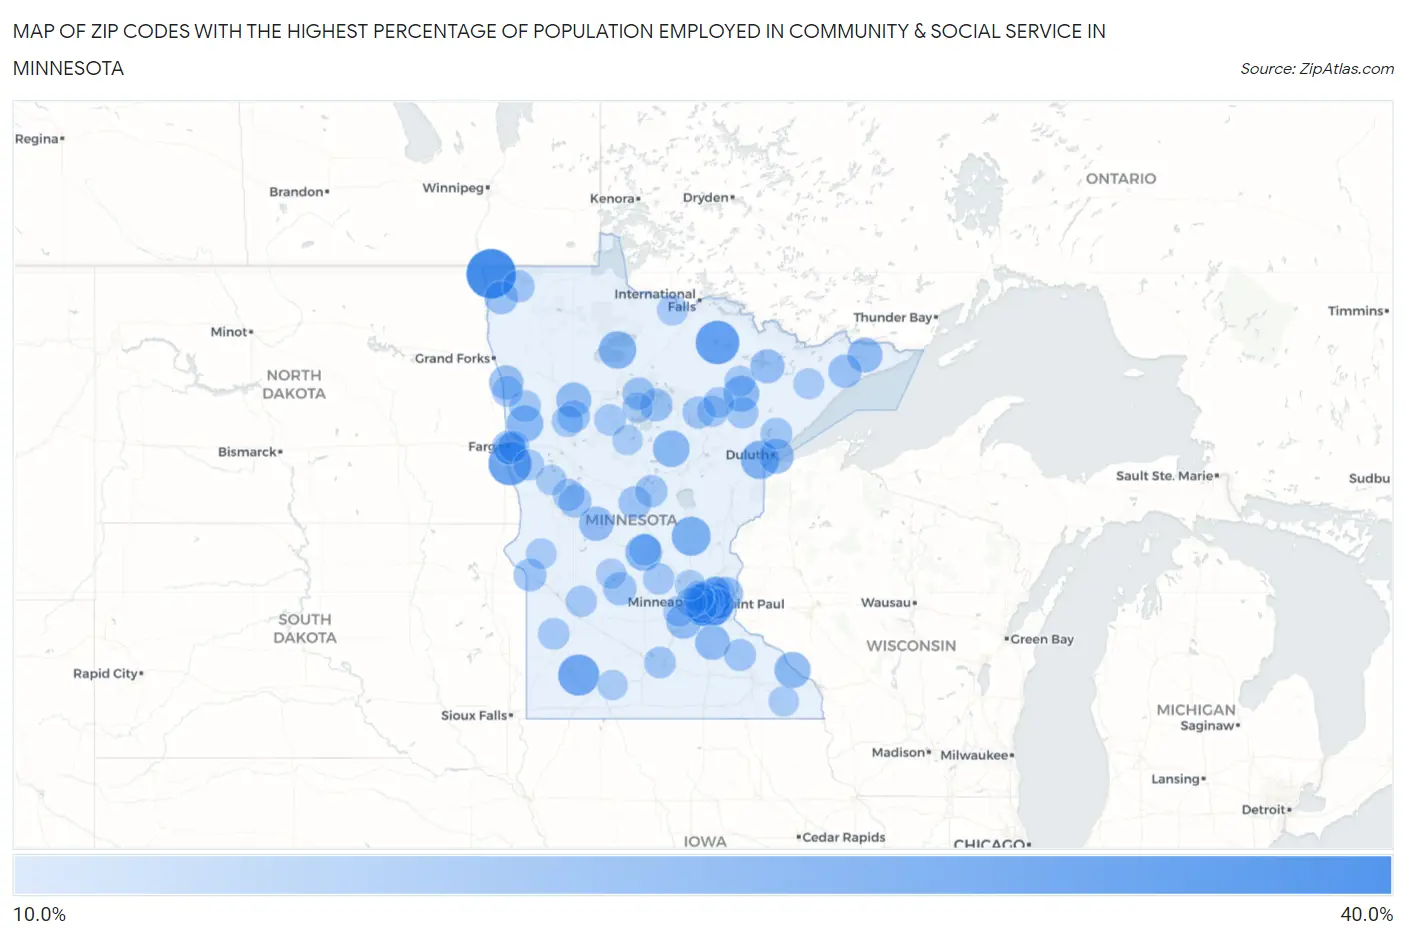
Map of Zip Codes with the Highest Percentage of Population Employed in Community & Social Service in Minnesota
10.0%
40.0%
Zip Codes with the Highest Percentage of Population Employed in Community & Social Service in Minnesota
| Zip Code | % Employed | vs State | vs National | |
| 1. | 56731 | 31.8% | 11.4%(+20.5)#1 | 11.2%(+20.6)#495 |
| 2. | 55772 | 26.1% | 11.4%(+14.7)#2 | 11.2%(+14.9)#863 |
| 3. | 56525 | 25.6% | 11.4%(+14.3)#3 | 11.2%(+14.4)#906 |
| 4. | 56125 | 23.8% | 11.4%(+12.5)#4 | 11.2%(+12.6)#1,142 |
| 5. | 55105 | 23.2% | 11.4%(+11.9)#5 | 11.2%(+12.0)#1,244 |
| 6. | 55108 | 23.0% | 11.4%(+11.6)#6 | 11.2%(+11.8)#1,283 |
| 7. | 55405 | 22.9% | 11.4%(+11.5)#7 | 11.2%(+11.7)#1,291 |
| 8. | 55409 | 22.2% | 11.4%(+10.9)#8 | 11.2%(+11.0)#1,430 |
| 9. | 56313 | 21.7% | 11.4%(+10.4)#9 | 11.2%(+10.5)#1,535 |
| 10. | 55733 | 21.1% | 11.4%(+9.77)#10 | 11.2%(+9.92)#1,677 |
| 11. | 55424 | 21.1% | 11.4%(+9.76)#11 | 11.2%(+9.90)#1,681 |
| 12. | 55114 | 21.1% | 11.4%(+9.73)#12 | 11.2%(+9.88)#1,689 |
| 13. | 55419 | 20.5% | 11.4%(+9.16)#13 | 11.2%(+9.30)#1,860 |
| 14. | 56666 | 20.4% | 11.4%(+9.08)#14 | 11.2%(+9.22)#1,896 |
| 15. | 55406 | 20.1% | 11.4%(+8.79)#15 | 11.2%(+8.93)#1,973 |
| 16. | 55414 | 19.7% | 11.4%(+8.36)#16 | 11.2%(+8.50)#2,121 |
| 17. | 56321 | 19.7% | 11.4%(+8.32)#17 | 11.2%(+8.46)#2,136 |
| 18. | 56662 | 19.6% | 11.4%(+8.27)#18 | 11.2%(+8.41)#2,151 |
| 19. | 56519 | 19.6% | 11.4%(+8.21)#19 | 11.2%(+8.35)#2,178 |
| 20. | 55413 | 19.4% | 11.4%(+8.03)#20 | 11.2%(+8.17)#2,240 |
| 21. | 55407 | 19.3% | 11.4%(+7.95)#21 | 11.2%(+8.10)#2,266 |
| 22. | 55959 | 19.1% | 11.4%(+7.73)#22 | 11.2%(+7.87)#2,357 |
| 23. | 55768 | 19.0% | 11.4%(+7.66)#23 | 11.2%(+7.81)#2,390 |
| 24. | 55116 | 18.6% | 11.4%(+7.26)#24 | 11.2%(+7.41)#2,545 |
| 25. | 55410 | 18.3% | 11.4%(+6.93)#25 | 11.2%(+7.08)#2,675 |
| 26. | 55315 | 18.2% | 11.4%(+6.86)#26 | 11.2%(+7.00)#2,710 |
| 27. | 56651 | 18.2% | 11.4%(+6.86)#27 | 11.2%(+7.00)#2,711 |
| 28. | 55417 | 18.2% | 11.4%(+6.84)#28 | 11.2%(+6.98)#2,717 |
| 29. | 55604 | 18.2% | 11.4%(+6.80)#29 | 11.2%(+6.95)#2,740 |
| 30. | 55802 | 18.1% | 11.4%(+6.78)#30 | 11.2%(+6.92)#2,756 |
| 31. | 55403 | 18.1% | 11.4%(+6.73)#31 | 11.2%(+6.87)#2,774 |
| 32. | 55057 | 18.1% | 11.4%(+6.69)#32 | 11.2%(+6.84)#2,790 |
| 33. | 55418 | 17.6% | 11.4%(+6.23)#33 | 11.2%(+6.37)#3,021 |
| 34. | 56355 | 17.6% | 11.4%(+6.21)#34 | 11.2%(+6.36)#3,031 |
| 35. | 56523 | 17.4% | 11.4%(+6.01)#35 | 11.2%(+6.15)#3,143 |
| 36. | 55127 | 17.3% | 11.4%(+5.94)#36 | 11.2%(+6.09)#3,184 |
| 37. | 55782 | 17.3% | 11.4%(+5.92)#37 | 11.2%(+6.06)#3,200 |
| 38. | 55150 | 17.1% | 11.4%(+5.78)#38 | 11.2%(+5.93)#3,293 |
| 39. | 56562 | 17.0% | 11.4%(+5.64)#39 | 11.2%(+5.78)#3,383 |
| 40. | 55115 | 16.9% | 11.4%(+5.50)#40 | 11.2%(+5.65)#3,474 |
| 41. | 55102 | 16.7% | 11.4%(+5.33)#41 | 11.2%(+5.48)#3,570 |
| 42. | 56733 | 16.7% | 11.4%(+5.31)#42 | 11.2%(+5.45)#3,595 |
| 43. | 55615 | 16.7% | 11.4%(+5.31)#43 | 11.2%(+5.45)#3,596 |
| 44. | 56209 | 16.5% | 11.4%(+5.11)#44 | 11.2%(+5.25)#3,725 |
| 45. | 56626 | 16.2% | 11.4%(+4.86)#45 | 11.2%(+5.00)#3,899 |
| 46. | 56278 | 16.1% | 11.4%(+4.79)#46 | 11.2%(+4.93)#3,960 |
| 47. | 56443 | 16.1% | 11.4%(+4.76)#47 | 11.2%(+4.90)#3,983 |
| 48. | 55104 | 16.1% | 11.4%(+4.75)#48 | 11.2%(+4.90)#3,988 |
| 49. | 56524 | 16.0% | 11.4%(+4.63)#49 | 11.2%(+4.77)#4,075 |
| 50. | 56663 | 15.9% | 11.4%(+4.55)#50 | 11.2%(+4.69)#4,142 |
| 51. | 55408 | 15.9% | 11.4%(+4.51)#51 | 11.2%(+4.65)#4,178 |
| 52. | 55113 | 15.8% | 11.4%(+4.43)#52 | 11.2%(+4.58)#4,243 |
| 53. | 56566 | 15.8% | 11.4%(+4.43)#53 | 11.2%(+4.58)#4,247 |
| 54. | 56425 | 15.7% | 11.4%(+4.38)#54 | 11.2%(+4.53)#4,299 |
| 55. | 55401 | 15.7% | 11.4%(+4.38)#55 | 11.2%(+4.53)#4,302 |
| 56. | 55722 | 15.7% | 11.4%(+4.37)#56 | 11.2%(+4.52)#4,311 |
| 57. | 55402 | 15.5% | 11.4%(+4.12)#57 | 11.2%(+4.27)#4,515 |
| 58. | 55992 | 15.5% | 11.4%(+4.10)#58 | 11.2%(+4.24)#4,554 |
| 59. | 56734 | 15.4% | 11.4%(+4.06)#59 | 11.2%(+4.20)#4,589 |
| 60. | 56515 | 15.4% | 11.4%(+4.01)#60 | 11.2%(+4.15)#4,646 |
| 61. | 55738 | 15.3% | 11.4%(+3.95)#61 | 11.2%(+4.09)#4,696 |
| 62. | 55803 | 15.3% | 11.4%(+3.93)#62 | 11.2%(+4.07)#4,716 |
| 63. | 56510 | 15.3% | 11.4%(+3.92)#63 | 11.2%(+4.06)#4,724 |
| 64. | 56374 | 15.3% | 11.4%(+3.90)#64 | 11.2%(+4.04)#4,744 |
| 65. | 56560 | 15.2% | 11.4%(+3.88)#65 | 11.2%(+4.03)#4,761 |
| 66. | 56003 | 15.1% | 11.4%(+3.74)#66 | 11.2%(+3.88)#4,874 |
| 67. | 55454 | 15.1% | 11.4%(+3.71)#67 | 11.2%(+3.85)#4,906 |
| 68. | 56589 | 15.0% | 11.4%(+3.65)#68 | 11.2%(+3.79)#4,954 |
| 69. | 56264 | 15.0% | 11.4%(+3.64)#69 | 11.2%(+3.79)#4,959 |
| 70. | 55439 | 15.0% | 11.4%(+3.60)#70 | 11.2%(+3.74)#5,005 |
| 71. | 55126 | 14.9% | 11.4%(+3.55)#71 | 11.2%(+3.69)#5,052 |
| 72. | 56458 | 14.9% | 11.4%(+3.54)#72 | 11.2%(+3.68)#5,063 |
| 73. | 55412 | 14.9% | 11.4%(+3.53)#73 | 11.2%(+3.67)#5,069 |
| 74. | 55422 | 14.9% | 11.4%(+3.51)#74 | 11.2%(+3.65)#5,091 |
| 75. | 55302 | 14.8% | 11.4%(+3.46)#75 | 11.2%(+3.60)#5,142 |
| 76. | 55435 | 14.8% | 11.4%(+3.42)#76 | 11.2%(+3.56)#5,183 |
| 77. | 55775 | 14.7% | 11.4%(+3.35)#77 | 11.2%(+3.49)#5,256 |
| 78. | 56260 | 14.7% | 11.4%(+3.34)#78 | 11.2%(+3.49)#5,263 |
| 79. | 55416 | 14.6% | 11.4%(+3.29)#79 | 11.2%(+3.43)#5,310 |
| 80. | 55387 | 14.6% | 11.4%(+3.20)#80 | 11.2%(+3.34)#5,429 |
| 81. | 56568 | 14.5% | 11.4%(+3.19)#81 | 11.2%(+3.33)#5,439 |
| 82. | 56529 | 14.5% | 11.4%(+3.18)#82 | 11.2%(+3.32)#5,443 |
| 83. | 55710 | 14.5% | 11.4%(+3.14)#83 | 11.2%(+3.29)#5,472 |
| 84. | 55436 | 14.4% | 11.4%(+3.05)#84 | 11.2%(+3.20)#5,577 |
| 85. | 56514 | 14.4% | 11.4%(+3.04)#85 | 11.2%(+3.18)#5,594 |
| 86. | 55753 | 14.4% | 11.4%(+3.02)#86 | 11.2%(+3.16)#5,611 |
| 87. | 55607 | 14.3% | 11.4%(+2.93)#87 | 11.2%(+3.07)#5,725 |
| 88. | 56654 | 14.3% | 11.4%(+2.93)#88 | 11.2%(+3.07)#5,734 |
| 89. | 56221 | 14.2% | 11.4%(+2.85)#89 | 11.2%(+3.00)#5,817 |
| 90. | 55101 | 14.1% | 11.4%(+2.71)#90 | 11.2%(+2.85)#6,010 |
| 91. | 55442 | 14.0% | 11.4%(+2.68)#91 | 11.2%(+2.82)#6,050 |
| 92. | 55949 | 14.0% | 11.4%(+2.64)#92 | 11.2%(+2.79)#6,086 |
| 93. | 56633 | 14.0% | 11.4%(+2.61)#93 | 11.2%(+2.76)#6,123 |
| 94. | 55441 | 13.9% | 11.4%(+2.58)#94 | 11.2%(+2.72)#6,176 |
| 95. | 56534 | 13.9% | 11.4%(+2.54)#95 | 11.2%(+2.69)#6,214 |
| 96. | 56433 | 13.9% | 11.4%(+2.53)#96 | 11.2%(+2.68)#6,219 |
| 97. | 56273 | 13.9% | 11.4%(+2.51)#97 | 11.2%(+2.65)#6,250 |
| 98. | 56159 | 13.8% | 11.4%(+2.47)#98 | 11.2%(+2.61)#6,307 |
| 99. | 55391 | 13.8% | 11.4%(+2.43)#99 | 11.2%(+2.58)#6,360 |
| 100. | 55374 | 13.8% | 11.4%(+2.41)#100 | 11.2%(+2.55)#6,395 |
Common Questions
What are the Top 10 Zip Codes with the Highest Percentage of Population Employed in Community & Social Service in Minnesota?
Top 10 Zip Codes with the Highest Percentage of Population Employed in Community & Social Service in Minnesota are:
What zip code has the Highest Percentage of Population Employed in Community & Social Service in Minnesota?
56731 has the Highest Percentage of Population Employed in Community & Social Service in Minnesota with 31.8%.
What is the Percentage of Population Employed in Community & Social Service in the State of Minnesota?
Percentage of Population Employed in Community & Social Service in Minnesota is 11.4%.
What is the Percentage of Population Employed in Community & Social Service in the United States?
Percentage of Population Employed in Community & Social Service in the United States is 11.2%.