Zip Codes with the Highest Percentage of Population Employed in Security & Protection in Minneapolis, MN

RELATED REPORTS & OPTIONS

Security & Protection
Population
Families and Households
Female Fertility
Female Fertility (Unmarried)
Race (Community Size)
Race (Percentage)
Ancestry (Community Size)
AfghanAfricanAlaska NativeAlbanianAlsatianAmericanApacheArabArgentineanArmenianAssyrian / Chaldean / SyriacAustralianAustrianBahamianBangladeshiBarbadianBasqueBelgianBelizeanBhutaneseBlackfeetBolivianBrazilianBritishBritish West IndianBulgarianBurmeseCajunCambodianCanadianCape VerdeanCarpatho RusynCelticCentral AmericanCentral American IndianCherokeeCheyenneChickasawChileanChippewaChoctawColombianComancheCosta RicanCreeCreekCroatianCrowCubanCypriotCzechCzechoslovakianDanishDominicanDutchEastern EuropeanEcuadorianEgyptianEnglishEstonianEthiopianEuropeanFijianFilipinoFinnishFrenchFrench American IndianFrench CanadianGermanGerman RussianGhanaianGreekGuamanian / ChamorroGuatemalanGuyaneseHaitianHonduranHungarianIcelanderIndian (Asian)IndonesianInupiatIranianIraqiIrishIroquoisIsraeliItalianJamaicanJapaneseJordanianKenyanKoreanLaotianLatvianLebaneseLiberianLithuanianLuxembourgerMacedonianMalaysianMalteseMenomineeMexicanMexican American IndianMongolianMoroccanNative HawaiianNavajoNicaraguanNigerianNorthern EuropeanNorwegianOkinawanOsagePakistaniPalestinianPanamanianParaguayanPennsylvania GermanPeruvianPolishPortuguesePotawatomiPuerto RicanRomanianRussianSalvadoranSamoanScandinavianScotch-IrishScottishSenegaleseSerbianSierra LeoneanSiouxSlavicSlovakSloveneSomaliSouth AfricanSouth AmericanSouth American IndianSoviet UnionSpaniardSpanishSri LankanSubsaharan AfricanSudaneseSwedishSwissSyrianThaiTonganTrinidadian and TobagonianTurkishUgandanUkrainianUruguayanVenezuelanVietnameseWelshWest IndianYugoslavian
Ancestry (Percentage)
AfghanAfricanAlaska NativeAlbanianAlsatianAmericanApacheArabArgentineanArmenianAssyrian / Chaldean / SyriacAustralianAustrianBahamianBangladeshiBarbadianBasqueBelgianBelizeanBhutaneseBlackfeetBolivianBrazilianBritishBritish West IndianBulgarianBurmeseCajunCambodianCanadianCape VerdeanCarpatho RusynCelticCentral AmericanCentral American IndianCherokeeCheyenneChickasawChileanChippewaChoctawColombianComancheCosta RicanCreeCreekCroatianCrowCubanCypriotCzechCzechoslovakianDanishDominicanDutchEastern EuropeanEcuadorianEgyptianEnglishEstonianEthiopianEuropeanFijianFilipinoFinnishFrenchFrench American IndianFrench CanadianGermanGerman RussianGhanaianGreekGuamanian / ChamorroGuatemalanGuyaneseHaitianHonduranHungarianIcelanderIndian (Asian)IndonesianInupiatIranianIraqiIrishIroquoisIsraeliItalianJamaicanJapaneseJordanianKenyanKoreanLaotianLatvianLebaneseLiberianLithuanianLuxembourgerMacedonianMalaysianMalteseMenomineeMexicanMexican American IndianMongolianMoroccanNative HawaiianNavajoNicaraguanNigerianNorthern EuropeanNorwegianOkinawanOsagePakistaniPalestinianPanamanianParaguayanPennsylvania GermanPeruvianPolishPortuguesePotawatomiPuerto RicanRomanianRussianSalvadoranSamoanScandinavianScotch-IrishScottishSenegaleseSerbianSierra LeoneanSiouxSlavicSlovakSloveneSomaliSouth AfricanSouth AmericanSouth American IndianSoviet UnionSpaniardSpanishSri LankanSubsaharan AfricanSudaneseSwedishSwissSyrianThaiTonganTrinidadian and TobagonianTurkishUgandanUkrainianUruguayanVenezuelanVietnameseWelshWest IndianYugoslavian
Immigrant Origin (Total)
AfghanistanAfricaAlbaniaArgentinaAsiaAustraliaAustriaBahamasBangladeshBarbadosBelarusBelgiumBelizeBoliviaBosnia and HerzegovinaBrazilBulgariaBurma / MyanmarCabo VerdeCambodiaCameroonCanadaCaribbeanCentral AmericaChileChinaColombiaCongoCosta RicaCroatiaCubaCzechoslovakiaDenmarkDominican RepublicEastern AfricaEastern AsiaEastern EuropeEcuadorEgyptEl SalvadorEnglandEritreaEthiopiaEuropeFranceGermanyGhanaGreeceGuatemalaGuyanaHaitiHondurasHong KongHungaryIndiaIndonesiaIranIraqIrelandIsraelItalyJamaicaJapanJordanKazakhstanKenyaKoreaKuwaitLaosLatin AmericaLatviaLebanonLiberiaLithuaniaMalaysiaMexicoMicronesiaMiddle AfricaMoldovaMoroccoNepalNetherlandsNicaraguaNigeriaNorthern AfricaNorthern EuropeNorwayOceaniaPakistanPanamaPeruPhilippinesPolandRomaniaRussiaSaudi ArabiaScotlandSenegalSerbiaSierra LeoneSingaporeSomaliaSouth AfricaSouth AmericaSouth Central AsiaSouth Eastern AsiaSouthern EuropeSpainSri LankaSudanSwedenSwitzerlandSyriaTaiwanThailandTrinidad and TobagoTurkeyUgandaUkraineUruguayUzbekistanVenezuelaVietnamWestern AfricaWestern AsiaWestern EuropeYemenZaireZimbabwe
Immigrant Origin (Percentage)
AfghanistanAfricaAlbaniaArgentinaAsiaAustraliaAustriaBahamasBangladeshBarbadosBelarusBelgiumBelizeBoliviaBosnia and HerzegovinaBrazilBulgariaBurma / MyanmarCabo VerdeCambodiaCameroonCanadaCaribbeanCentral AmericaChileChinaColombiaCongoCosta RicaCroatiaCubaCzechoslovakiaDenmarkDominican RepublicEastern AfricaEastern AsiaEastern EuropeEcuadorEgyptEl SalvadorEnglandEritreaEthiopiaEuropeFranceGermanyGhanaGreeceGuatemalaGuyanaHaitiHondurasHong KongHungaryIndiaIndonesiaIranIraqIrelandIsraelItalyJamaicaJapanJordanKazakhstanKenyaKoreaKuwaitLaosLatin AmericaLatviaLebanonLiberiaLithuaniaMalaysiaMexicoMicronesiaMiddle AfricaMoldovaMoroccoNepalNetherlandsNicaraguaNigeriaNorthern AfricaNorthern EuropeNorwayOceaniaPakistanPanamaPeruPhilippinesPolandRomaniaRussiaSaudi ArabiaScotlandSenegalSerbiaSierra LeoneSingaporeSomaliaSouth AfricaSouth AmericaSouth Central AsiaSouth Eastern AsiaSouthern EuropeSpainSri LankaSudanSwedenSwitzerlandSyriaTaiwanThailandTrinidad and TobagoTurkeyUgandaUkraineUruguayUzbekistanVenezuelaVietnamWestern AfricaWestern AsiaWestern EuropeYemenZaireZimbabwe
Income
Income (Families)
Income (Households)
Poverty
Poverty (Families)
Unemployment
Employment Occupations
Employment Industries
Employer Class
Commute Time
Commute Means
School Enrollment
Education by Degree Field
Occupancy
Finances
Physical Characteristics
Minneapolis
Compare Zip Codes
Comparison Subject

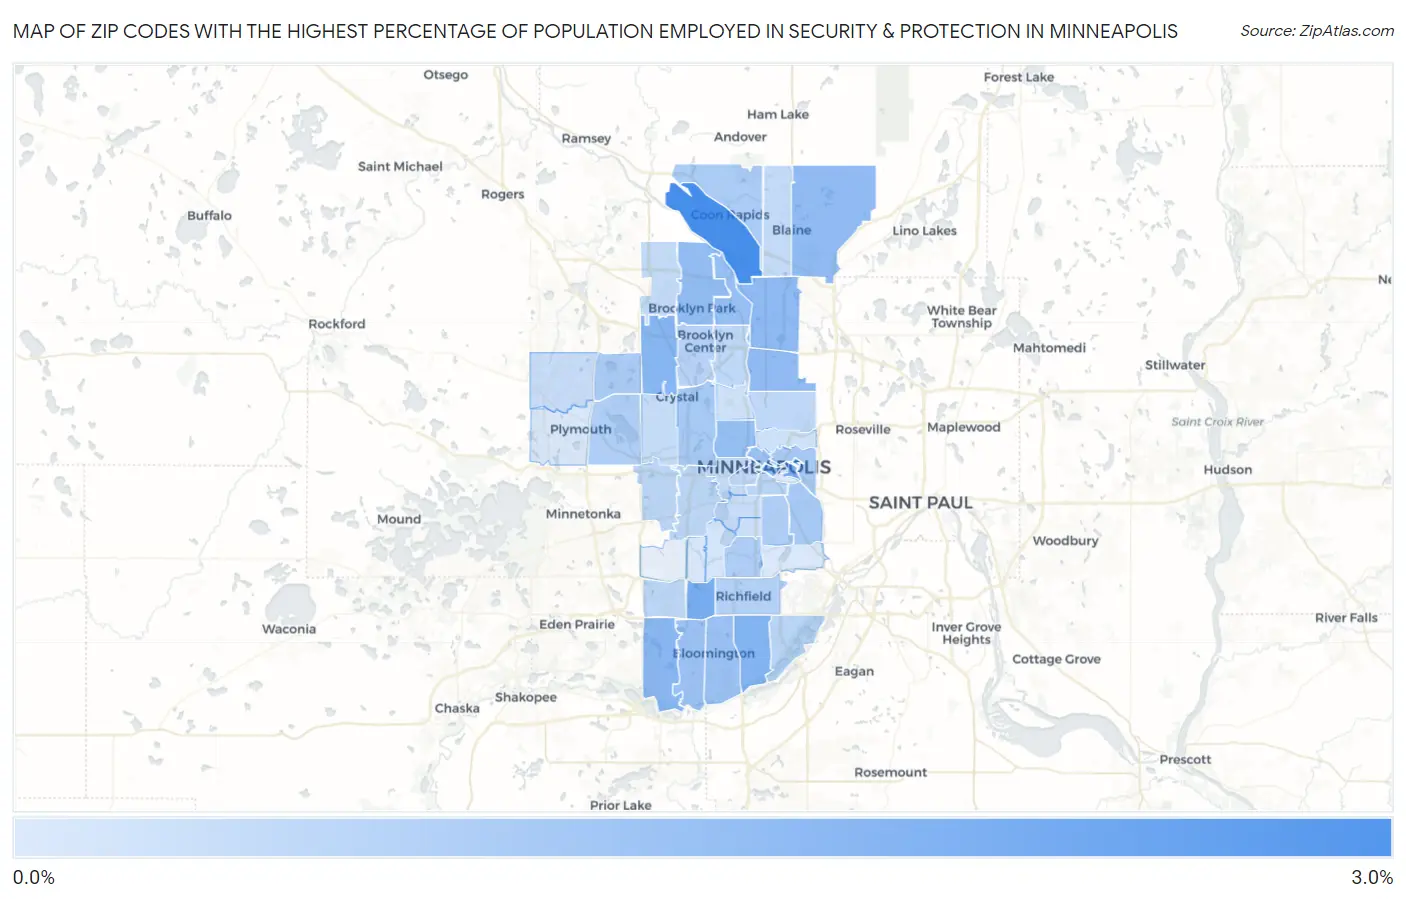
Map of Zip Codes with the Highest Percentage of Population Employed in Security & Protection in Minneapolis

0.0%
3.0%
Zip Codes with the Highest Percentage of Population Employed in Security & Protection in Minneapolis Map

Zip Codes with the Highest Percentage of Population Employed in Security & Protection in Minneapolis, MN

Zip Code % Employed vs State vs National
1.554332.9%1.3%(+1.62)#632.1%(+0.791)#7,479
2.554352.0%1.3%(+0.710)#1532.1%(-0.120)#12,370
3.554552.0%1.3%(+0.650)#1692.1%(-0.179)#12,761
4.554201.9%1.3%(+0.532)#1882.1%(-0.297)#13,554
5.554281.7%1.3%(+0.407)#2052.1%(-0.423)#14,484
6.554151.7%1.3%(+0.384)#2142.1%(-0.445)#14,662
7.554381.7%1.3%(+0.378)#2162.1%(-0.451)#14,704
8.554321.6%1.3%(+0.284)#2352.1%(-0.545)#15,388
9.554491.6%1.3%(+0.271)#2392.1%(-0.558)#15,484
10.554211.6%1.3%(+0.242)#2442.1%(-0.587)#15,709
11.554431.5%1.3%(+0.223)#2492.1%(-0.606)#15,856
12.554111.5%1.3%(+0.188)#2632.1%(-0.642)#16,134
13.554441.4%1.3%(+0.130)#2822.1%(-0.699)#16,581
14.554371.4%1.3%(+0.100)#2842.1%(-0.730)#16,811
15.554311.4%1.3%(+0.079)#2852.1%(-0.750)#16,959
16.554011.4%1.3%(+0.056)#2922.1%(-0.773)#17,141
17.554141.2%1.3%(-0.145)#3522.1%(-0.975)#18,710
18.554221.2%1.3%(-0.147)#3532.1%(-0.976)#18,723
19.554061.1%1.3%(-0.185)#3662.1%(-1.01)#19,031
20.554421.1%1.3%(-0.219)#3822.1%(-1.05)#19,280
21.554481.1%1.3%(-0.236)#3862.1%(-1.06)#19,413
22.554191.0%1.3%(-0.271)#3932.1%(-1.10)#19,678
23.554071.0%1.3%(-0.284)#3952.1%(-1.11)#19,773
24.554410.98%1.3%(-0.337)#4122.1%(-1.17)#20,182
25.554230.94%1.3%(-0.382)#4402.1%(-1.21)#20,526
26.554290.84%1.3%(-0.477)#4732.1%(-1.31)#21,155
27.554040.83%1.3%(-0.487)#4772.1%(-1.32)#21,211
28.554250.83%1.3%(-0.489)#4792.1%(-1.32)#21,230
29.554260.78%1.3%(-0.537)#4962.1%(-1.37)#21,519
30.554390.76%1.3%(-0.560)#5042.1%(-1.39)#21,661
31.554160.76%1.3%(-0.561)#5052.1%(-1.39)#21,668
32.554300.74%1.3%(-0.576)#5132.1%(-1.41)#21,783
33.554180.71%1.3%(-0.605)#5232.1%(-1.43)#21,972
34.554030.69%1.3%(-0.632)#5302.1%(-1.46)#22,167
35.554450.67%1.3%(-0.653)#5342.1%(-1.48)#22,298
36.554340.64%1.3%(-0.683)#5452.1%(-1.51)#22,462
37.554270.63%1.3%(-0.692)#5482.1%(-1.52)#22,510
38.554050.59%1.3%(-0.727)#5582.1%(-1.56)#22,709
39.554080.56%1.3%(-0.759)#5682.1%(-1.59)#22,889
40.554460.56%1.3%(-0.762)#5702.1%(-1.59)#22,917
41.554090.50%1.3%(-0.824)#5932.1%(-1.65)#23,260
42.554120.45%1.3%(-0.867)#6112.1%(-1.70)#23,479
43.554130.43%1.3%(-0.886)#6162.1%(-1.71)#23,568
44.554100.37%1.3%(-0.949)#6372.1%(-1.78)#23,876
45.554240.26%1.3%(-1.06)#6722.1%(-1.89)#24,342
46.554170.22%1.3%(-1.10)#6882.1%(-1.93)#24,465
47.554470.21%1.3%(-1.11)#6902.1%(-1.94)#24,491
48.554540.19%1.3%(-1.13)#6972.1%(-1.96)#24,551

Common Questions

What are the Top 10 Zip Codes with the Highest Percentage of Population Employed in Security & Protection in Minneapolis, MN?
Top 10 Zip Codes with the Highest Percentage of Population Employed in Security & Protection in Minneapolis, MN are:
#1
2.9%
#2
2.0%
#3
2.0%
#4
1.9%
#5
1.7%
#6
1.7%
#7
1.7%
#8
1.6%
#9
1.6%
#10
1.6%
What zip code has the Highest Percentage of Population Employed in Security & Protection in Minneapolis, MN?
55433 has the Highest Percentage of Population Employed in Security & Protection in Minneapolis, MN with 2.9%.
What is the Percentage of Population Employed in Security & Protection in Minneapolis, MN?
Percentage of Population Employed in Security & Protection in Minneapolis is 0.84%.
What is the Percentage of Population Employed in Security & Protection in Minnesota?
Percentage of Population Employed in Security & Protection in Minnesota is 1.3%.
What is the Percentage of Population Employed in Security & Protection in the United States?
Percentage of Population Employed in Security & Protection in the United States is 2.1%.