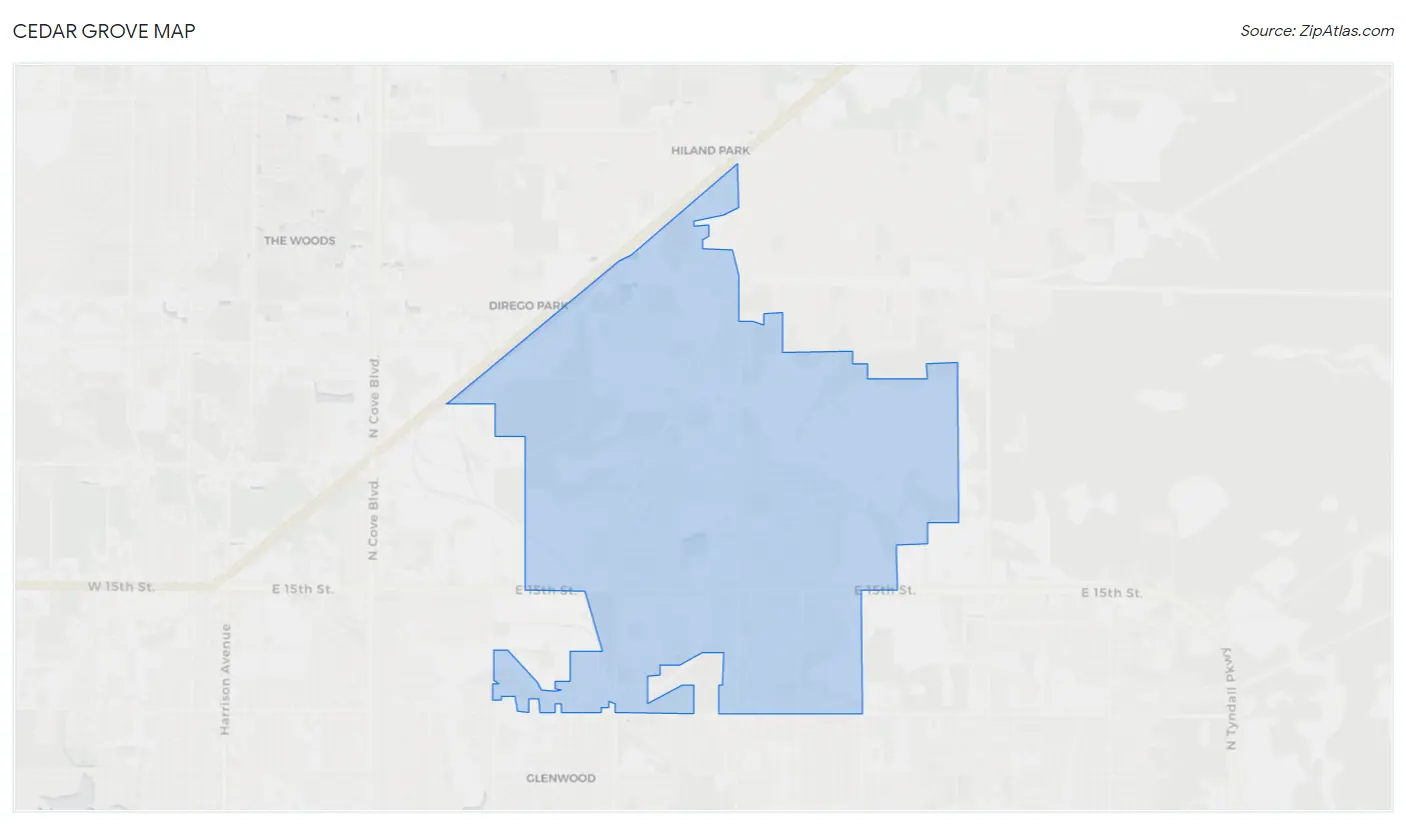
Cedar Grove, FL Map & Demographics
Cedar Grove Map
Cedar Grove Overview
$22,324
PER CAPITA INCOME
$46,026
AVG FAMILY INCOME
$45,041
AVG HOUSEHOLD INCOME
26.3%
WAGE / INCOME GAP [ % ]
73.7¢/ $1
WAGE / INCOME GAP [ $ ]
0.38
INEQUALITY / GINI INDEX
3,019
TOTAL POPULATION
1,429
MALE POPULATION
1,590
FEMALE POPULATION
89.87
MALES / 100 FEMALES
111.27
FEMALES / 100 MALES
35.2
MEDIAN AGE
3.1
AVG FAMILY SIZE
2.6
AVG HOUSEHOLD SIZE
1,412
LABOR FORCE [ PEOPLE ]
60.4%
PERCENT IN LABOR FORCE
2.8%
UNEMPLOYMENT RATE
Income in Cedar Grove
Income Overview in Cedar Grove
Per Capita Income in Cedar Grove is $22,324, while median incomes of families and households are $46,026 and $45,041 respectively.
| Characteristic | Number | Measure |
| Per Capita Income | 3,019 | $22,324 |
| Median Family Income | 825 | $46,026 |
| Mean Family Income | 825 | $59,652 |
| Median Household Income | 1,180 | $45,041 |
| Mean Household Income | 1,180 | $55,537 |
| Income Deficit | 825 | $0 |
| Wage / Income Gap (%) | 3,019 | 26.28% |
| Wage / Income Gap ($) | 3,019 | 73.72¢ per $1 |
| Gini / Inequality Index | 3,019 | 0.38 |
Earnings by Sex in Cedar Grove
Average Earnings in Cedar Grove are $30,790, $37,234 for men and $27,449 for women, a difference of 26.3%.
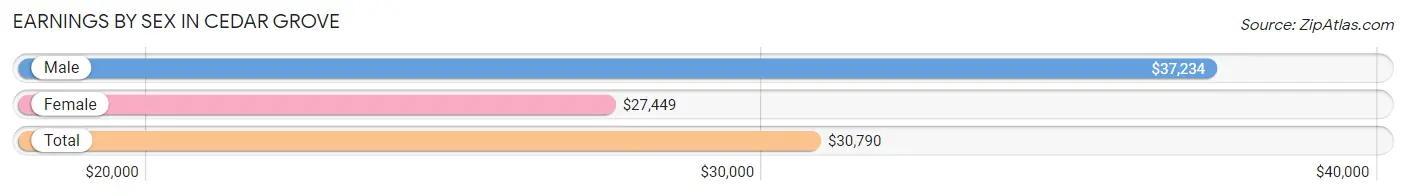
| Sex | Number | Average Earnings |
| Male | 775 (51.8%) | $37,234 |
| Female | 722 (48.2%) | $27,449 |
| Total | 1,497 (100.0%) | $30,790 |
Earnings by Sex by Income Bracket in Cedar Grove
The most common earnings brackets in Cedar Grove are $25,000 to $29,999 for men (120 | 15.5%) and $25,000 to $29,999 for women (129 | 17.9%).
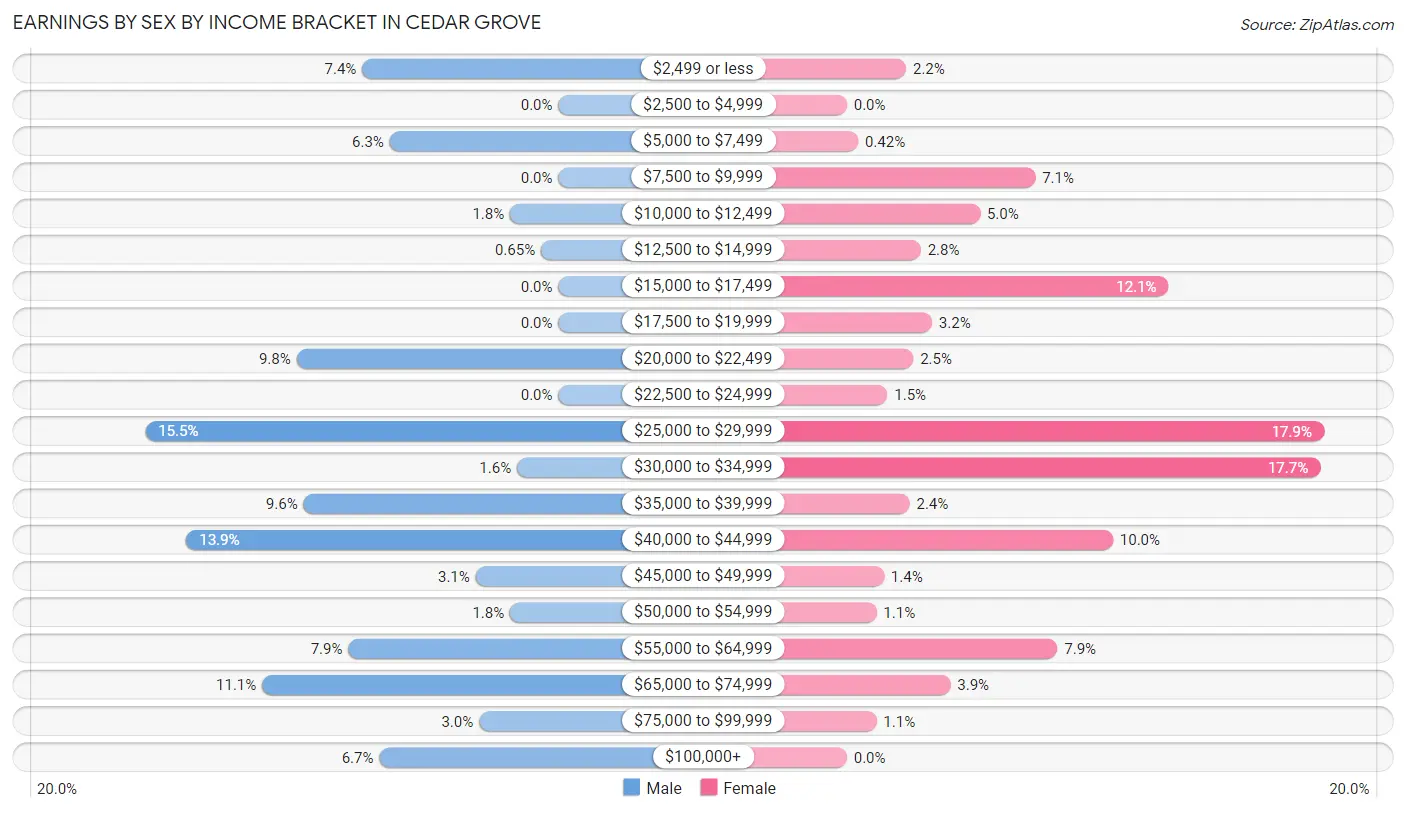
| Income | Male | Female |
| $2,499 or less | 57 (7.3%) | 16 (2.2%) |
| $2,500 to $4,999 | 0 (0.0%) | 0 (0.0%) |
| $5,000 to $7,499 | 49 (6.3%) | 3 (0.4%) |
| $7,500 to $9,999 | 0 (0.0%) | 51 (7.1%) |
| $10,000 to $12,499 | 14 (1.8%) | 36 (5.0%) |
| $12,500 to $14,999 | 5 (0.6%) | 20 (2.8%) |
| $15,000 to $17,499 | 0 (0.0%) | 87 (12.0%) |
| $17,500 to $19,999 | 0 (0.0%) | 23 (3.2%) |
| $20,000 to $22,499 | 76 (9.8%) | 18 (2.5%) |
| $22,500 to $24,999 | 0 (0.0%) | 11 (1.5%) |
| $25,000 to $29,999 | 120 (15.5%) | 129 (17.9%) |
| $30,000 to $34,999 | 12 (1.5%) | 128 (17.7%) |
| $35,000 to $39,999 | 74 (9.6%) | 17 (2.4%) |
| $40,000 to $44,999 | 108 (13.9%) | 72 (10.0%) |
| $45,000 to $49,999 | 24 (3.1%) | 10 (1.4%) |
| $50,000 to $54,999 | 14 (1.8%) | 8 (1.1%) |
| $55,000 to $64,999 | 61 (7.9%) | 57 (7.9%) |
| $65,000 to $74,999 | 86 (11.1%) | 28 (3.9%) |
| $75,000 to $99,999 | 23 (3.0%) | 8 (1.1%) |
| $100,000+ | 52 (6.7%) | 0 (0.0%) |
| Total | 775 (100.0%) | 722 (100.0%) |
Earnings by Sex by Educational Attainment in Cedar Grove
Average earnings in Cedar Grove are $40,475 for men and $29,032 for women, a difference of 28.3%. Men with an educational attainment of college or associate's degree enjoy the highest average annual earnings of $45,714, while those with bachelor's degree education earn the least with $2,499. Women with an educational attainment of bachelor's degree earn the most with the average annual earnings of $46,750, while those with college or associate's degree education have the smallest earnings of $27,217.
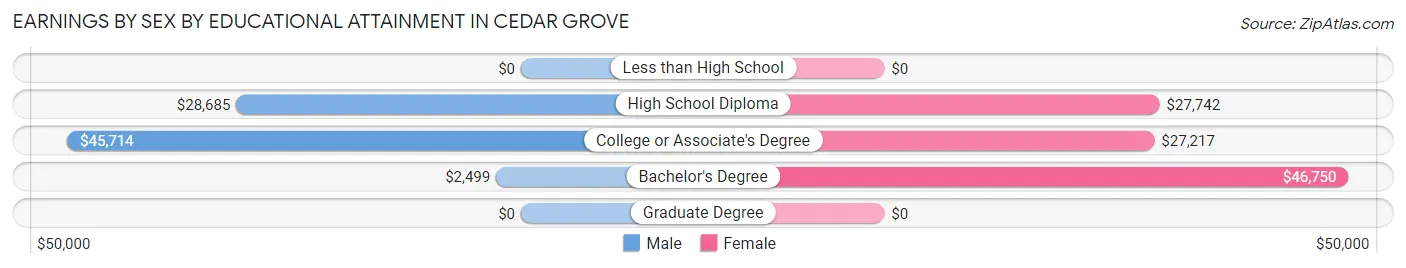
| Educational Attainment | Male Income | Female Income |
| Less than High School | - | - |
| High School Diploma | $28,685 | $27,742 |
| College or Associate's Degree | $45,714 | $27,217 |
| Bachelor's Degree | $2,499 | $46,750 |
| Graduate Degree | - | - |
| Total | $40,475 | $29,032 |
Family Income in Cedar Grove
Family Income Brackets in Cedar Grove
According to the Cedar Grove family income data, there are 275 families falling into the $35,000 to $49,999 income range, which is the most common income bracket and makes up 33.3% of all families.
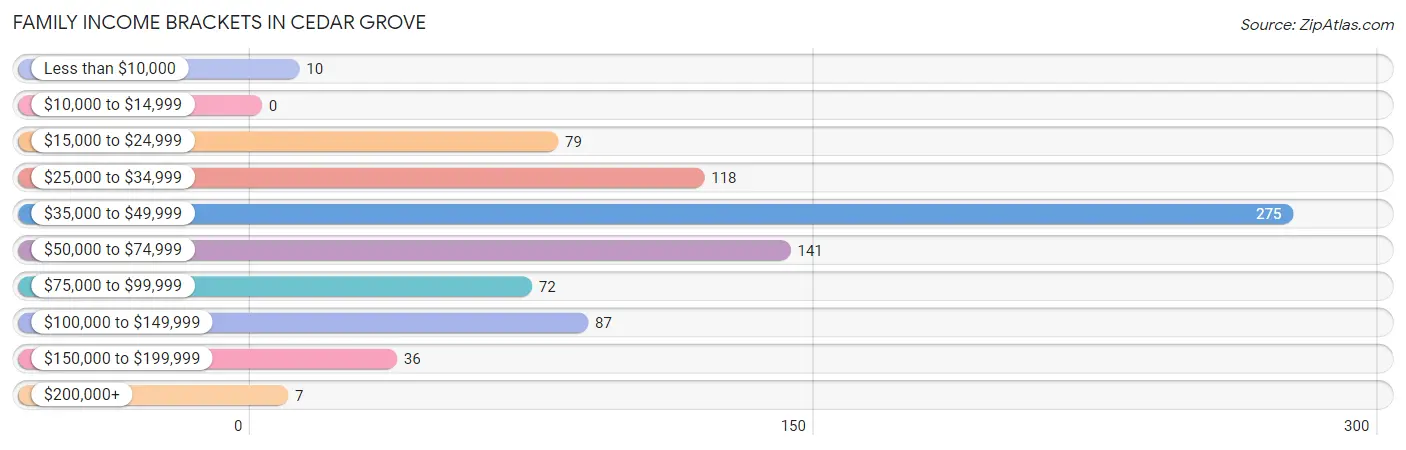
| Income Bracket | # Families | % Families |
| Less than $10,000 | 10 | 1.2% |
| $10,000 to $14,999 | 0 | 0.0% |
| $15,000 to $24,999 | 79 | 9.6% |
| $25,000 to $34,999 | 118 | 14.3% |
| $35,000 to $49,999 | 275 | 33.3% |
| $50,000 to $74,999 | 141 | 17.1% |
| $75,000 to $99,999 | 72 | 8.7% |
| $100,000 to $149,999 | 87 | 10.5% |
| $150,000 to $199,999 | 36 | 4.4% |
| $200,000+ | 7 | 0.8% |
Family Income by Famaliy Size in Cedar Grove
4-person families (57 | 6.9%) account for the highest median family income in Cedar Grove with $96,767 per family, while 4-person families (57 | 6.9%) have the highest median income of $24,192 per family member.
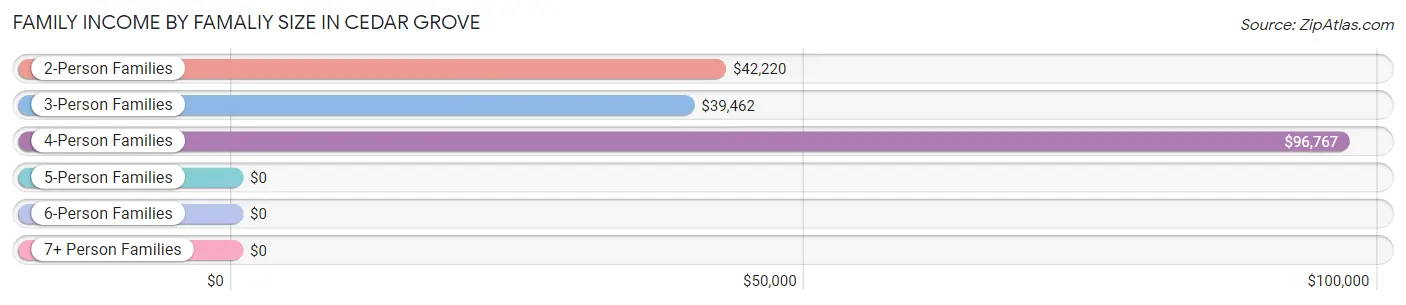
| Income Bracket | # Families | Median Income |
| 2-Person Families | 417 (50.5%) | $42,220 |
| 3-Person Families | 213 (25.8%) | $39,462 |
| 4-Person Families | 57 (6.9%) | $96,767 |
| 5-Person Families | 94 (11.4%) | $0 |
| 6-Person Families | 33 (4.0%) | $0 |
| 7+ Person Families | 11 (1.3%) | $0 |
| Total | 825 (100.0%) | $46,026 |
Family Income by Number of Earners in Cedar Grove
The median family income in Cedar Grove is $46,026, with families comprising 3+ earners (86) having the highest median family income of $121,154, while families with no earners (123) have the lowest median family income of $18,875, accounting for 10.4% and 14.9% of families, respectively.
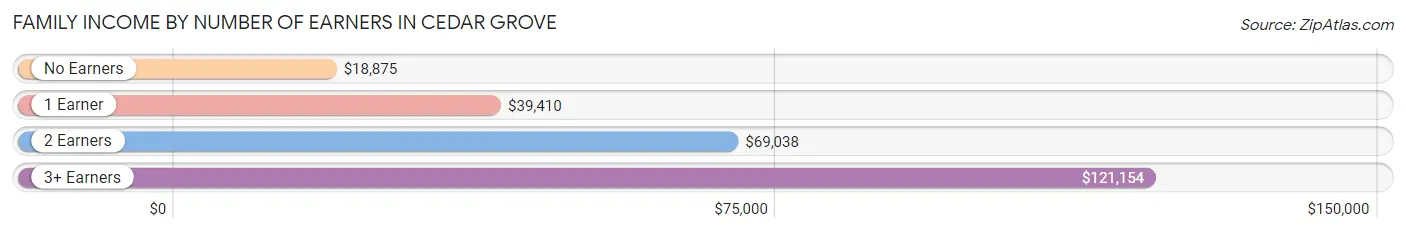
| Number of Earners | # Families | Median Income |
| No Earners | 123 (14.9%) | $18,875 |
| 1 Earner | 340 (41.2%) | $39,410 |
| 2 Earners | 276 (33.5%) | $69,038 |
| 3+ Earners | 86 (10.4%) | $121,154 |
| Total | 825 (100.0%) | $46,026 |
Household Income in Cedar Grove
Household Income Brackets in Cedar Grove
With 327 households falling in the category, the $35,000 to $49,999 income range is the most frequent in Cedar Grove, accounting for 27.7% of all households. In contrast, only 7 households (0.6%) fall into the $200,000+ income bracket, making it the least populous group.
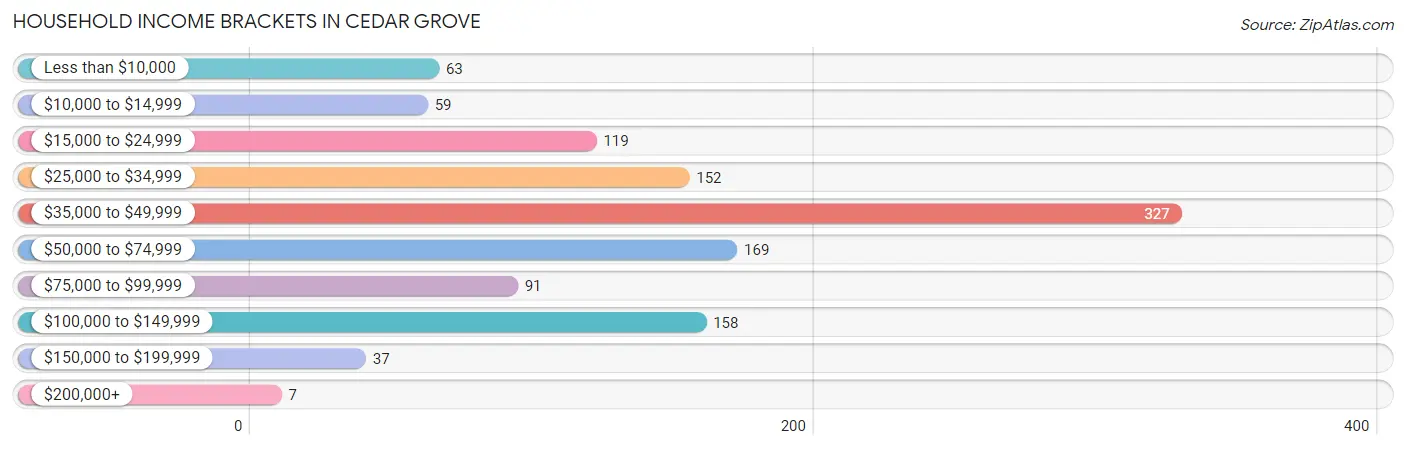
| Income Bracket | # Households | % Households |
| Less than $10,000 | 63 | 5.3% |
| $10,000 to $14,999 | 59 | 5.0% |
| $15,000 to $24,999 | 119 | 10.1% |
| $25,000 to $34,999 | 152 | 12.9% |
| $35,000 to $49,999 | 327 | 27.7% |
| $50,000 to $74,999 | 169 | 14.3% |
| $75,000 to $99,999 | 91 | 7.7% |
| $100,000 to $149,999 | 158 | 13.4% |
| $150,000 to $199,999 | 37 | 3.1% |
| $200,000+ | 7 | 0.6% |
Household Income by Householder Age in Cedar Grove
The median household income in Cedar Grove is $45,041, with the highest median household income of $58,286 found in the 25 to 44 years age bracket for the primary householder. A total of 412 households (34.9%) fall into this category. Meanwhile, the 15 to 24 years age bracket for the primary householder has the lowest median household income of $0, with 10 households (0.9%) in this group.
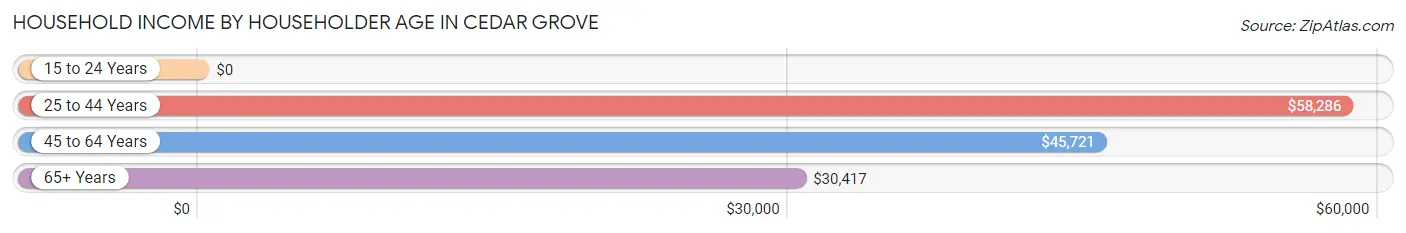
| Income Bracket | # Households | Median Income |
| 15 to 24 Years | 10 (0.9%) | $0 |
| 25 to 44 Years | 412 (34.9%) | $58,286 |
| 45 to 64 Years | 521 (44.2%) | $45,721 |
| 65+ Years | 237 (20.1%) | $30,417 |
| Total | 1,180 (100.0%) | $45,041 |
Poverty in Cedar Grove
Income Below Poverty by Sex and Age in Cedar Grove
With 13.5% poverty level for males and 17.0% for females among the residents of Cedar Grove, 65 to 74 year old males and under 5 year old females are the most vulnerable to poverty, with 56 males (43.8%) and 30 females (32.6%) in their respective age groups living below the poverty level.
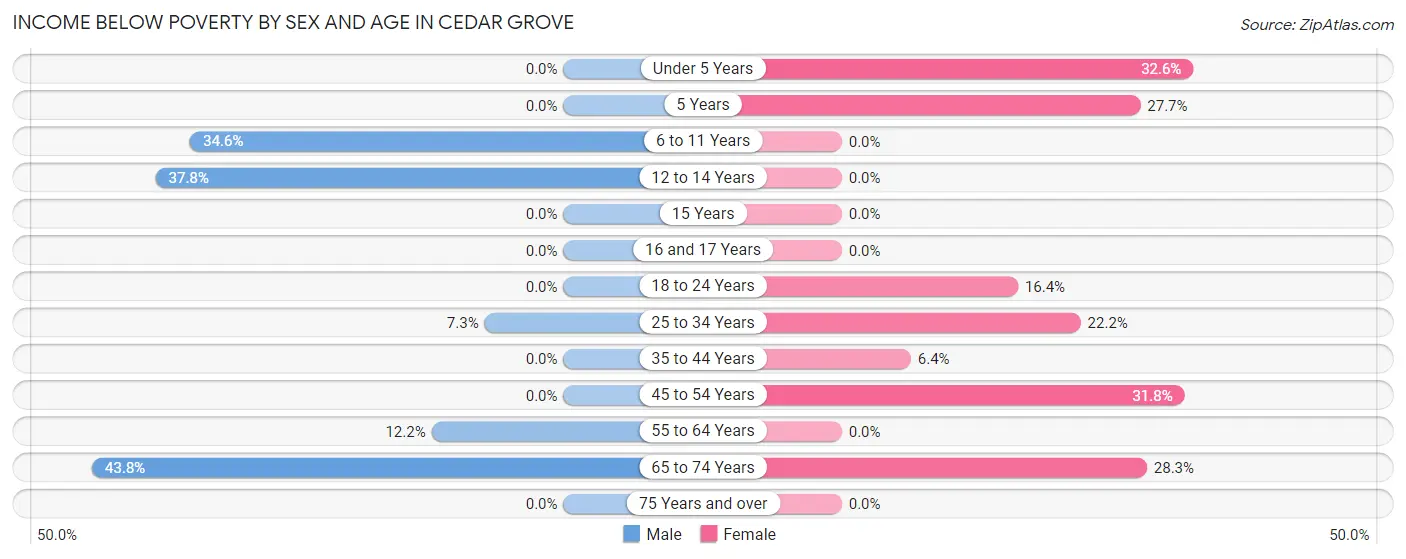
| Age Bracket | Male | Female |
| Under 5 Years | 0 (0.0%) | 30 (32.6%) |
| 5 Years | 0 (0.0%) | 23 (27.7%) |
| 6 to 11 Years | 53 (34.6%) | 0 (0.0%) |
| 12 to 14 Years | 28 (37.8%) | 0 (0.0%) |
| 15 Years | 0 (0.0%) | 0 (0.0%) |
| 16 and 17 Years | 0 (0.0%) | 0 (0.0%) |
| 18 to 24 Years | 0 (0.0%) | 34 (16.4%) |
| 25 to 34 Years | 15 (7.3%) | 51 (22.2%) |
| 35 to 44 Years | 0 (0.0%) | 10 (6.4%) |
| 45 to 54 Years | 0 (0.0%) | 76 (31.8%) |
| 55 to 64 Years | 41 (12.2%) | 0 (0.0%) |
| 65 to 74 Years | 56 (43.8%) | 47 (28.3%) |
| 75 Years and over | 0 (0.0%) | 0 (0.0%) |
| Total | 193 (13.5%) | 271 (17.0%) |
Income Above Poverty by Sex and Age in Cedar Grove
According to the poverty statistics in Cedar Grove, males aged under 5 years and females aged 6 to 11 years are the age groups that are most secure financially, with 100.0% of males and 100.0% of females in these age groups living above the poverty line.
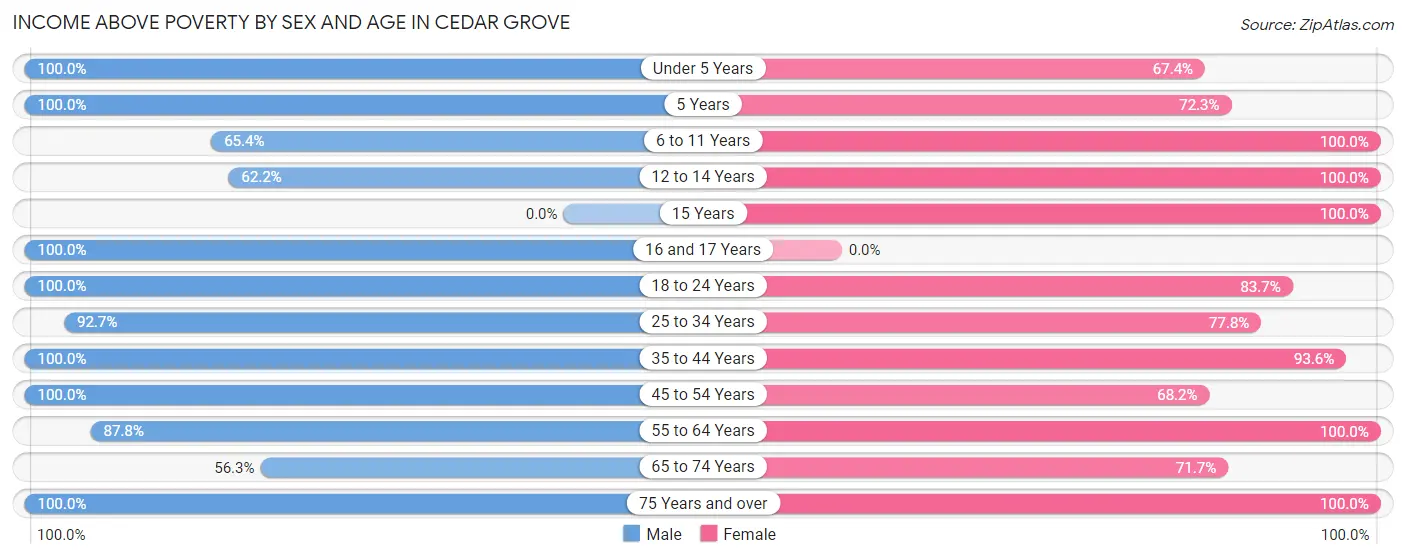
| Age Bracket | Male | Female |
| Under 5 Years | 83 (100.0%) | 62 (67.4%) |
| 5 Years | 13 (100.0%) | 60 (72.3%) |
| 6 to 11 Years | 100 (65.4%) | 94 (100.0%) |
| 12 to 14 Years | 46 (62.2%) | 47 (100.0%) |
| 15 Years | 0 (0.0%) | 42 (100.0%) |
| 16 and 17 Years | 118 (100.0%) | 0 (0.0%) |
| 18 to 24 Years | 57 (100.0%) | 174 (83.7%) |
| 25 to 34 Years | 190 (92.7%) | 179 (77.8%) |
| 35 to 44 Years | 141 (100.0%) | 146 (93.6%) |
| 45 to 54 Years | 110 (100.0%) | 163 (68.2%) |
| 55 to 64 Years | 294 (87.8%) | 204 (100.0%) |
| 65 to 74 Years | 72 (56.2%) | 119 (71.7%) |
| 75 Years and over | 12 (100.0%) | 29 (100.0%) |
| Total | 1,236 (86.5%) | 1,319 (83.0%) |
Income Below Poverty Among Married-Couple Families in Cedar Grove
The poverty statistics for married-couple families in Cedar Grove show that 10.0% or 56 of the total 561 families live below the poverty line. Families with no children have the highest poverty rate of 18.4%, comprising of 56 families. On the other hand, families with 1 or 2 children have the lowest poverty rate of 0.0%, which includes 0 families.
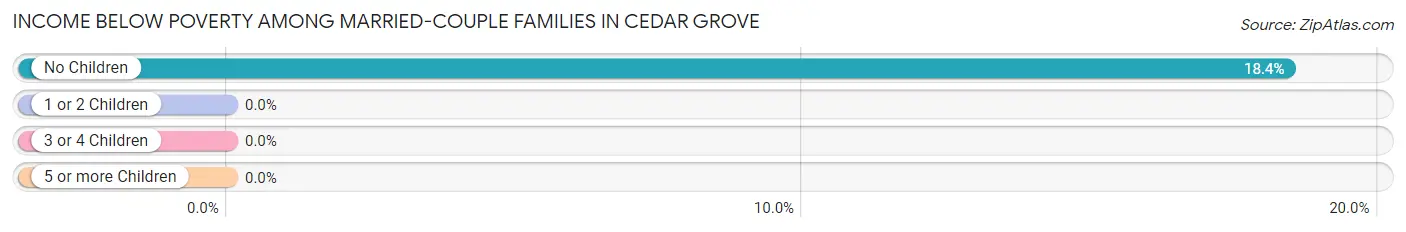
| Children | Above Poverty | Below Poverty |
| No Children | 248 (81.6%) | 56 (18.4%) |
| 1 or 2 Children | 192 (100.0%) | 0 (0.0%) |
| 3 or 4 Children | 65 (100.0%) | 0 (0.0%) |
| 5 or more Children | 0 (0.0%) | 0 (0.0%) |
| Total | 505 (90.0%) | 56 (10.0%) |
Income Below Poverty Among Single-Parent Households in Cedar Grove
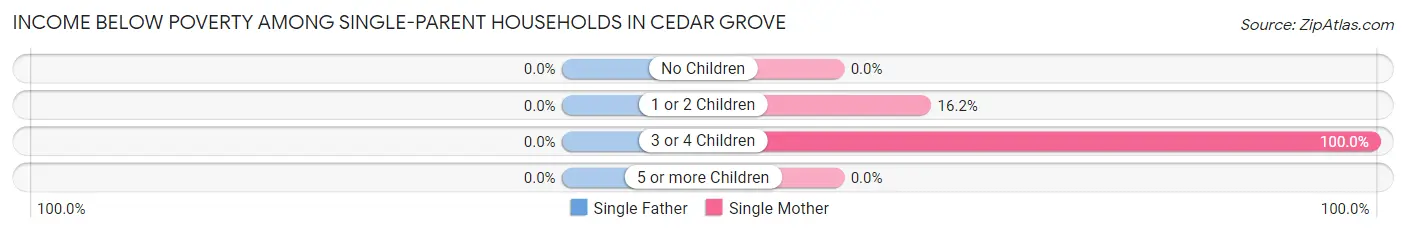
| Children | Single Father | Single Mother |
| No Children | 0 (0.0%) | 0 (0.0%) |
| 1 or 2 Children | 0 (0.0%) | 23 (16.2%) |
| 3 or 4 Children | 0 (0.0%) | 24 (100.0%) |
| 5 or more Children | 0 (0.0%) | 0 (0.0%) |
| Total | 0 (0.0%) | 47 (21.1%) |
Income Below Poverty Among Married-Couple vs Single-Parent Households in Cedar Grove
The poverty data for Cedar Grove shows that 56 of the married-couple family households (10.0%) and 47 of the single-parent households (17.8%) are living below the poverty level. Within the married-couple family households, those with no children have the highest poverty rate, with 56 households (18.4%) falling below the poverty line. Among the single-parent households, those with 3 or 4 children have the highest poverty rate, with 24 household (100.0%) living below poverty.
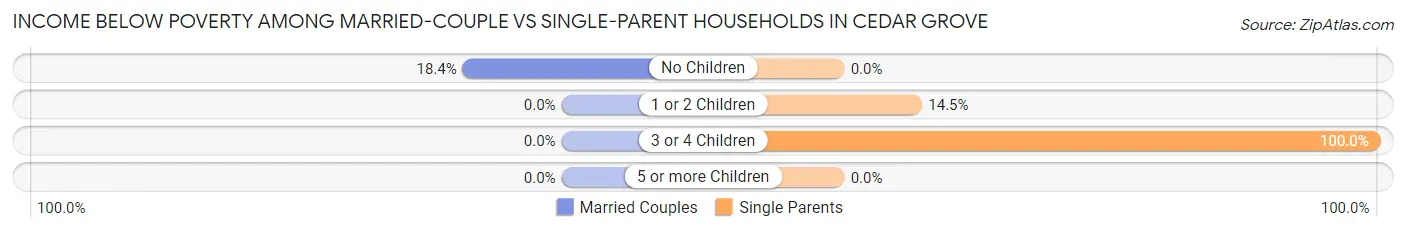
| Children | Married-Couple Families | Single-Parent Households |
| No Children | 56 (18.4%) | 0 (0.0%) |
| 1 or 2 Children | 0 (0.0%) | 23 (14.5%) |
| 3 or 4 Children | 0 (0.0%) | 24 (100.0%) |
| 5 or more Children | 0 (0.0%) | 0 (0.0%) |
| Total | 56 (10.0%) | 47 (17.8%) |
Race in Cedar Grove
The most populous races in Cedar Grove are White / Caucasian (1,818 | 60.2%), Black / African American (771 | 25.5%), and Two or more Races (285 | 9.4%).
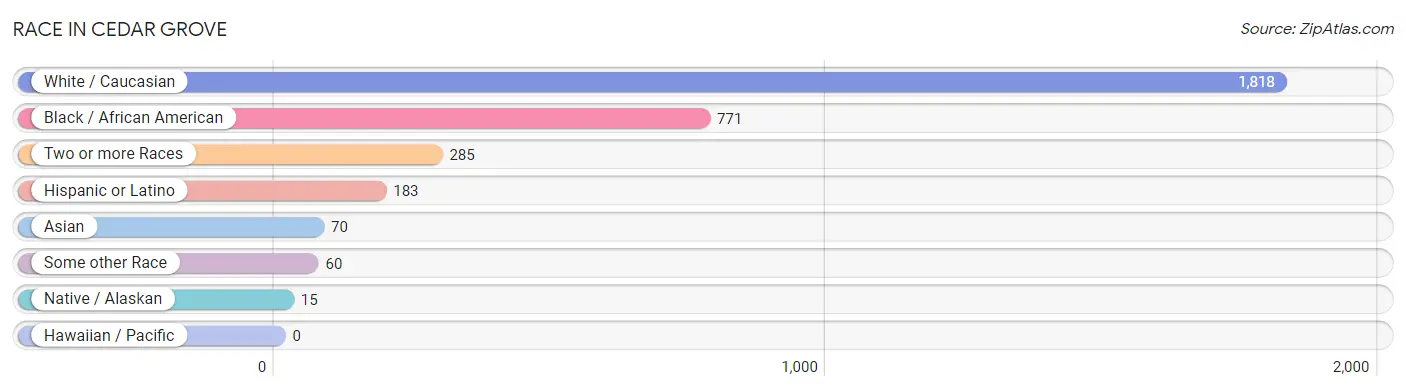
| Race | # Population | % Population |
| Asian | 70 | 2.3% |
| Black / African American | 771 | 25.5% |
| Hawaiian / Pacific | 0 | 0.0% |
| Hispanic or Latino | 183 | 6.1% |
| Native / Alaskan | 15 | 0.5% |
| White / Caucasian | 1,818 | 60.2% |
| Two or more Races | 285 | 9.4% |
| Some other Race | 60 | 2.0% |
| Total | 3,019 | 100.0% |
Ancestry in Cedar Grove
The most populous ancestries reported in Cedar Grove are German (401 | 13.3%), Irish (292 | 9.7%), American (113 | 3.7%), English (103 | 3.4%), and European (81 | 2.7%), together accounting for 32.8% of all Cedar Grove residents.
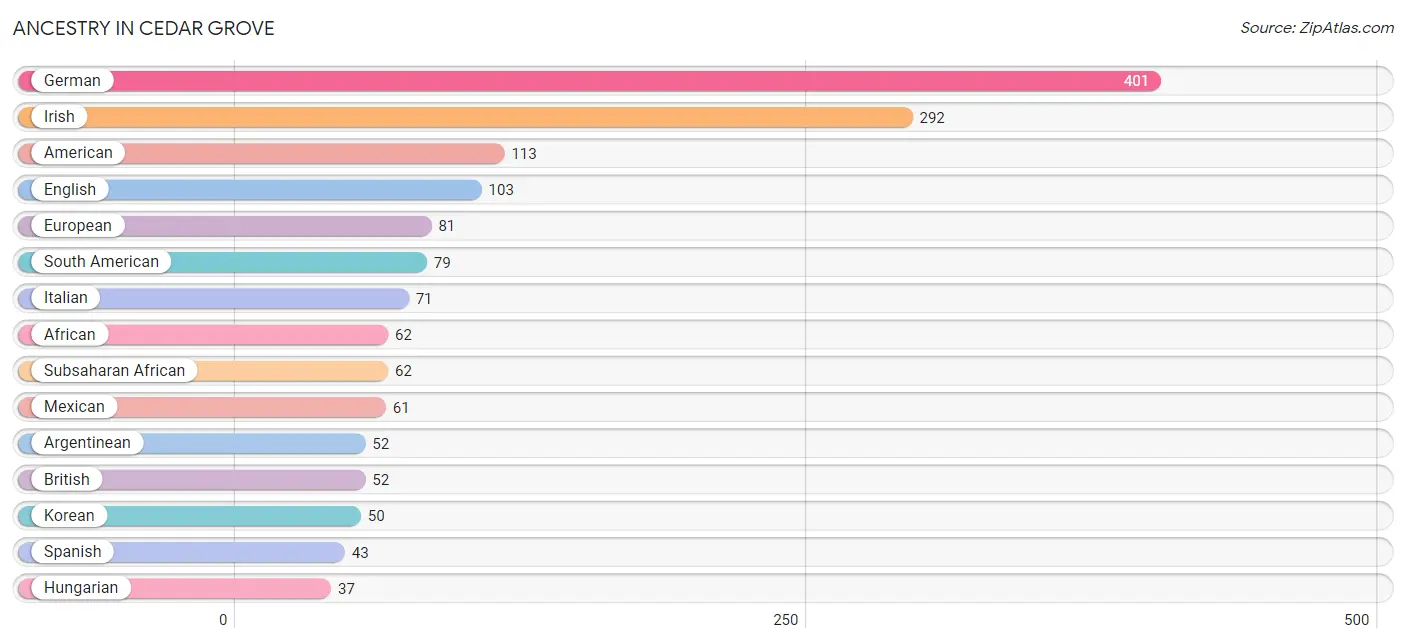
| Ancestry | # Population | % Population |
| African | 62 | 2.1% |
| American | 113 | 3.7% |
| Argentinean | 52 | 1.7% |
| Bhutanese | 16 | 0.5% |
| British | 52 | 1.7% |
| Canadian | 10 | 0.3% |
| Cherokee | 15 | 0.5% |
| Chilean | 11 | 0.4% |
| Colombian | 16 | 0.5% |
| Dutch | 7 | 0.2% |
| English | 103 | 3.4% |
| European | 81 | 2.7% |
| French | 19 | 0.6% |
| French Canadian | 20 | 0.7% |
| German | 401 | 13.3% |
| Hungarian | 37 | 1.2% |
| Irish | 292 | 9.7% |
| Italian | 71 | 2.4% |
| Korean | 50 | 1.7% |
| Latvian | 14 | 0.5% |
| Mexican | 61 | 2.0% |
| Norwegian | 8 | 0.3% |
| Pakistani | 27 | 0.9% |
| Polish | 13 | 0.4% |
| Scotch-Irish | 32 | 1.1% |
| Scottish | 8 | 0.3% |
| South American | 79 | 2.6% |
| Spanish | 43 | 1.4% |
| Sri Lankan | 34 | 1.1% |
| Subsaharan African | 62 | 2.1% |
| Swedish | 30 | 1.0% | View All 31 Rows |
Immigrants in Cedar Grove
The most numerous immigrant groups reported in Cedar Grove came from Latin America (152 | 5.0%), Asia (63 | 2.1%), Central America (61 | 2.0%), Panama (54 | 1.8%), and South Eastern Asia (54 | 1.8%), together accounting for 12.7% of all Cedar Grove residents.
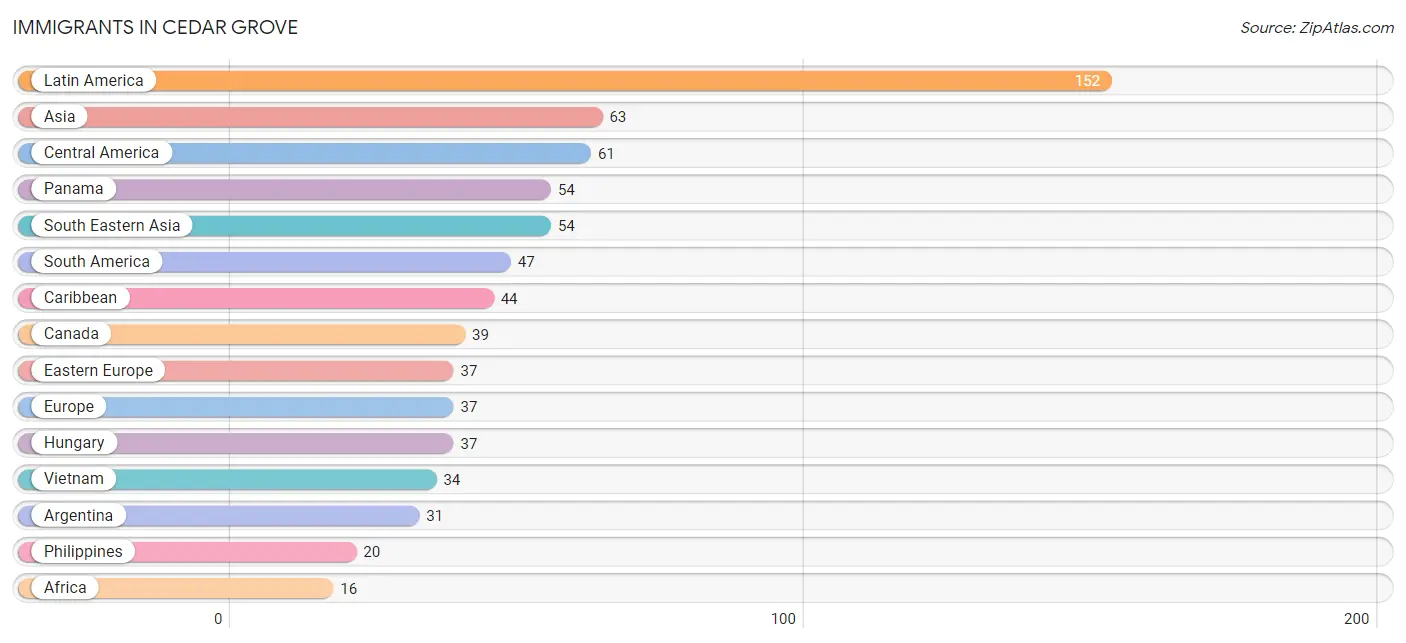
| Immigration Origin | # Population | % Population |
| Africa | 16 | 0.5% |
| Argentina | 31 | 1.0% |
| Asia | 63 | 2.1% |
| Canada | 39 | 1.3% |
| Caribbean | 44 | 1.5% |
| Central America | 61 | 2.0% |
| Colombia | 16 | 0.5% |
| Eastern Africa | 16 | 0.5% |
| Eastern Asia | 9 | 0.3% |
| Eastern Europe | 37 | 1.2% |
| Europe | 37 | 1.2% |
| Hungary | 37 | 1.2% |
| Japan | 9 | 0.3% |
| Latin America | 152 | 5.0% |
| Mexico | 7 | 0.2% |
| Panama | 54 | 1.8% |
| Philippines | 20 | 0.7% |
| South America | 47 | 1.6% |
| South Eastern Asia | 54 | 1.8% |
| Vietnam | 34 | 1.1% | View All 20 Rows |
Sex and Age in Cedar Grove
Sex and Age in Cedar Grove
The most populous age groups in Cedar Grove are 55 to 59 Years (318 | 22.3%) for men and 55 to 59 Years (178 | 11.2%) for women.
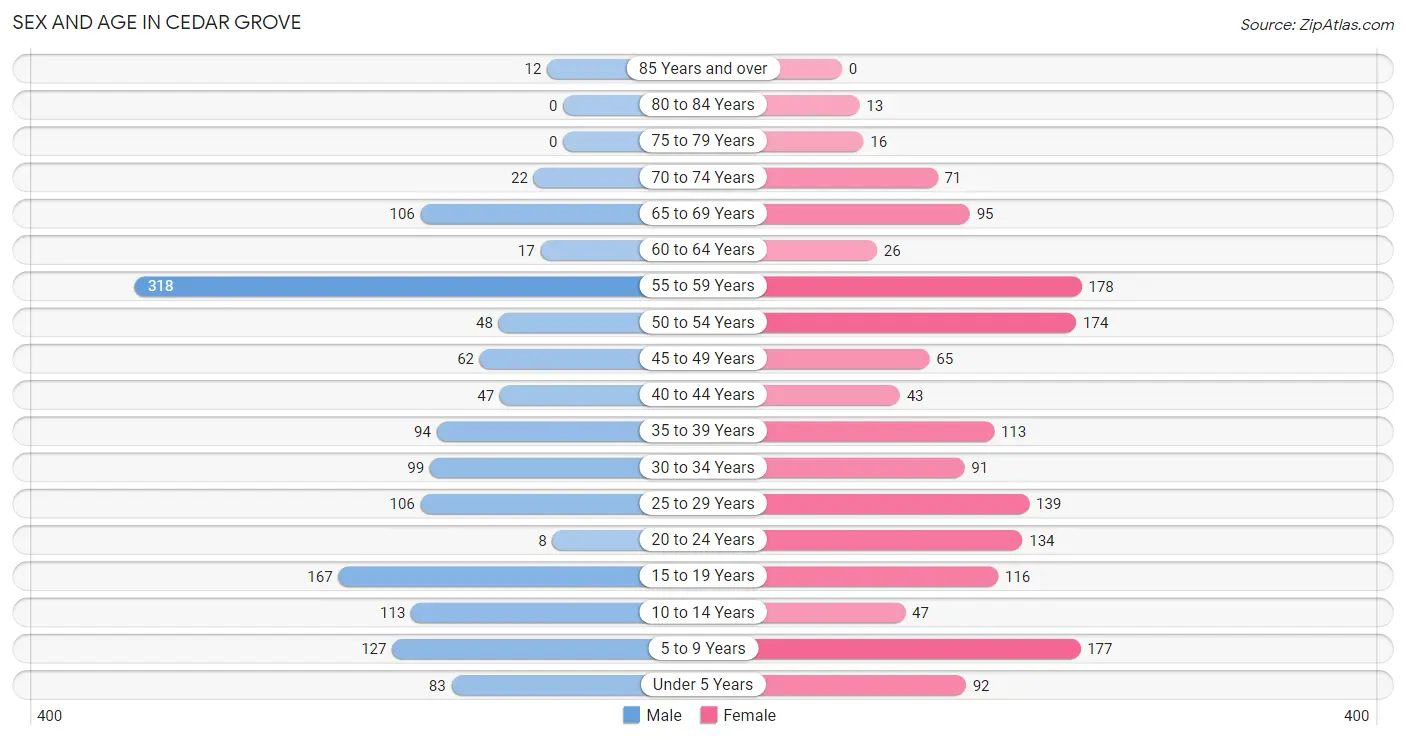
| Age Bracket | Male | Female |
| Under 5 Years | 83 (5.8%) | 92 (5.8%) |
| 5 to 9 Years | 127 (8.9%) | 177 (11.1%) |
| 10 to 14 Years | 113 (7.9%) | 47 (3.0%) |
| 15 to 19 Years | 167 (11.7%) | 116 (7.3%) |
| 20 to 24 Years | 8 (0.6%) | 134 (8.4%) |
| 25 to 29 Years | 106 (7.4%) | 139 (8.7%) |
| 30 to 34 Years | 99 (6.9%) | 91 (5.7%) |
| 35 to 39 Years | 94 (6.6%) | 113 (7.1%) |
| 40 to 44 Years | 47 (3.3%) | 43 (2.7%) |
| 45 to 49 Years | 62 (4.3%) | 65 (4.1%) |
| 50 to 54 Years | 48 (3.4%) | 174 (10.9%) |
| 55 to 59 Years | 318 (22.3%) | 178 (11.2%) |
| 60 to 64 Years | 17 (1.2%) | 26 (1.6%) |
| 65 to 69 Years | 106 (7.4%) | 95 (6.0%) |
| 70 to 74 Years | 22 (1.5%) | 71 (4.5%) |
| 75 to 79 Years | 0 (0.0%) | 16 (1.0%) |
| 80 to 84 Years | 0 (0.0%) | 13 (0.8%) |
| 85 Years and over | 12 (0.8%) | 0 (0.0%) |
| Total | 1,429 (100.0%) | 1,590 (100.0%) |
Families and Households in Cedar Grove
Median Family Size in Cedar Grove
The median family size in Cedar Grove is 3.06 persons per family, with married-couple families (561 | 68.0%) accounting for the largest median family size of 3.21 persons per family. On the other hand, single male/father families (41 | 5.0%) represent the smallest median family size with 2.46 persons per family.
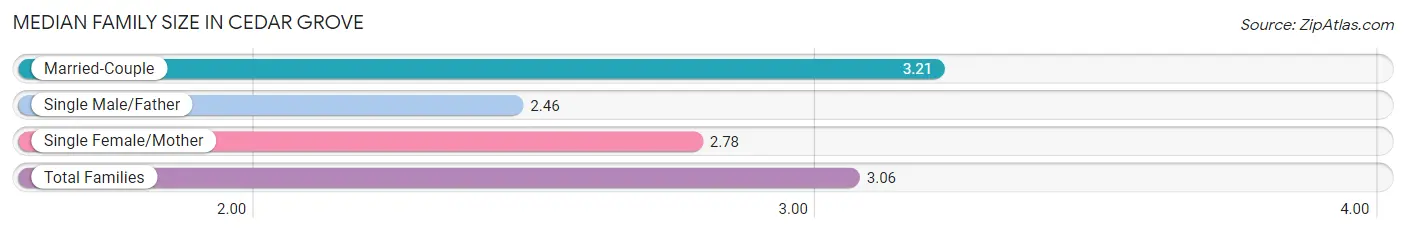
| Family Type | # Families | Family Size |
| Married-Couple | 561 (68.0%) | 3.21 |
| Single Male/Father | 41 (5.0%) | 2.46 |
| Single Female/Mother | 223 (27.0%) | 2.78 |
| Total Families | 825 (100.0%) | 3.06 |
Median Household Size in Cedar Grove
The median household size in Cedar Grove is 2.56 persons per household, with single male/father households (41 | 3.5%) accounting for the largest median household size of 3.44 persons per household. non-family households (355 | 30.1%) represent the smallest median household size with 1.19 persons per household.
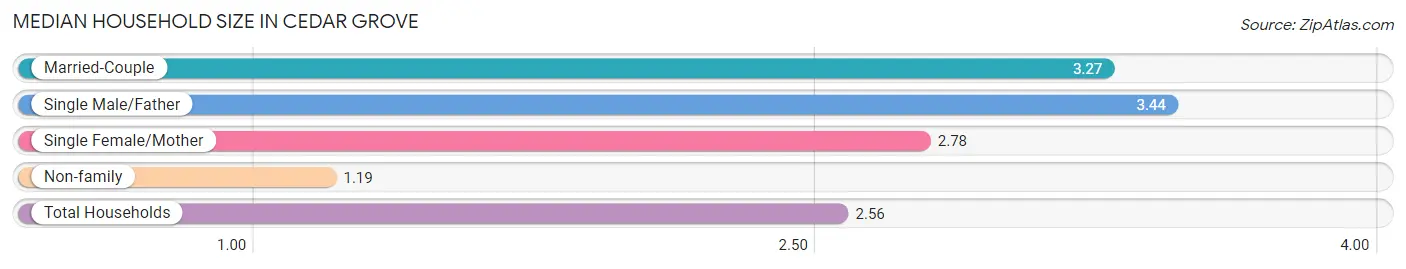
| Household Type | # Households | Household Size |
| Married-Couple | 561 (47.5%) | 3.27 |
| Single Male/Father | 41 (3.5%) | 3.44 |
| Single Female/Mother | 223 (18.9%) | 2.78 |
| Non-family | 355 (30.1%) | 1.19 |
| Total Households | 1,180 (100.0%) | 2.56 |
Household Size by Marriage Status in Cedar Grove
Out of a total of 1,180 households in Cedar Grove, 825 (69.9%) are family households, while 355 (30.1%) are nonfamily households. The most numerous type of family households are 2-person households, comprising 400, and the most common type of nonfamily households are 1-person households, comprising 274.
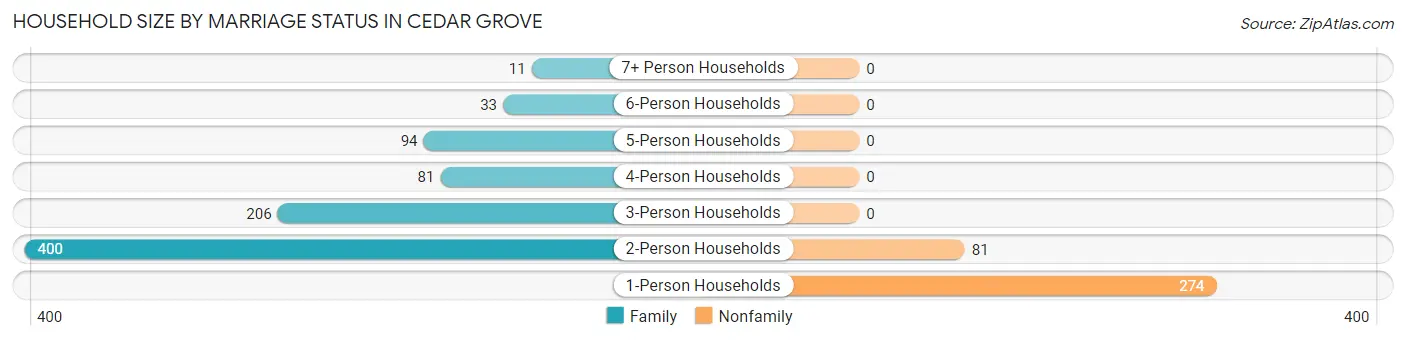
| Household Size | Family Households | Nonfamily Households |
| 1-Person Households | - | 274 (23.2%) |
| 2-Person Households | 400 (33.9%) | 81 (6.9%) |
| 3-Person Households | 206 (17.5%) | 0 (0.0%) |
| 4-Person Households | 81 (6.9%) | 0 (0.0%) |
| 5-Person Households | 94 (8.0%) | 0 (0.0%) |
| 6-Person Households | 33 (2.8%) | 0 (0.0%) |
| 7+ Person Households | 11 (0.9%) | 0 (0.0%) |
| Total | 825 (69.9%) | 355 (30.1%) |
Female Fertility in Cedar Grove
Fertility by Age in Cedar Grove
Average fertility rate in Cedar Grove is 37.0 births per 1,000 women. Women in the age bracket of 20 to 34 years have the highest fertility rate with 82.0 births per 1,000 women. Women in the age bracket of 20 to 34 years acount for 100.0% of all women with births.
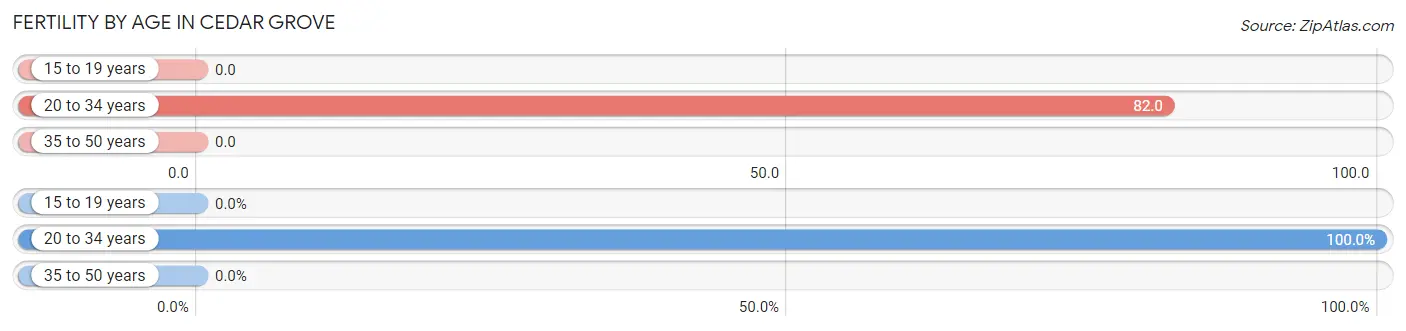
| Age Bracket | Women with Births | Births / 1,000 Women |
| 15 to 19 years | 0 (0.0%) | 0.0 |
| 20 to 34 years | 30 (100.0%) | 82.0 |
| 35 to 50 years | 0 (0.0%) | 0.0 |
| Total | 30 (100.0%) | 37.0 |
Fertility by Age by Marriage Status in Cedar Grove
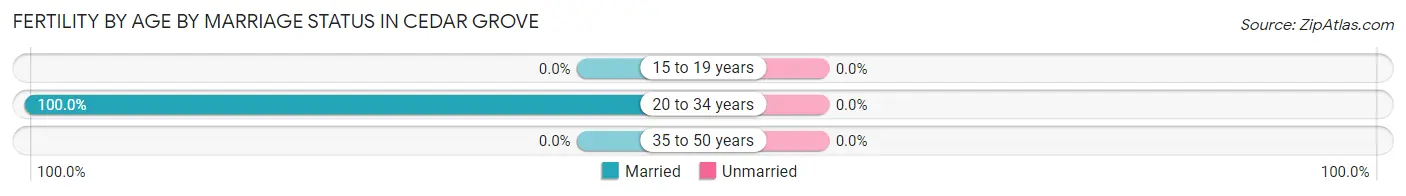
| Age Bracket | Married | Unmarried |
| 15 to 19 years | 0 (0.0%) | 0 (0.0%) |
| 20 to 34 years | 30 (100.0%) | 0 (0.0%) |
| 35 to 50 years | 0 (0.0%) | 0 (0.0%) |
| Total | 30 (100.0%) | 0 (0.0%) |
Fertility by Education in Cedar Grove
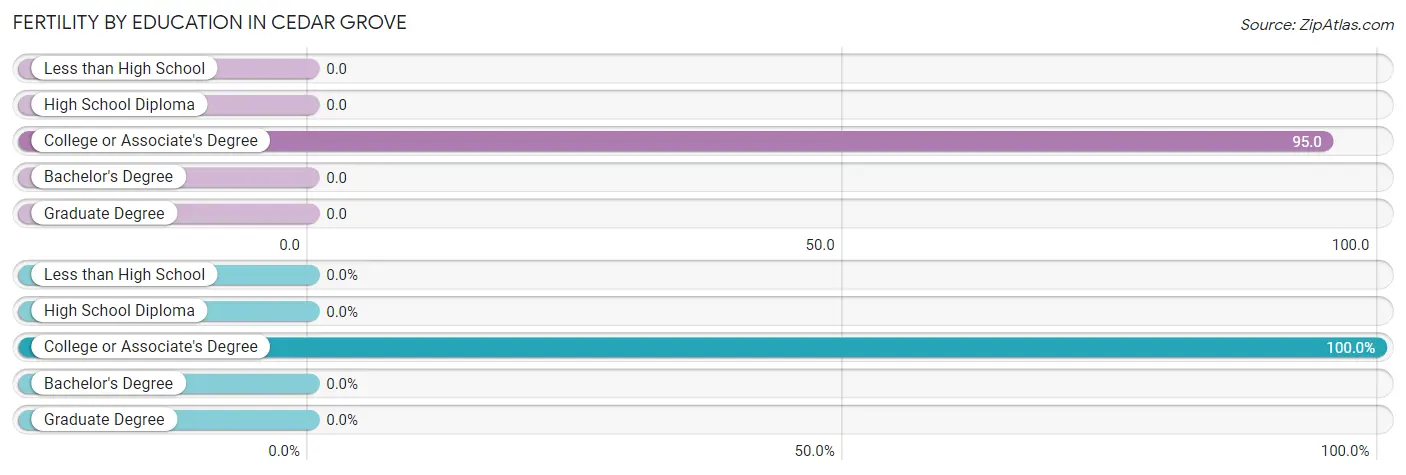
| Educational Attainment | Women with Births | Births / 1,000 Women |
| Less than High School | 0 (0.0%) | 0.0 |
| High School Diploma | 0 (0.0%) | 0.0 |
| College or Associate's Degree | 30 (100.0%) | 95.0 |
| Bachelor's Degree | 0 (0.0%) | 0.0 |
| Graduate Degree | 0 (0.0%) | 0.0 |
| Total | 30 (100.0%) | 37.0 |
Fertility by Education by Marriage Status in Cedar Grove
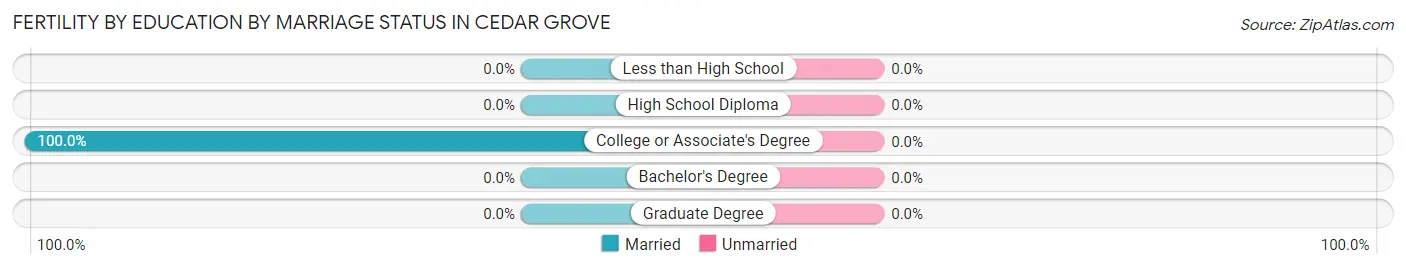
| Educational Attainment | Married | Unmarried |
| Less than High School | 0 (0.0%) | 0 (0.0%) |
| High School Diploma | 0 (0.0%) | 0 (0.0%) |
| College or Associate's Degree | 30 (100.0%) | 0 (0.0%) |
| Bachelor's Degree | 0 (0.0%) | 0 (0.0%) |
| Graduate Degree | 0 (0.0%) | 0 (0.0%) |
| Total | 30 (100.0%) | 0 (0.0%) |
Employment Characteristics in Cedar Grove
Employment by Class of Employer in Cedar Grove
Among the 1,324 employed individuals in Cedar Grove, private company employees (815 | 61.6%), federal government employees (153 | 11.6%), and self-employed (incorporated) (96 | 7.2%) make up the most common classes of employment.
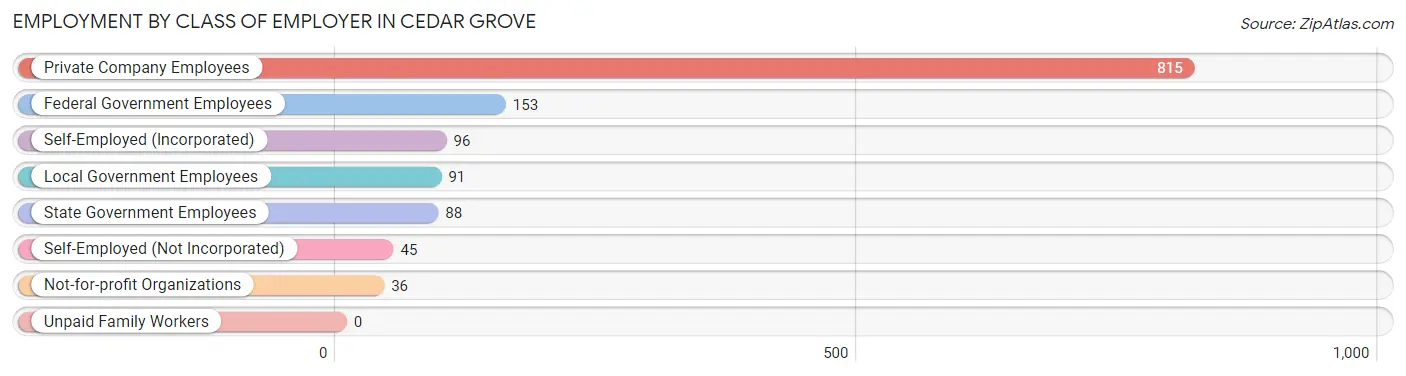
| Employer Class | # Employees | % Employees |
| Private Company Employees | 815 | 61.6% |
| Self-Employed (Incorporated) | 96 | 7.2% |
| Self-Employed (Not Incorporated) | 45 | 3.4% |
| Not-for-profit Organizations | 36 | 2.7% |
| Local Government Employees | 91 | 6.9% |
| State Government Employees | 88 | 6.7% |
| Federal Government Employees | 153 | 11.6% |
| Unpaid Family Workers | 0 | 0.0% |
| Total | 1,324 | 100.0% |
Employment Status by Age in Cedar Grove
According to the labor force statistics for Cedar Grove, out of the total population over 16 years of age (2,338), 60.4% or 1,412 individuals are in the labor force, with 2.8% or 40 of them unemployed. The age group with the highest labor force participation rate is 60 to 64 years, with 100.0% or 43 individuals in the labor force. Within the labor force, the 20 to 24 years age range has the highest percentage of unemployed individuals, with 28.7% or 27 of them being unemployed.
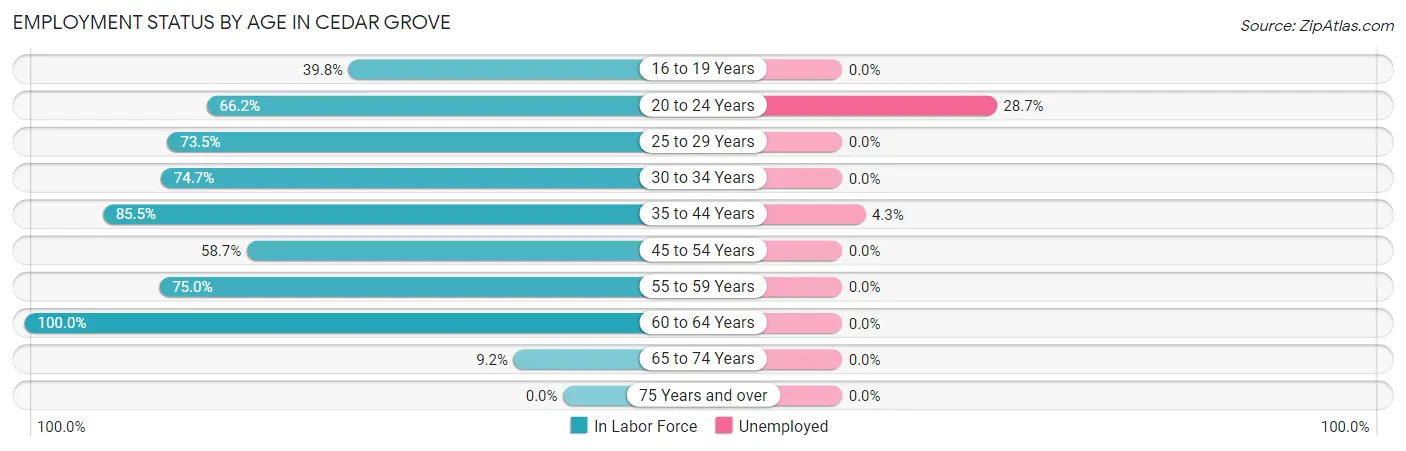
| Age Bracket | In Labor Force | Unemployed |
| 16 to 19 Years | 96 (39.8%) | 0 (0.0%) |
| 20 to 24 Years | 94 (66.2%) | 27 (28.7%) |
| 25 to 29 Years | 180 (73.5%) | 0 (0.0%) |
| 30 to 34 Years | 142 (74.7%) | 0 (0.0%) |
| 35 to 44 Years | 254 (85.5%) | 11 (4.3%) |
| 45 to 54 Years | 205 (58.7%) | 0 (0.0%) |
| 55 to 59 Years | 372 (75.0%) | 0 (0.0%) |
| 60 to 64 Years | 43 (100.0%) | 0 (0.0%) |
| 65 to 74 Years | 27 (9.2%) | 0 (0.0%) |
| 75 Years and over | 0 (0.0%) | 0 (0.0%) |
| Total | 1,412 (60.4%) | 40 (2.8%) |
Employment Status by Educational Attainment in Cedar Grove
According to labor force statistics for Cedar Grove, 73.8% of individuals (1,196) out of the total population between 25 and 64 years of age (1,620) are in the labor force, with 1.0% or 12 of them being unemployed. The group with the highest labor force participation rate are those with the educational attainment of college / associate degree, with 91.2% or 447 individuals in the labor force. Within the labor force, individuals with less than high school education have the highest percentage of unemployment, with 11.7% or 11 of them being unemployed.
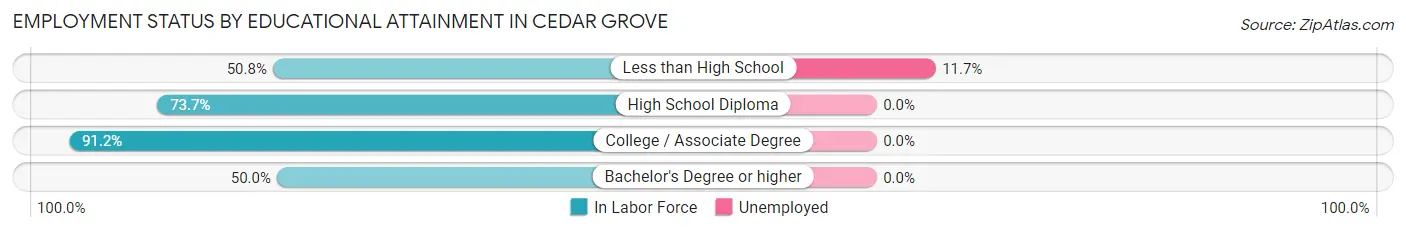
| Educational Attainment | In Labor Force | Unemployed |
| Less than High School | 94 (50.8%) | 22 (11.7%) |
| High School Diploma | 567 (73.7%) | 0 (0.0%) |
| College / Associate Degree | 447 (91.2%) | 0 (0.0%) |
| Bachelor's Degree or higher | 88 (50.0%) | 0 (0.0%) |
| Total | 1,196 (73.8%) | 16 (1.0%) |
Employment Occupations by Sex in Cedar Grove
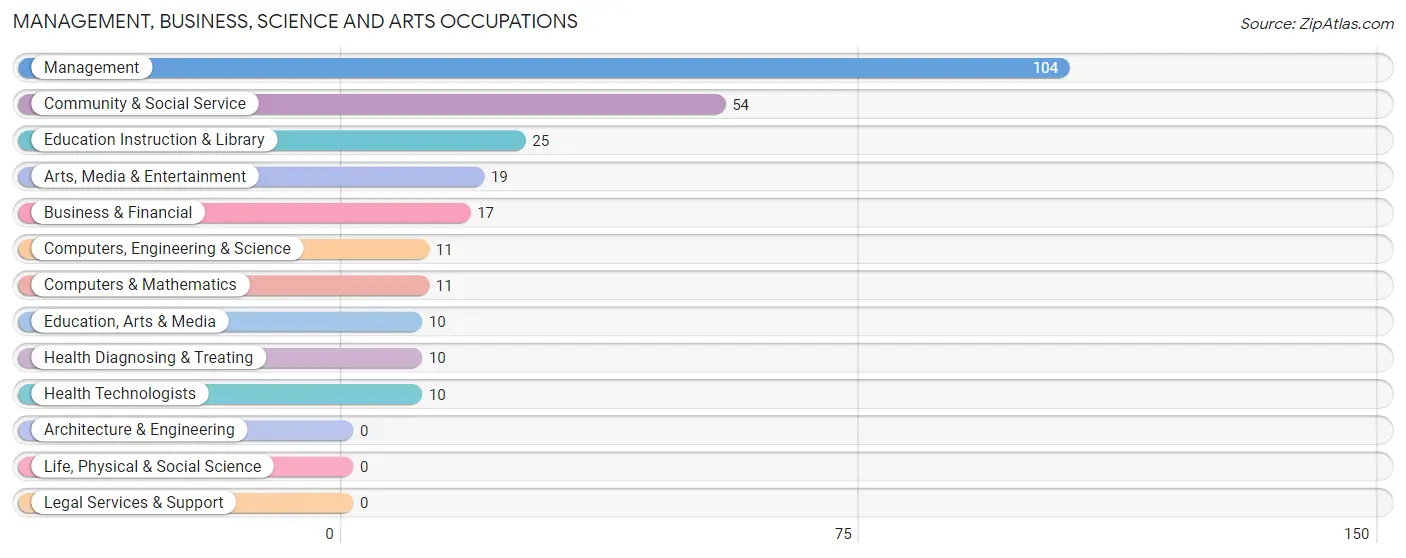
Management, Business, Science and Arts Occupations
The most common Management, Business, Science and Arts occupations in Cedar Grove are Management (104 | 8.0%), Community & Social Service (54 | 4.2%), Education Instruction & Library (25 | 1.9%), Arts, Media & Entertainment (19 | 1.5%), and Business & Financial (17 | 1.3%).
Management, Business, Science and Arts Occupations by Sex
Within the Management, Business, Science and Arts occupations in Cedar Grove, the most male-oriented occupations are Computers, Engineering & Science (100.0%), Computers & Mathematics (100.0%), and Arts, Media & Entertainment (100.0%), while the most female-oriented occupations are Business & Financial (100.0%), Education, Arts & Media (100.0%), and Education Instruction & Library (100.0%).
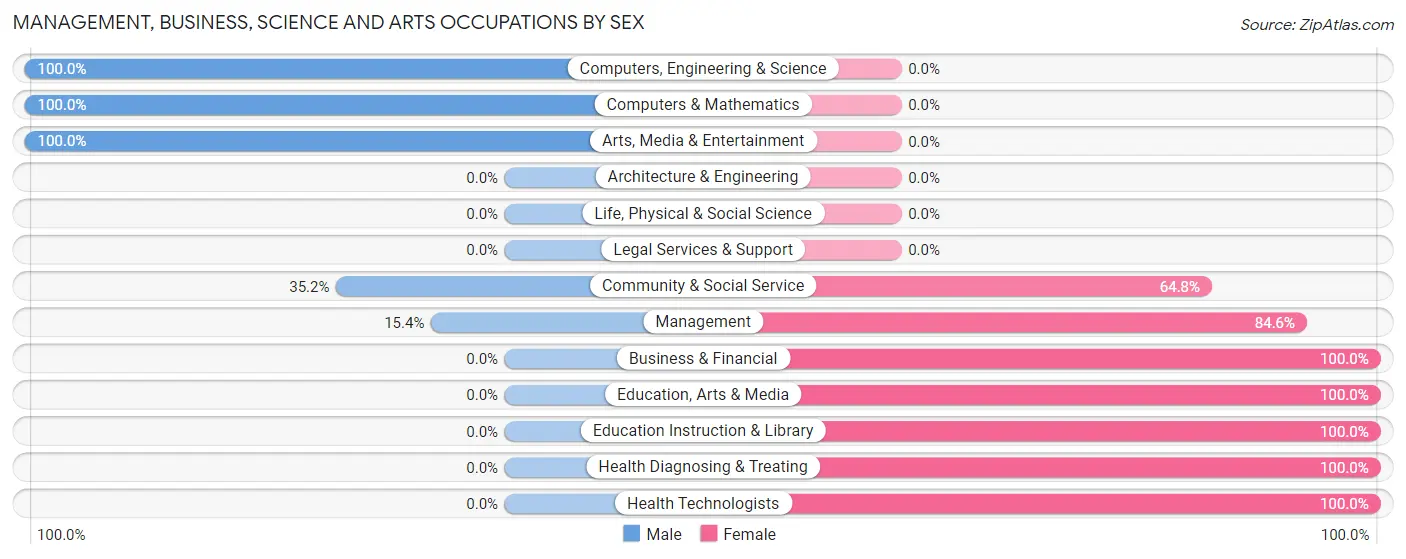
| Occupation | Male | Female |
| Management | 16 (15.4%) | 88 (84.6%) |
| Business & Financial | 0 (0.0%) | 17 (100.0%) |
| Computers, Engineering & Science | 11 (100.0%) | 0 (0.0%) |
| Computers & Mathematics | 11 (100.0%) | 0 (0.0%) |
| Architecture & Engineering | 0 (0.0%) | 0 (0.0%) |
| Life, Physical & Social Science | 0 (0.0%) | 0 (0.0%) |
| Community & Social Service | 19 (35.2%) | 35 (64.8%) |
| Education, Arts & Media | 0 (0.0%) | 10 (100.0%) |
| Legal Services & Support | 0 (0.0%) | 0 (0.0%) |
| Education Instruction & Library | 0 (0.0%) | 25 (100.0%) |
| Arts, Media & Entertainment | 19 (100.0%) | 0 (0.0%) |
| Health Diagnosing & Treating | 0 (0.0%) | 10 (100.0%) |
| Health Technologists | 0 (0.0%) | 10 (100.0%) |
| Total (Category) | 46 (23.5%) | 150 (76.5%) |
| Total (Overall) | 663 (51.2%) | 633 (48.8%) |
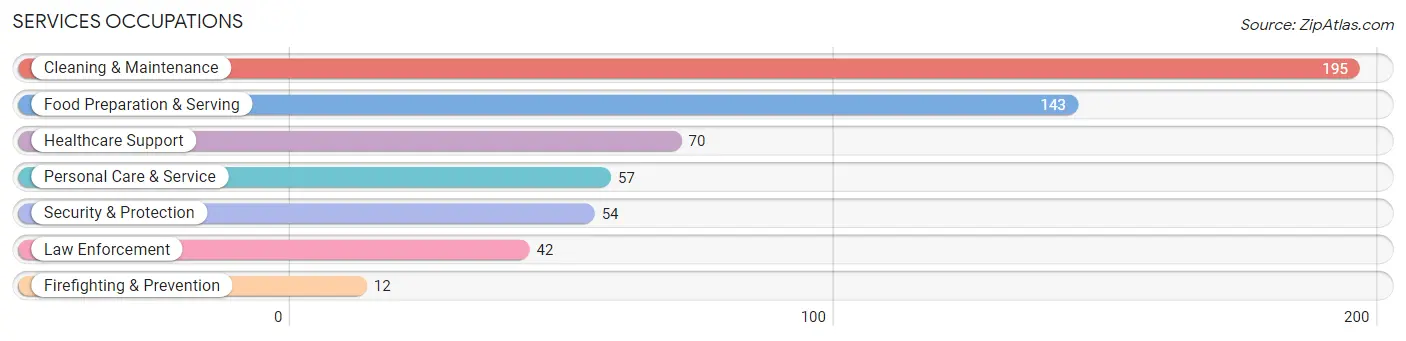
Services Occupations
The most common Services occupations in Cedar Grove are Cleaning & Maintenance (195 | 15.0%), Food Preparation & Serving (143 | 11.0%), Healthcare Support (70 | 5.4%), Personal Care & Service (57 | 4.4%), and Security & Protection (54 | 4.2%).
Services Occupations by Sex
Within the Services occupations in Cedar Grove, the most male-oriented occupations are Law Enforcement (100.0%), Security & Protection (77.8%), and Cleaning & Maintenance (60.5%), while the most female-oriented occupations are Healthcare Support (100.0%), Firefighting & Prevention (100.0%), and Food Preparation & Serving (55.9%).
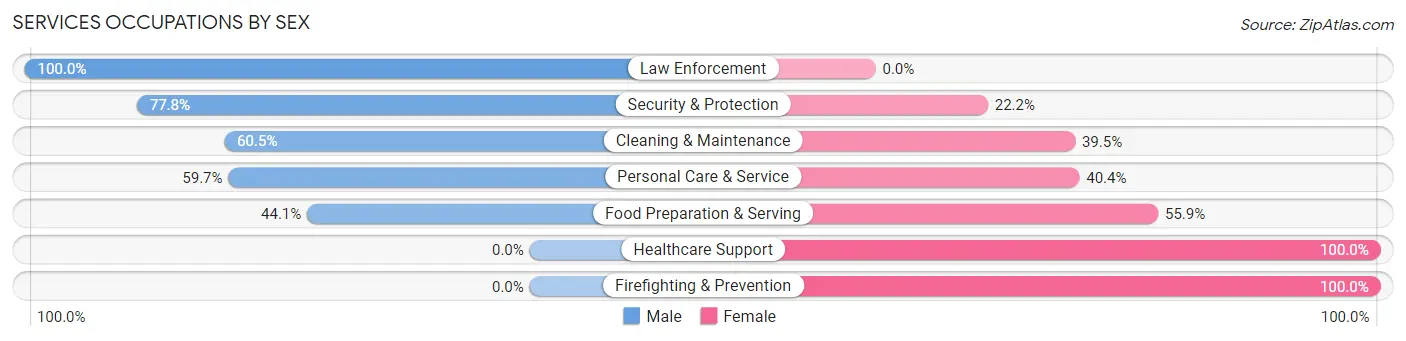
| Occupation | Male | Female |
| Healthcare Support | 0 (0.0%) | 70 (100.0%) |
| Security & Protection | 42 (77.8%) | 12 (22.2%) |
| Firefighting & Prevention | 0 (0.0%) | 12 (100.0%) |
| Law Enforcement | 42 (100.0%) | 0 (0.0%) |
| Food Preparation & Serving | 63 (44.1%) | 80 (55.9%) |
| Cleaning & Maintenance | 118 (60.5%) | 77 (39.5%) |
| Personal Care & Service | 34 (59.7%) | 23 (40.4%) |
| Total (Category) | 257 (49.5%) | 262 (50.5%) |
| Total (Overall) | 663 (51.2%) | 633 (48.8%) |
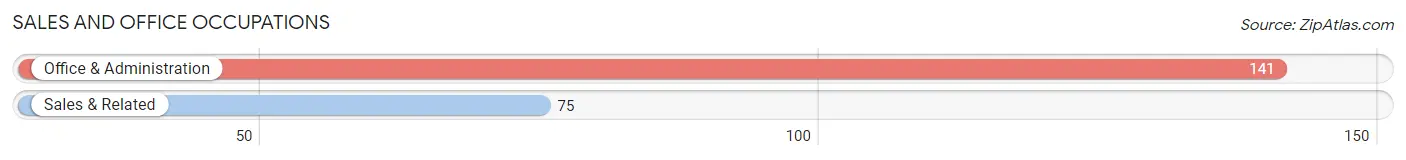
Sales and Office Occupations
The most common Sales and Office occupations in Cedar Grove are Office & Administration (141 | 10.9%), and Sales & Related (75 | 5.8%).
Sales and Office Occupations by Sex
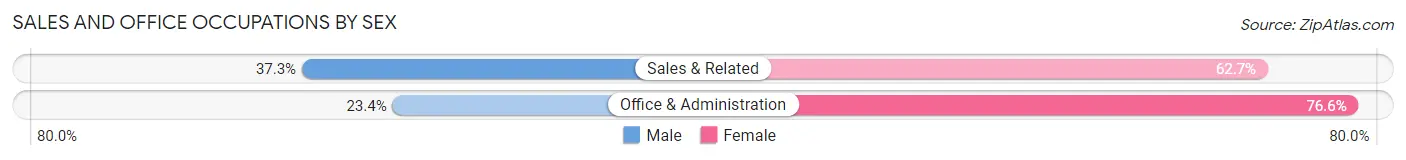
| Occupation | Male | Female |
| Sales & Related | 28 (37.3%) | 47 (62.7%) |
| Office & Administration | 33 (23.4%) | 108 (76.6%) |
| Total (Category) | 61 (28.2%) | 155 (71.8%) |
| Total (Overall) | 663 (51.2%) | 633 (48.8%) |
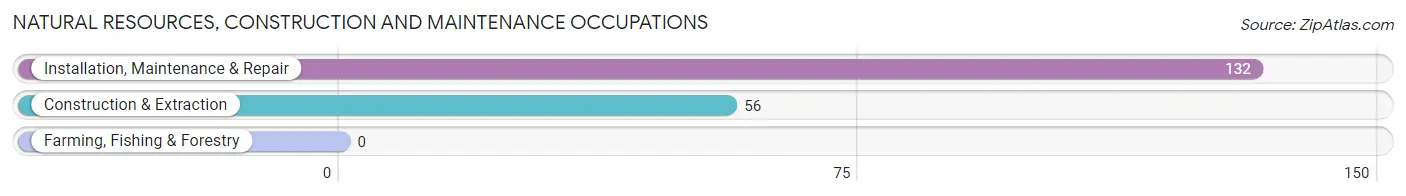
Natural Resources, Construction and Maintenance Occupations
The most common Natural Resources, Construction and Maintenance occupations in Cedar Grove are Installation, Maintenance & Repair (132 | 10.2%), and Construction & Extraction (56 | 4.3%).
Natural Resources, Construction and Maintenance Occupations by Sex
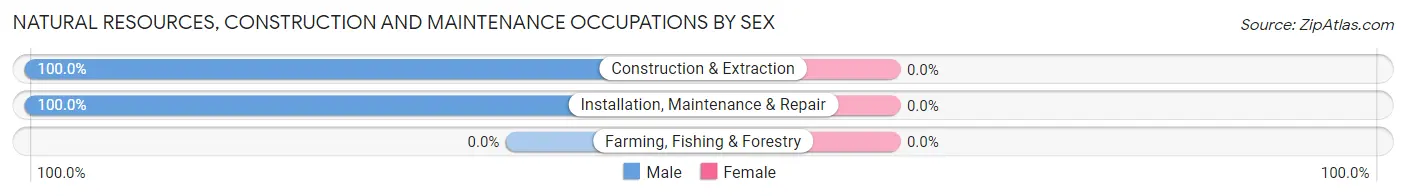
| Occupation | Male | Female |
| Farming, Fishing & Forestry | 0 (0.0%) | 0 (0.0%) |
| Construction & Extraction | 56 (100.0%) | 0 (0.0%) |
| Installation, Maintenance & Repair | 132 (100.0%) | 0 (0.0%) |
| Total (Category) | 188 (100.0%) | 0 (0.0%) |
| Total (Overall) | 663 (51.2%) | 633 (48.8%) |
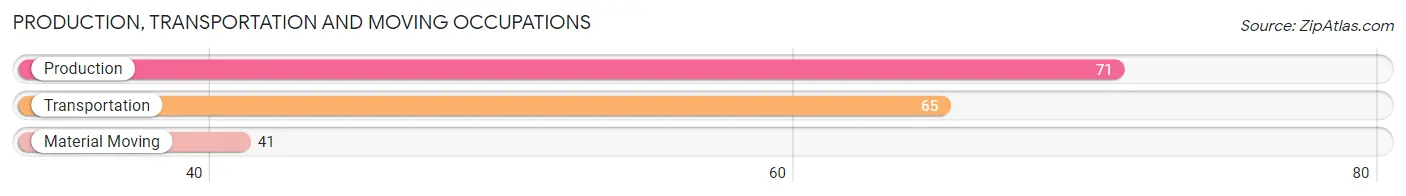
Production, Transportation and Moving Occupations
The most common Production, Transportation and Moving occupations in Cedar Grove are Production (71 | 5.5%), Transportation (65 | 5.0%), and Material Moving (41 | 3.2%).
Production, Transportation and Moving Occupations by Sex
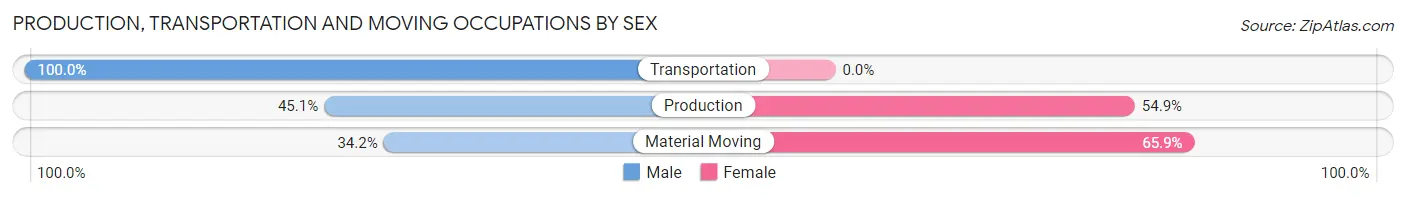
| Occupation | Male | Female |
| Production | 32 (45.1%) | 39 (54.9%) |
| Transportation | 65 (100.0%) | 0 (0.0%) |
| Material Moving | 14 (34.2%) | 27 (65.8%) |
| Total (Category) | 111 (62.7%) | 66 (37.3%) |
| Total (Overall) | 663 (51.2%) | 633 (48.8%) |
Employment Industries by Sex in Cedar Grove
Employment Industries in Cedar Grove
The major employment industries in Cedar Grove include Accommodation & Food Services (197 | 15.2%), Health Care & Social Assistance (157 | 12.1%), Administrative & Support (152 | 11.7%), Construction (137 | 10.6%), and Retail Trade (127 | 9.8%).
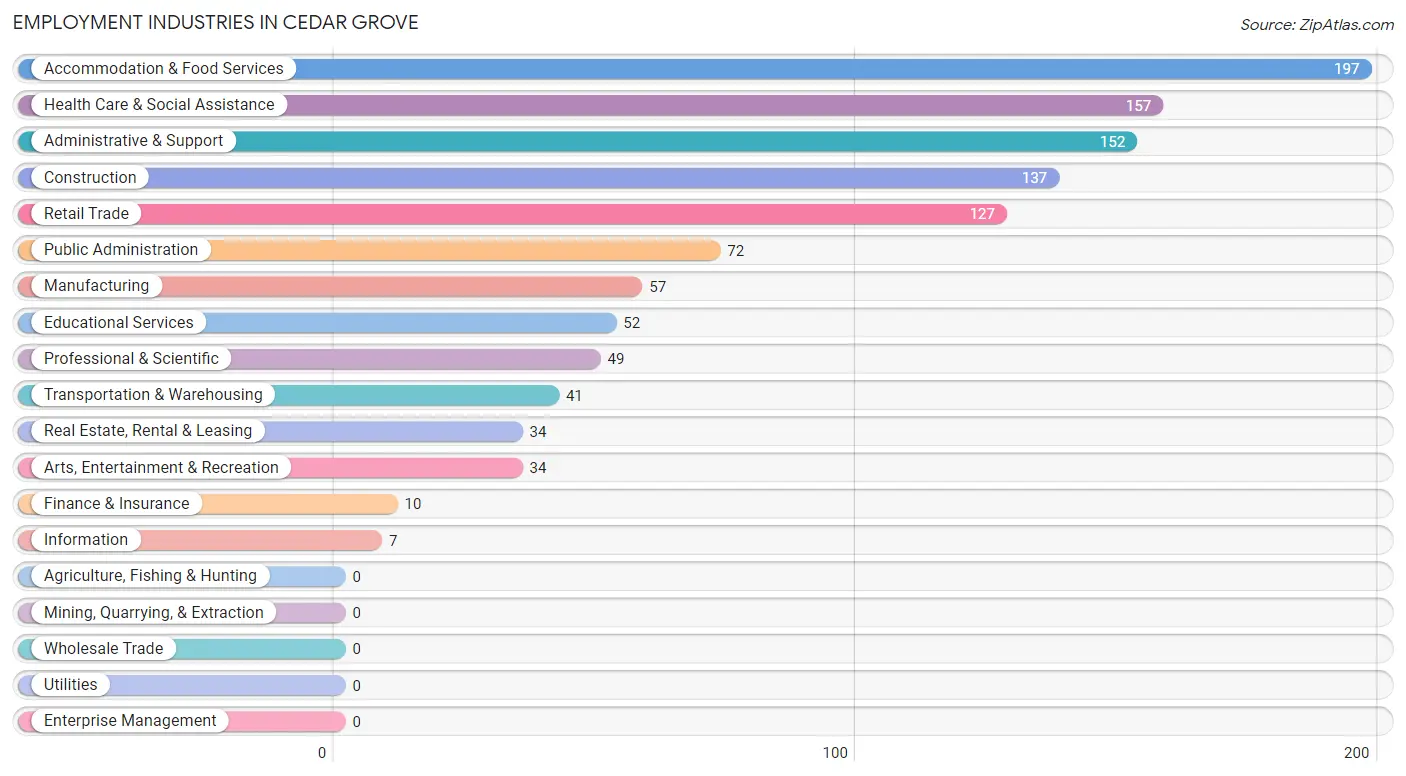
Employment Industries by Sex in Cedar Grove
The Cedar Grove industries that see more men than women are Information (100.0%), Finance & Insurance (100.0%), and Arts, Entertainment & Recreation (100.0%), whereas the industries that tend to have a higher number of women are Real Estate, Rental & Leasing (100.0%), Health Care & Social Assistance (92.4%), and Accommodation & Food Services (68.0%).
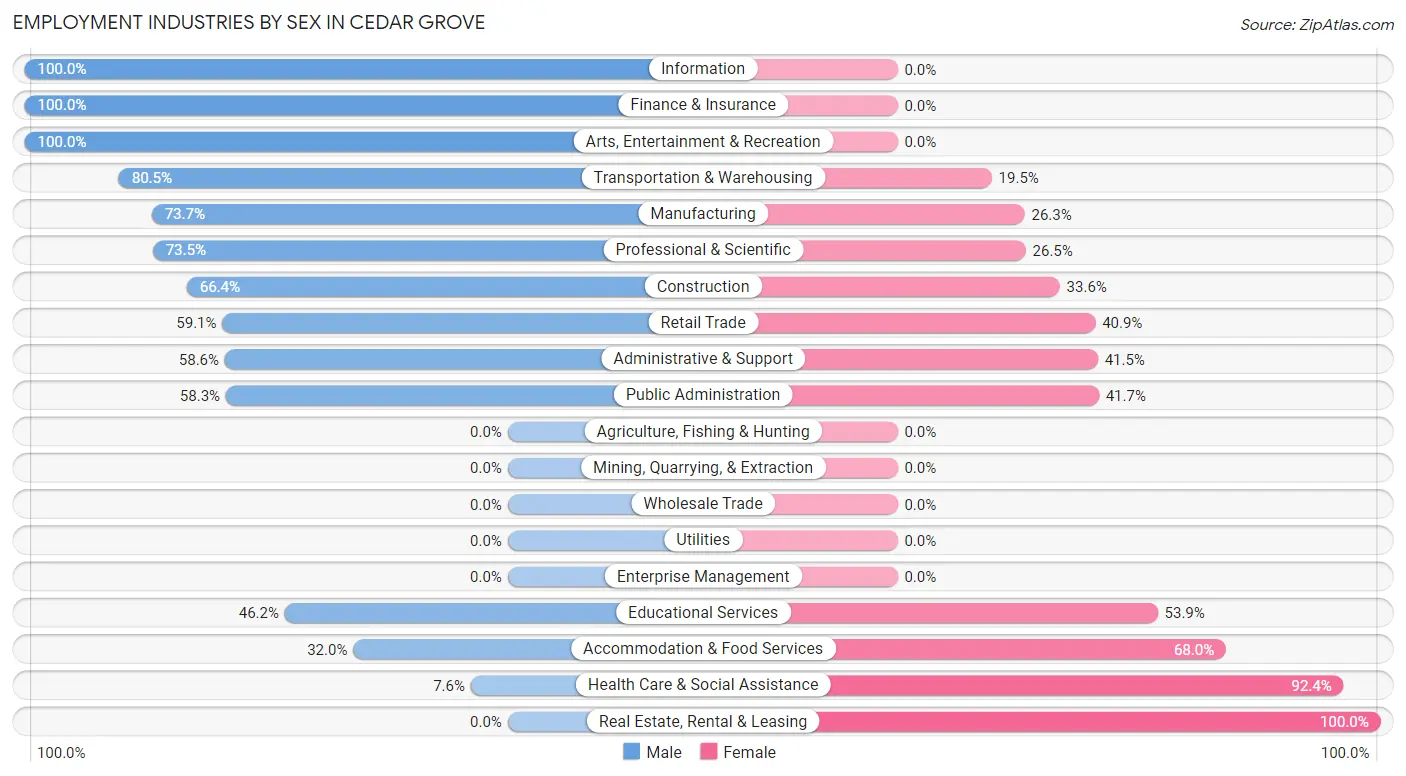
| Industry | Male | Female |
| Agriculture, Fishing & Hunting | 0 (0.0%) | 0 (0.0%) |
| Mining, Quarrying, & Extraction | 0 (0.0%) | 0 (0.0%) |
| Construction | 91 (66.4%) | 46 (33.6%) |
| Manufacturing | 42 (73.7%) | 15 (26.3%) |
| Wholesale Trade | 0 (0.0%) | 0 (0.0%) |
| Retail Trade | 75 (59.1%) | 52 (40.9%) |
| Transportation & Warehousing | 33 (80.5%) | 8 (19.5%) |
| Utilities | 0 (0.0%) | 0 (0.0%) |
| Information | 7 (100.0%) | 0 (0.0%) |
| Finance & Insurance | 10 (100.0%) | 0 (0.0%) |
| Real Estate, Rental & Leasing | 0 (0.0%) | 34 (100.0%) |
| Professional & Scientific | 36 (73.5%) | 13 (26.5%) |
| Enterprise Management | 0 (0.0%) | 0 (0.0%) |
| Administrative & Support | 89 (58.6%) | 63 (41.4%) |
| Educational Services | 24 (46.2%) | 28 (53.8%) |
| Health Care & Social Assistance | 12 (7.6%) | 145 (92.4%) |
| Arts, Entertainment & Recreation | 34 (100.0%) | 0 (0.0%) |
| Accommodation & Food Services | 63 (32.0%) | 134 (68.0%) |
| Public Administration | 42 (58.3%) | 30 (41.7%) |
| Total | 663 (51.2%) | 633 (48.8%) |
Education in Cedar Grove
School Enrollment in Cedar Grove
The most common levels of schooling among the 731 students in Cedar Grove are high school (267 | 36.5%), elementary school (138 | 18.9%), and middle school (119 | 16.3%).
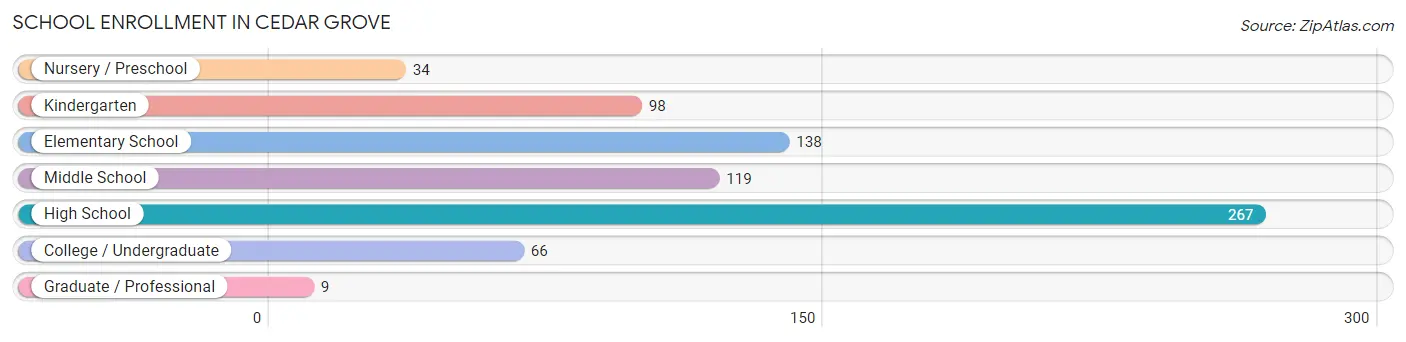
| School Level | # Students | % Students |
| Nursery / Preschool | 34 | 4.6% |
| Kindergarten | 98 | 13.4% |
| Elementary School | 138 | 18.9% |
| Middle School | 119 | 16.3% |
| High School | 267 | 36.5% |
| College / Undergraduate | 66 | 9.0% |
| Graduate / Professional | 9 | 1.2% |
| Total | 731 | 100.0% |
School Enrollment by Age by Funding Source in Cedar Grove
Out of a total of 731 students who are enrolled in schools in Cedar Grove, 43 (5.9%) attend a private institution, while the remaining 688 (94.1%) are enrolled in public schools. The age group of 35 years and over has the highest likelihood of being enrolled in private schools, with 9 (36.0% in the age bracket) enrolled. Conversely, the age group of 3 to 4 year olds has the lowest likelihood of being enrolled in a private school, with 11 (100.0% in the age bracket) attending a public institution.
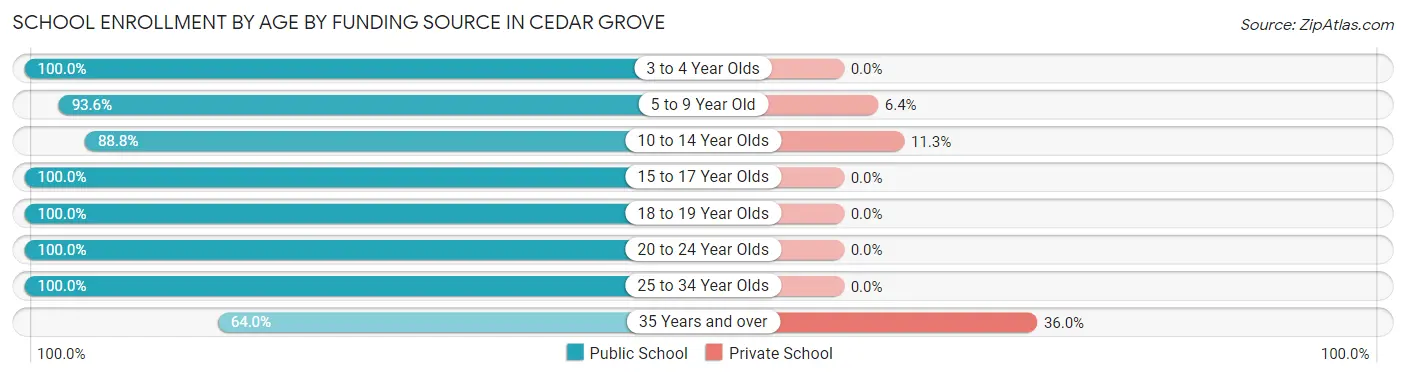
| Age Bracket | Public School | Private School |
| 3 to 4 Year Olds | 11 (100.0%) | 0 (0.0%) |
| 5 to 9 Year Old | 235 (93.6%) | 16 (6.4%) |
| 10 to 14 Year Olds | 142 (88.7%) | 18 (11.3%) |
| 15 to 17 Year Olds | 160 (100.0%) | 0 (0.0%) |
| 18 to 19 Year Olds | 74 (100.0%) | 0 (0.0%) |
| 20 to 24 Year Olds | 8 (100.0%) | 0 (0.0%) |
| 25 to 34 Year Olds | 42 (100.0%) | 0 (0.0%) |
| 35 Years and over | 16 (64.0%) | 9 (36.0%) |
| Total | 688 (94.1%) | 43 (5.9%) |
Educational Attainment by Field of Study in Cedar Grove
Business (53 | 28.5%), social sciences (43 | 23.1%), science & technology (24 | 12.9%), arts & humanities (21 | 11.3%), and education (16 | 8.6%) are the most common fields of study among 186 individuals in Cedar Grove who have obtained a bachelor's degree or higher.
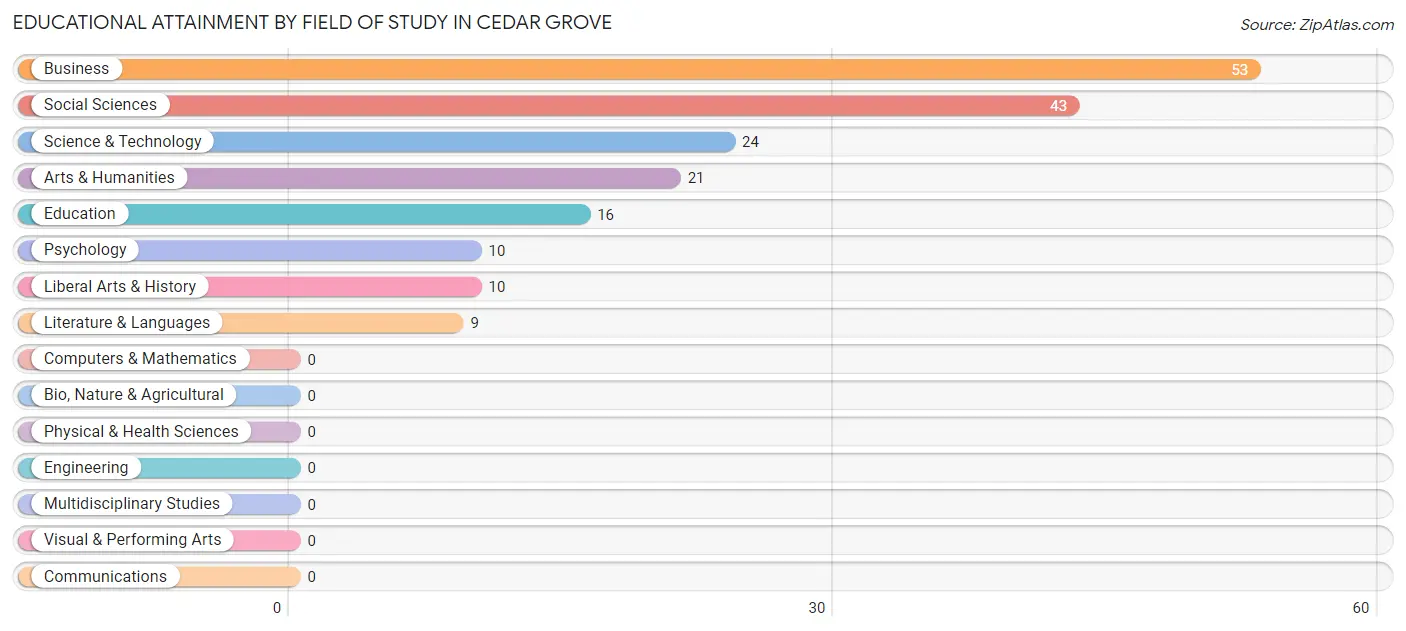
| Field of Study | # Graduates | % Graduates |
| Computers & Mathematics | 0 | 0.0% |
| Bio, Nature & Agricultural | 0 | 0.0% |
| Physical & Health Sciences | 0 | 0.0% |
| Psychology | 10 | 5.4% |
| Social Sciences | 43 | 23.1% |
| Engineering | 0 | 0.0% |
| Multidisciplinary Studies | 0 | 0.0% |
| Science & Technology | 24 | 12.9% |
| Business | 53 | 28.5% |
| Education | 16 | 8.6% |
| Literature & Languages | 9 | 4.8% |
| Liberal Arts & History | 10 | 5.4% |
| Visual & Performing Arts | 0 | 0.0% |
| Communications | 0 | 0.0% |
| Arts & Humanities | 21 | 11.3% |
| Total | 186 | 100.0% |
Transportation & Commute in Cedar Grove
Vehicle Availability by Sex in Cedar Grove
The most prevalent vehicle ownership categories in Cedar Grove are males with 2 vehicles (305, accounting for 43.7%) and females with 2 vehicles (250, making up 48.7%).
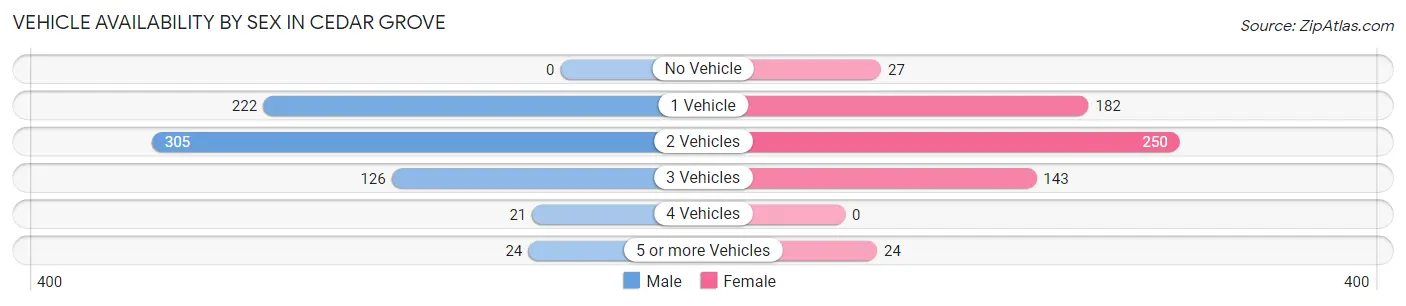
| Vehicles Available | Male | Female |
| No Vehicle | 0 (0.0%) | 27 (4.3%) |
| 1 Vehicle | 222 (31.8%) | 182 (29.1%) |
| 2 Vehicles | 305 (43.7%) | 250 (39.9%) |
| 3 Vehicles | 126 (18.0%) | 143 (22.8%) |
| 4 Vehicles | 21 (3.0%) | 0 (0.0%) |
| 5 or more Vehicles | 24 (3.4%) | 24 (3.8%) |
| Total | 698 (100.0%) | 626 (100.0%) |
Commute Time in Cedar Grove
The most frequently occuring commute durations in Cedar Grove are 15 to 19 minutes (334 commuters, 25.8%), 20 to 24 minutes (195 commuters, 15.0%), and 30 to 34 minutes (182 commuters, 14.0%).
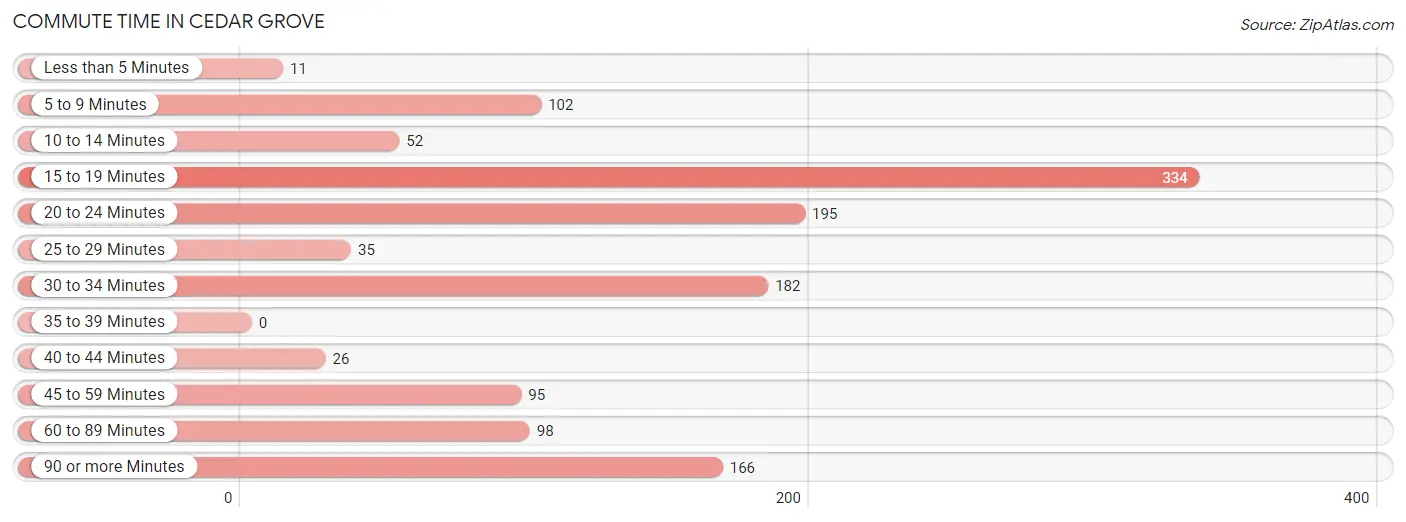
| Commute Time | # Commuters | % Commuters |
| Less than 5 Minutes | 11 | 0.9% |
| 5 to 9 Minutes | 102 | 7.9% |
| 10 to 14 Minutes | 52 | 4.0% |
| 15 to 19 Minutes | 334 | 25.8% |
| 20 to 24 Minutes | 195 | 15.0% |
| 25 to 29 Minutes | 35 | 2.7% |
| 30 to 34 Minutes | 182 | 14.0% |
| 35 to 39 Minutes | 0 | 0.0% |
| 40 to 44 Minutes | 26 | 2.0% |
| 45 to 59 Minutes | 95 | 7.3% |
| 60 to 89 Minutes | 98 | 7.6% |
| 90 or more Minutes | 166 | 12.8% |
Commute Time by Sex in Cedar Grove
The most common commute times in Cedar Grove are 15 to 19 minutes (209 commuters, 30.2%) for males and 15 to 19 minutes (125 commuters, 20.7%) for females.
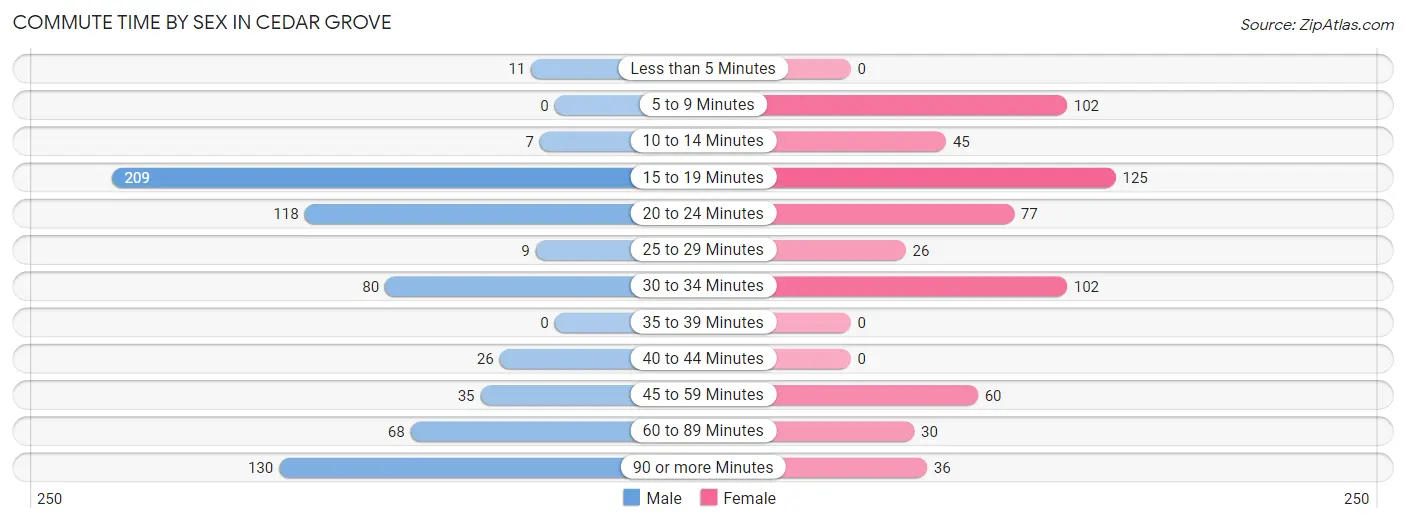
| Commute Time | Male | Female |
| Less than 5 Minutes | 11 (1.6%) | 0 (0.0%) |
| 5 to 9 Minutes | 0 (0.0%) | 102 (16.9%) |
| 10 to 14 Minutes | 7 (1.0%) | 45 (7.5%) |
| 15 to 19 Minutes | 209 (30.2%) | 125 (20.7%) |
| 20 to 24 Minutes | 118 (17.0%) | 77 (12.8%) |
| 25 to 29 Minutes | 9 (1.3%) | 26 (4.3%) |
| 30 to 34 Minutes | 80 (11.5%) | 102 (16.9%) |
| 35 to 39 Minutes | 0 (0.0%) | 0 (0.0%) |
| 40 to 44 Minutes | 26 (3.7%) | 0 (0.0%) |
| 45 to 59 Minutes | 35 (5.1%) | 60 (10.0%) |
| 60 to 89 Minutes | 68 (9.8%) | 30 (5.0%) |
| 90 or more Minutes | 130 (18.8%) | 36 (6.0%) |
Time of Departure to Work by Sex in Cedar Grove
The most frequent times of departure to work in Cedar Grove are 7:00 AM to 7:29 AM (194, 28.0%) for males and 7:00 AM to 7:29 AM (176, 29.2%) for females.
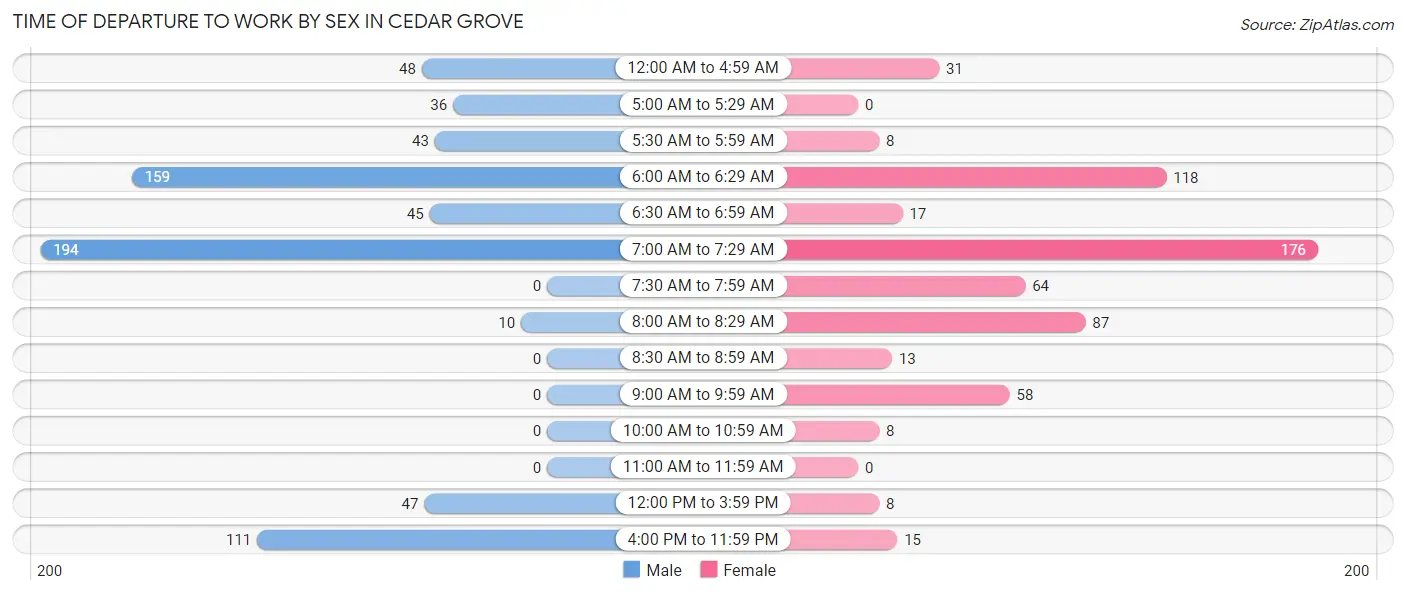
| Time of Departure | Male | Female |
| 12:00 AM to 4:59 AM | 48 (6.9%) | 31 (5.1%) |
| 5:00 AM to 5:29 AM | 36 (5.2%) | 0 (0.0%) |
| 5:30 AM to 5:59 AM | 43 (6.2%) | 8 (1.3%) |
| 6:00 AM to 6:29 AM | 159 (22.9%) | 118 (19.6%) |
| 6:30 AM to 6:59 AM | 45 (6.5%) | 17 (2.8%) |
| 7:00 AM to 7:29 AM | 194 (28.0%) | 176 (29.2%) |
| 7:30 AM to 7:59 AM | 0 (0.0%) | 64 (10.6%) |
| 8:00 AM to 8:29 AM | 10 (1.4%) | 87 (14.4%) |
| 8:30 AM to 8:59 AM | 0 (0.0%) | 13 (2.2%) |
| 9:00 AM to 9:59 AM | 0 (0.0%) | 58 (9.6%) |
| 10:00 AM to 10:59 AM | 0 (0.0%) | 8 (1.3%) |
| 11:00 AM to 11:59 AM | 0 (0.0%) | 0 (0.0%) |
| 12:00 PM to 3:59 PM | 47 (6.8%) | 8 (1.3%) |
| 4:00 PM to 11:59 PM | 111 (16.0%) | 15 (2.5%) |
| Total | 693 (100.0%) | 603 (100.0%) |
Housing Occupancy in Cedar Grove
Occupancy by Ownership in Cedar Grove
Of the total 1,180 dwellings in Cedar Grove, owner-occupied units account for 741 (62.8%), while renter-occupied units make up 439 (37.2%).
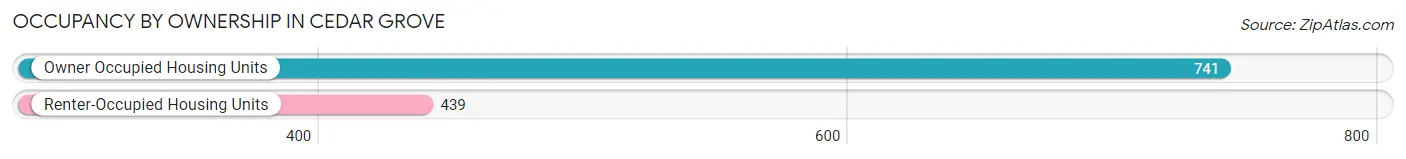
| Occupancy | # Housing Units | % Housing Units |
| Owner Occupied Housing Units | 741 | 62.8% |
| Renter-Occupied Housing Units | 439 | 37.2% |
| Total Occupied Housing Units | 1,180 | 100.0% |
Occupancy by Household Size in Cedar Grove
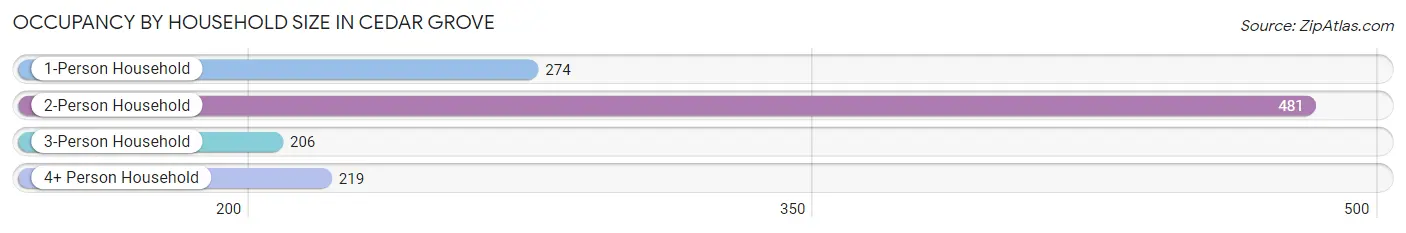
| Household Size | # Housing Units | % Housing Units |
| 1-Person Household | 274 | 23.2% |
| 2-Person Household | 481 | 40.8% |
| 3-Person Household | 206 | 17.5% |
| 4+ Person Household | 219 | 18.6% |
| Total Housing Units | 1,180 | 100.0% |
Occupancy by Ownership by Household Size in Cedar Grove
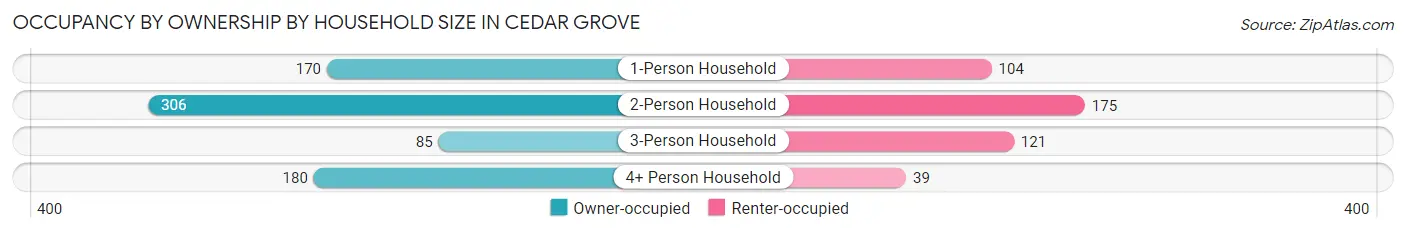
| Household Size | Owner-occupied | Renter-occupied |
| 1-Person Household | 170 (62.0%) | 104 (38.0%) |
| 2-Person Household | 306 (63.6%) | 175 (36.4%) |
| 3-Person Household | 85 (41.3%) | 121 (58.7%) |
| 4+ Person Household | 180 (82.2%) | 39 (17.8%) |
| Total Housing Units | 741 (62.8%) | 439 (37.2%) |
Occupancy by Educational Attainment in Cedar Grove
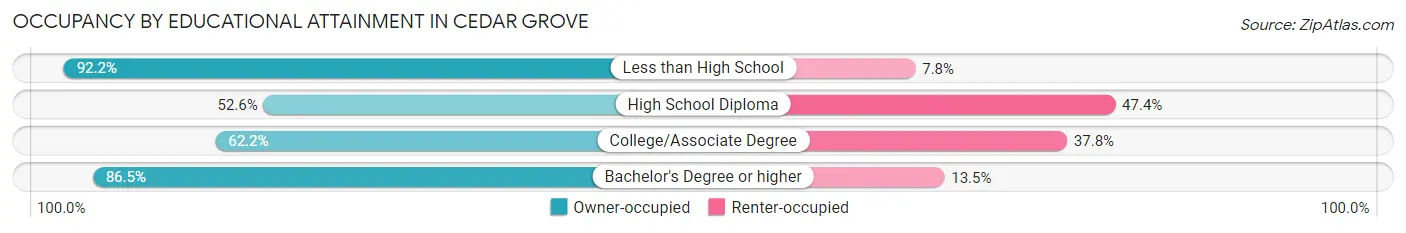
| Household Size | Owner-occupied | Renter-occupied |
| Less than High School | 107 (92.2%) | 9 (7.8%) |
| High School Diploma | 251 (52.6%) | 226 (47.4%) |
| College/Associate Degree | 319 (62.2%) | 194 (37.8%) |
| Bachelor's Degree or higher | 64 (86.5%) | 10 (13.5%) |
Occupancy by Age of Householder in Cedar Grove
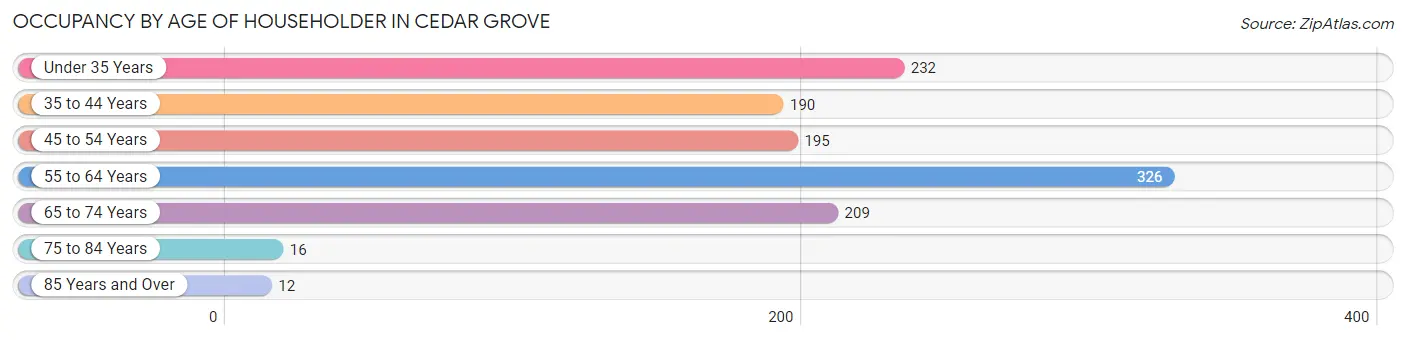
| Age Bracket | # Households | % Households |
| Under 35 Years | 232 | 19.7% |
| 35 to 44 Years | 190 | 16.1% |
| 45 to 54 Years | 195 | 16.5% |
| 55 to 64 Years | 326 | 27.6% |
| 65 to 74 Years | 209 | 17.7% |
| 75 to 84 Years | 16 | 1.4% |
| 85 Years and Over | 12 | 1.0% |
| Total | 1,180 | 100.0% |
Housing Finances in Cedar Grove
Median Income by Occupancy in Cedar Grove
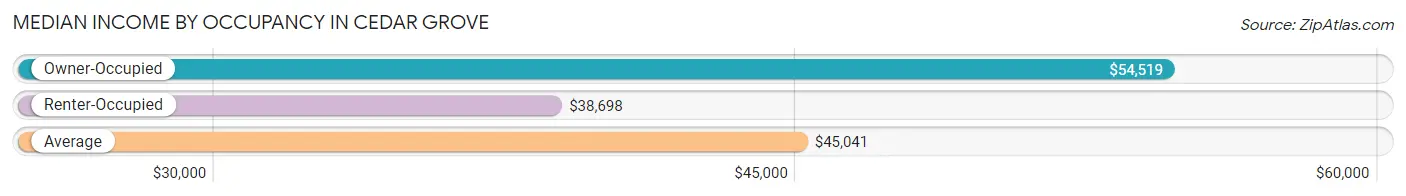
| Occupancy Type | # Households | Median Income |
| Owner-Occupied | 741 (62.8%) | $54,519 |
| Renter-Occupied | 439 (37.2%) | $38,698 |
| Average | 1,180 (100.0%) | $45,041 |
Occupancy by Householder Income Bracket in Cedar Grove
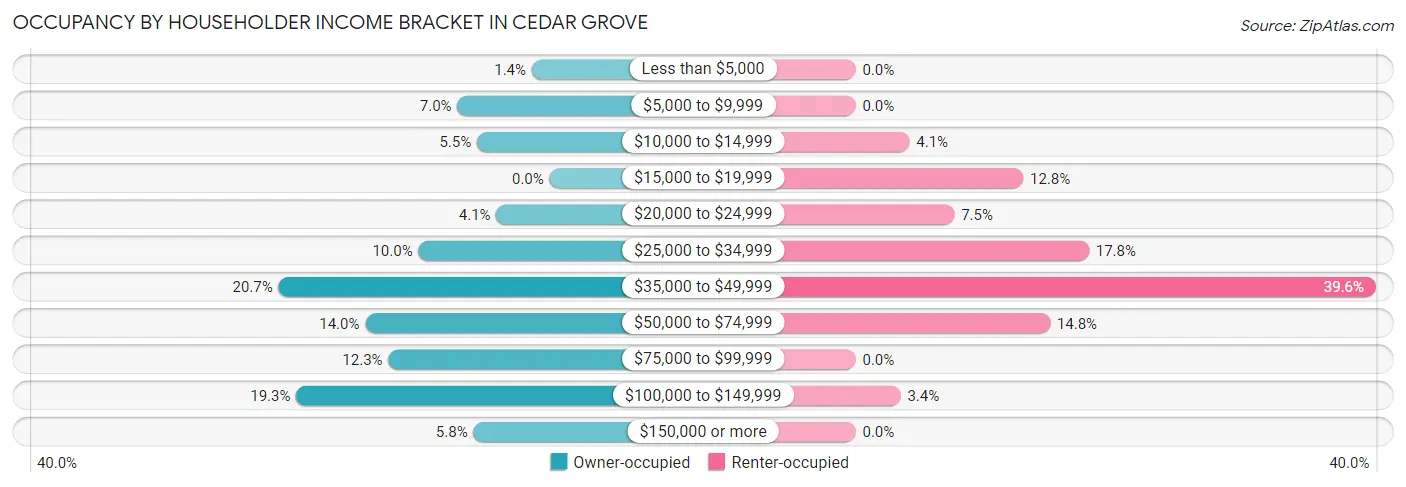
| Income Bracket | Owner-occupied | Renter-occupied |
| Less than $5,000 | 10 (1.3%) | 0 (0.0%) |
| $5,000 to $9,999 | 52 (7.0%) | 0 (0.0%) |
| $10,000 to $14,999 | 41 (5.5%) | 18 (4.1%) |
| $15,000 to $19,999 | 0 (0.0%) | 56 (12.8%) |
| $20,000 to $24,999 | 30 (4.1%) | 33 (7.5%) |
| $25,000 to $34,999 | 74 (10.0%) | 78 (17.8%) |
| $35,000 to $49,999 | 153 (20.6%) | 174 (39.6%) |
| $50,000 to $74,999 | 104 (14.0%) | 65 (14.8%) |
| $75,000 to $99,999 | 91 (12.3%) | 0 (0.0%) |
| $100,000 to $149,999 | 143 (19.3%) | 15 (3.4%) |
| $150,000 or more | 43 (5.8%) | 0 (0.0%) |
| Total | 741 (100.0%) | 439 (100.0%) |
Monthly Housing Cost Tiers in Cedar Grove
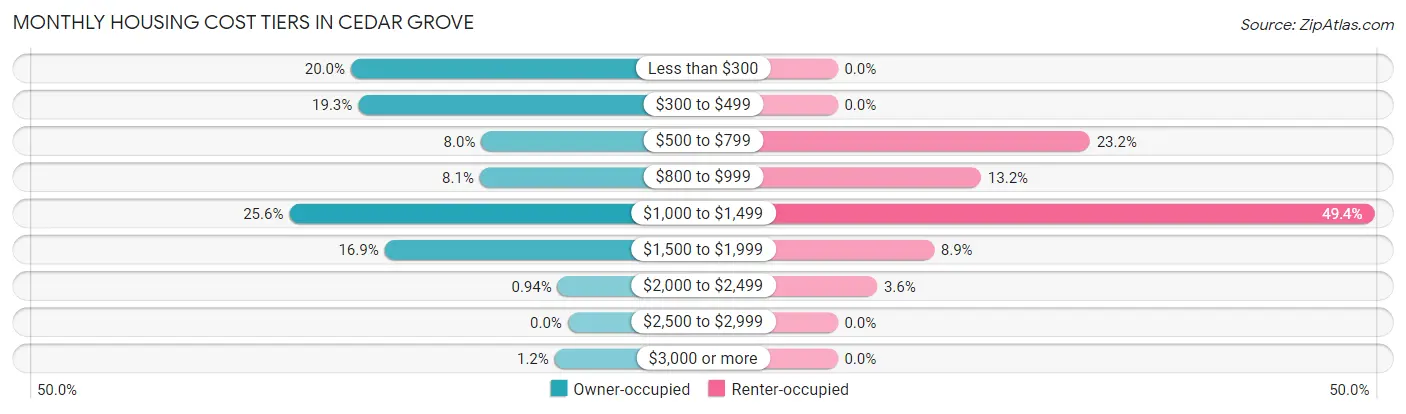
| Monthly Cost | Owner-occupied | Renter-occupied |
| Less than $300 | 148 (20.0%) | 0 (0.0%) |
| $300 to $499 | 143 (19.3%) | 0 (0.0%) |
| $500 to $799 | 59 (8.0%) | 102 (23.2%) |
| $800 to $999 | 60 (8.1%) | 58 (13.2%) |
| $1,000 to $1,499 | 190 (25.6%) | 217 (49.4%) |
| $1,500 to $1,999 | 125 (16.9%) | 39 (8.9%) |
| $2,000 to $2,499 | 7 (0.9%) | 16 (3.6%) |
| $2,500 to $2,999 | 0 (0.0%) | 0 (0.0%) |
| $3,000 or more | 9 (1.2%) | 0 (0.0%) |
| Total | 741 (100.0%) | 439 (100.0%) |
Physical Housing Characteristics in Cedar Grove
Housing Structures in Cedar Grove
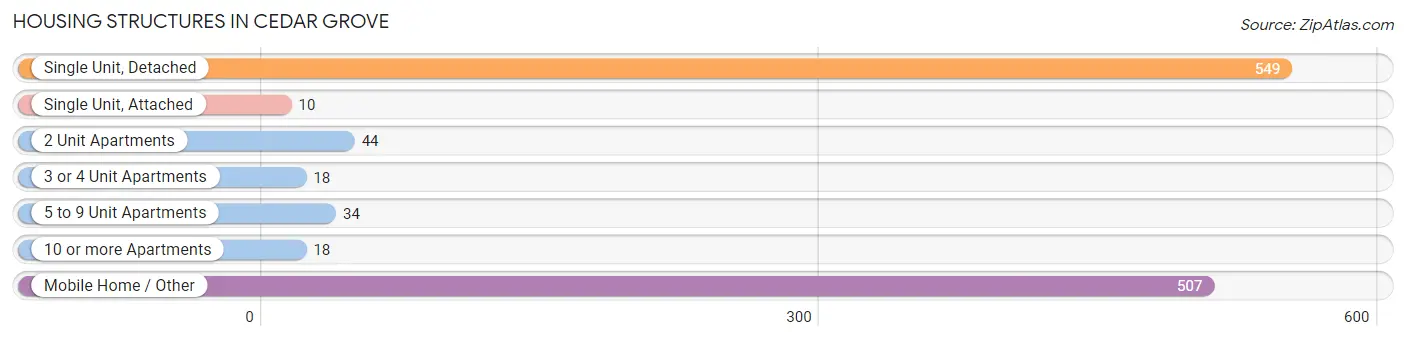
| Structure Type | # Housing Units | % Housing Units |
| Single Unit, Detached | 549 | 46.5% |
| Single Unit, Attached | 10 | 0.9% |
| 2 Unit Apartments | 44 | 3.7% |
| 3 or 4 Unit Apartments | 18 | 1.5% |
| 5 to 9 Unit Apartments | 34 | 2.9% |
| 10 or more Apartments | 18 | 1.5% |
| Mobile Home / Other | 507 | 43.0% |
| Total | 1,180 | 100.0% |
Housing Structures by Occupancy in Cedar Grove
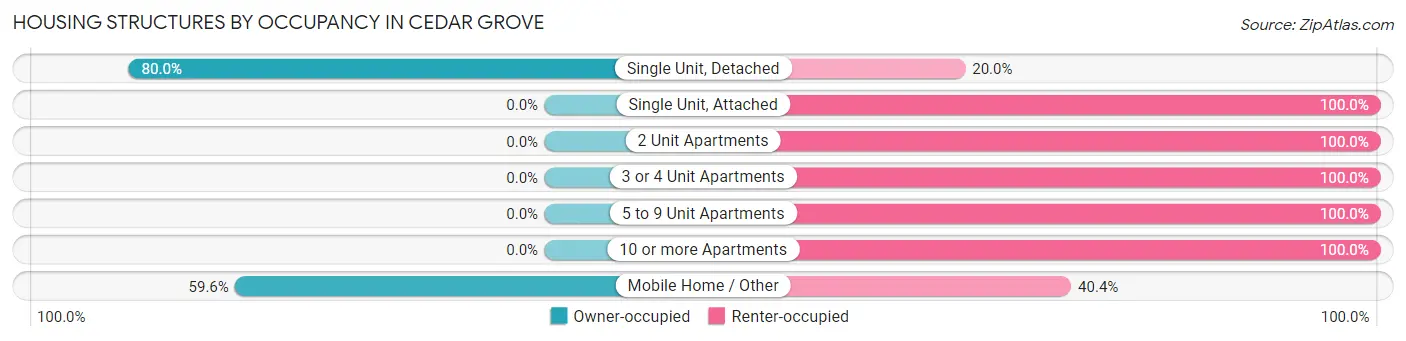
| Structure Type | Owner-occupied | Renter-occupied |
| Single Unit, Detached | 439 (80.0%) | 110 (20.0%) |
| Single Unit, Attached | 0 (0.0%) | 10 (100.0%) |
| 2 Unit Apartments | 0 (0.0%) | 44 (100.0%) |
| 3 or 4 Unit Apartments | 0 (0.0%) | 18 (100.0%) |
| 5 to 9 Unit Apartments | 0 (0.0%) | 34 (100.0%) |
| 10 or more Apartments | 0 (0.0%) | 18 (100.0%) |
| Mobile Home / Other | 302 (59.6%) | 205 (40.4%) |
| Total | 741 (62.8%) | 439 (37.2%) |
Housing Structures by Number of Rooms in Cedar Grove
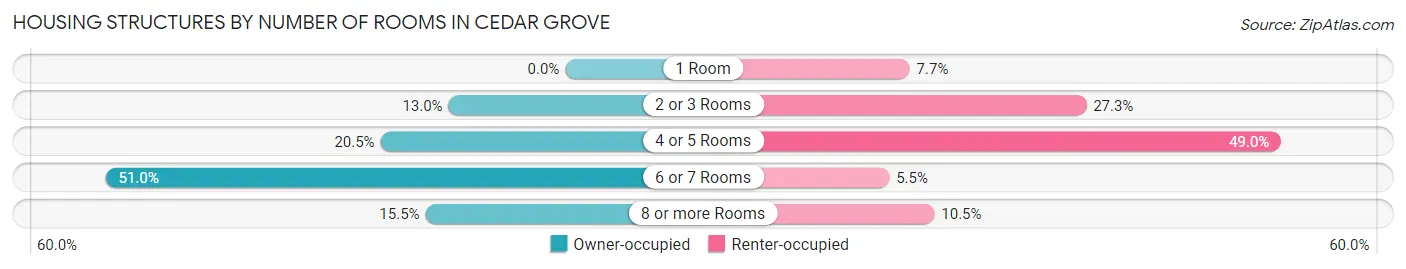
| Number of Rooms | Owner-occupied | Renter-occupied |
| 1 Room | 0 (0.0%) | 34 (7.7%) |
| 2 or 3 Rooms | 96 (13.0%) | 120 (27.3%) |
| 4 or 5 Rooms | 152 (20.5%) | 215 (49.0%) |
| 6 or 7 Rooms | 378 (51.0%) | 24 (5.5%) |
| 8 or more Rooms | 115 (15.5%) | 46 (10.5%) |
| Total | 741 (100.0%) | 439 (100.0%) |
Housing Structure by Heating Type in Cedar Grove
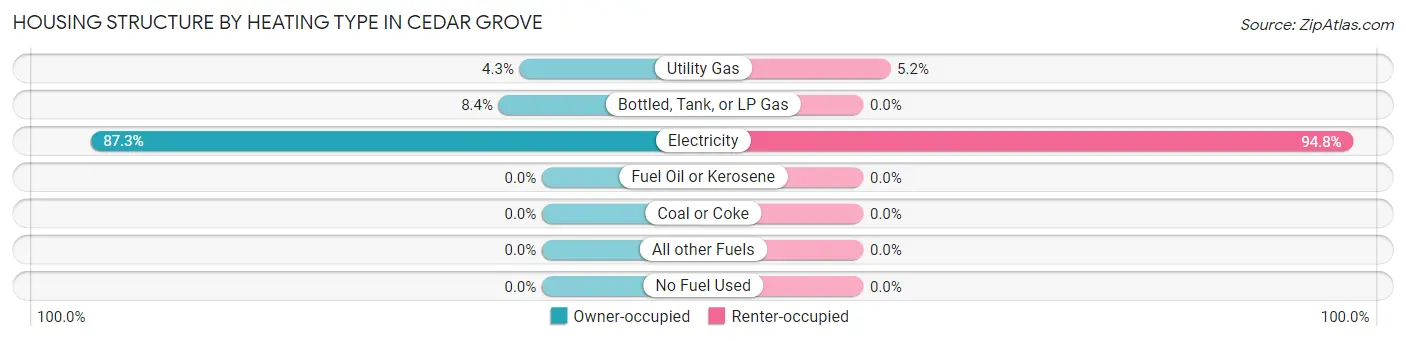
| Heating Type | Owner-occupied | Renter-occupied |
| Utility Gas | 32 (4.3%) | 23 (5.2%) |
| Bottled, Tank, or LP Gas | 62 (8.4%) | 0 (0.0%) |
| Electricity | 647 (87.3%) | 416 (94.8%) |
| Fuel Oil or Kerosene | 0 (0.0%) | 0 (0.0%) |
| Coal or Coke | 0 (0.0%) | 0 (0.0%) |
| All other Fuels | 0 (0.0%) | 0 (0.0%) |
| No Fuel Used | 0 (0.0%) | 0 (0.0%) |
| Total | 741 (100.0%) | 439 (100.0%) |
Household Vehicle Usage in Cedar Grove
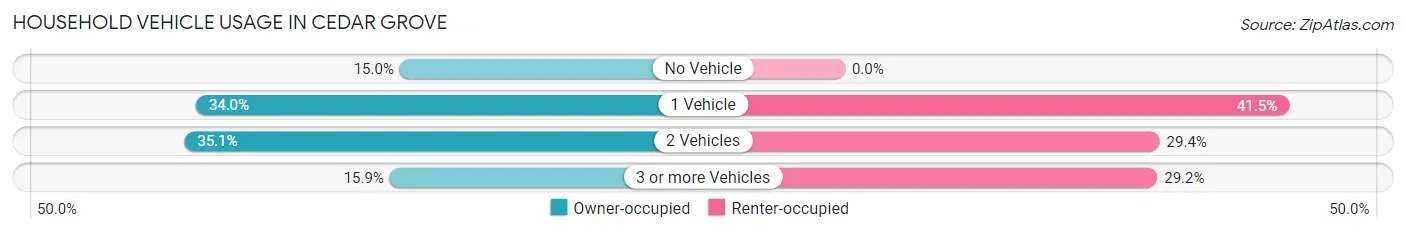
| Vehicles per Household | Owner-occupied | Renter-occupied |
| No Vehicle | 111 (15.0%) | 0 (0.0%) |
| 1 Vehicle | 252 (34.0%) | 182 (41.5%) |
| 2 Vehicles | 260 (35.1%) | 129 (29.4%) |
| 3 or more Vehicles | 118 (15.9%) | 128 (29.2%) |
| Total | 741 (100.0%) | 439 (100.0%) |
Real Estate & Mortgages in Cedar Grove
Real Estate and Mortgage Overview in Cedar Grove
| Characteristic | Without Mortgage | With Mortgage |
| Housing Units | 382 | 359 |
| Median Property Value | - | - |
| Median Household Income | $31,019 | $43 |
| Monthly Housing Costs | $343 | $0 |
| Real Estate Taxes | $293 | $19 |
Property Value by Mortgage Status in Cedar Grove
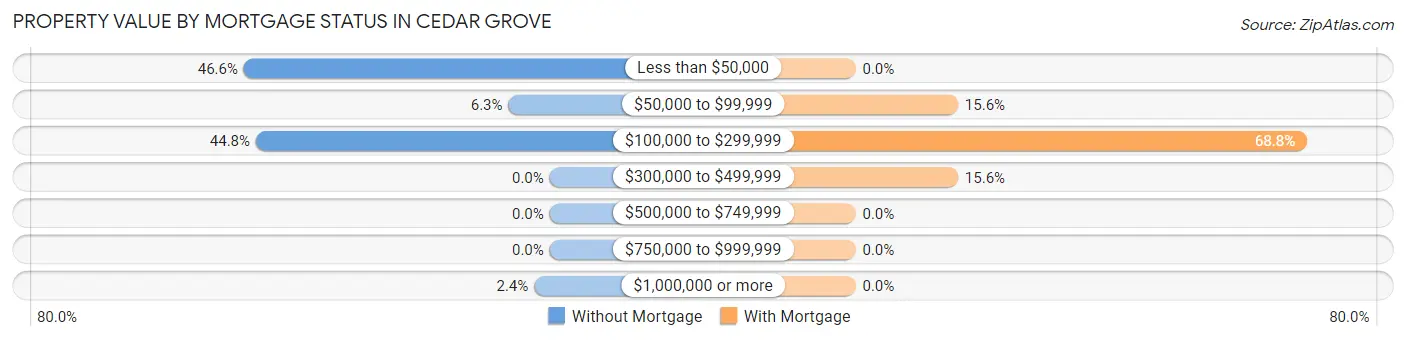
| Property Value | Without Mortgage | With Mortgage |
| Less than $50,000 | 178 (46.6%) | 0 (0.0%) |
| $50,000 to $99,999 | 24 (6.3%) | 56 (15.6%) |
| $100,000 to $299,999 | 171 (44.8%) | 247 (68.8%) |
| $300,000 to $499,999 | 0 (0.0%) | 56 (15.6%) |
| $500,000 to $749,999 | 0 (0.0%) | 0 (0.0%) |
| $750,000 to $999,999 | 0 (0.0%) | 0 (0.0%) |
| $1,000,000 or more | 9 (2.4%) | 0 (0.0%) |
| Total | 382 (100.0%) | 359 (100.0%) |
Household Income by Mortgage Status in Cedar Grove
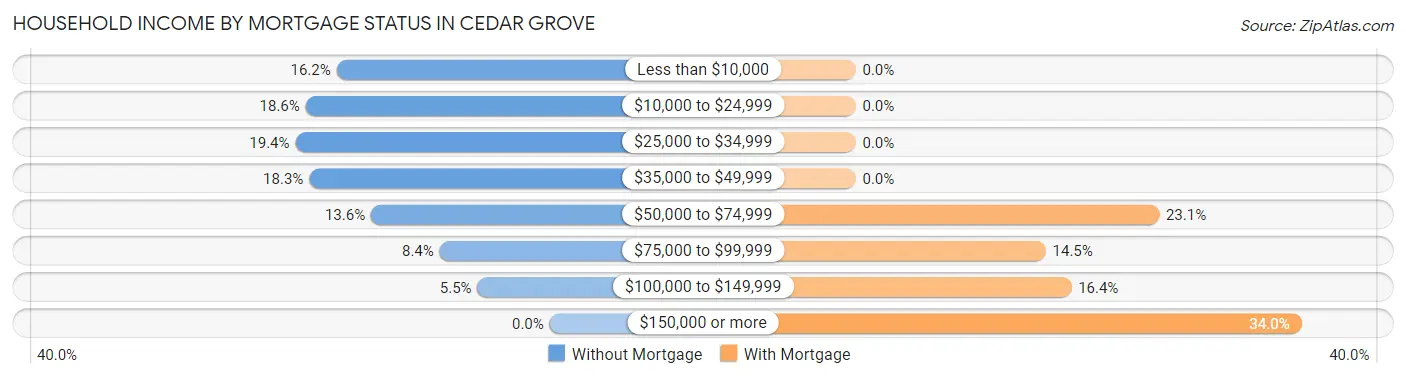
| Household Income | Without Mortgage | With Mortgage |
| Less than $10,000 | 62 (16.2%) | 0 (0.0%) |
| $10,000 to $24,999 | 71 (18.6%) | 0 (0.0%) |
| $25,000 to $34,999 | 74 (19.4%) | 0 (0.0%) |
| $35,000 to $49,999 | 70 (18.3%) | 0 (0.0%) |
| $50,000 to $74,999 | 52 (13.6%) | 83 (23.1%) |
| $75,000 to $99,999 | 32 (8.4%) | 52 (14.5%) |
| $100,000 to $149,999 | 21 (5.5%) | 59 (16.4%) |
| $150,000 or more | 0 (0.0%) | 122 (34.0%) |
| Total | 382 (100.0%) | 359 (100.0%) |
Property Value to Household Income Ratio in Cedar Grove
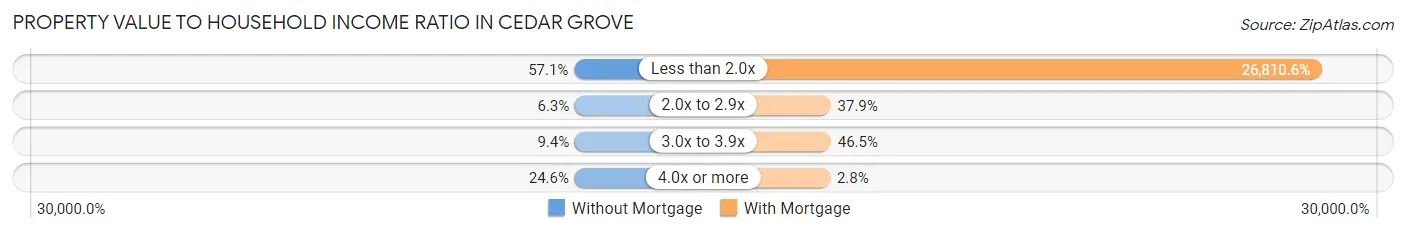
| Value-to-Income Ratio | Without Mortgage | With Mortgage |
| Less than 2.0x | 218 (57.1%) | 96,250 (26,810.6%) |
| 2.0x to 2.9x | 24 (6.3%) | 136 (37.9%) |
| 3.0x to 3.9x | 36 (9.4%) | 167 (46.5%) |
| 4.0x or more | 94 (24.6%) | 10 (2.8%) |
| Total | 382 (100.0%) | 359 (100.0%) |
Real Estate Taxes by Mortgage Status in Cedar Grove
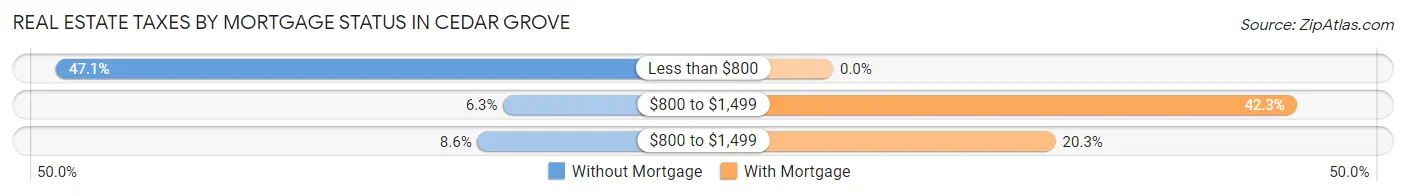
| Property Taxes | Without Mortgage | With Mortgage |
| Less than $800 | 180 (47.1%) | 0 (0.0%) |
| $800 to $1,499 | 24 (6.3%) | 152 (42.3%) |
| $800 to $1,499 | 33 (8.6%) | 73 (20.3%) |
| Total | 382 (100.0%) | 359 (100.0%) |
Health & Disability in Cedar Grove
Health Insurance Coverage by Age in Cedar Grove
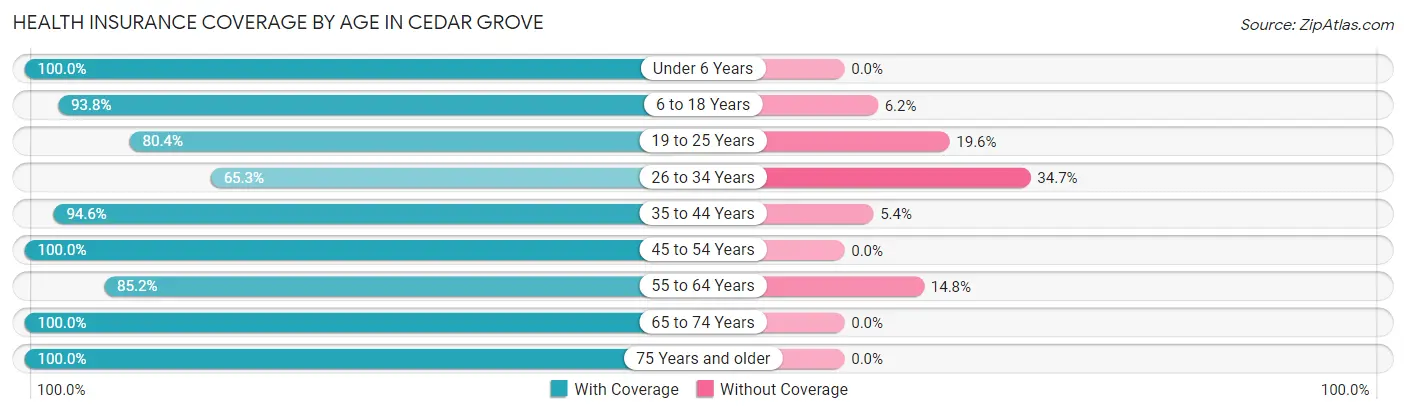
| Age Bracket | With Coverage | Without Coverage |
| Under 6 Years | 271 (100.0%) | 0 (0.0%) |
| 6 to 18 Years | 527 (93.8%) | 35 (6.2%) |
| 19 to 25 Years | 238 (80.4%) | 58 (19.6%) |
| 26 to 34 Years | 190 (65.3%) | 101 (34.7%) |
| 35 to 44 Years | 281 (94.6%) | 16 (5.4%) |
| 45 to 54 Years | 349 (100.0%) | 0 (0.0%) |
| 55 to 64 Years | 459 (85.2%) | 80 (14.8%) |
| 65 to 74 Years | 294 (100.0%) | 0 (0.0%) |
| 75 Years and older | 41 (100.0%) | 0 (0.0%) |
| Total | 2,650 (90.1%) | 290 (9.9%) |
Health Insurance Coverage by Citizenship Status in Cedar Grove

| Citizenship Status | With Coverage | Without Coverage |
| Native Born | 271 (100.0%) | 0 (0.0%) |
| Foreign Born, Citizen | 527 (93.8%) | 35 (6.2%) |
| Foreign Born, not a Citizen | 238 (80.4%) | 58 (19.6%) |
Health Insurance Coverage by Household Income in Cedar Grove
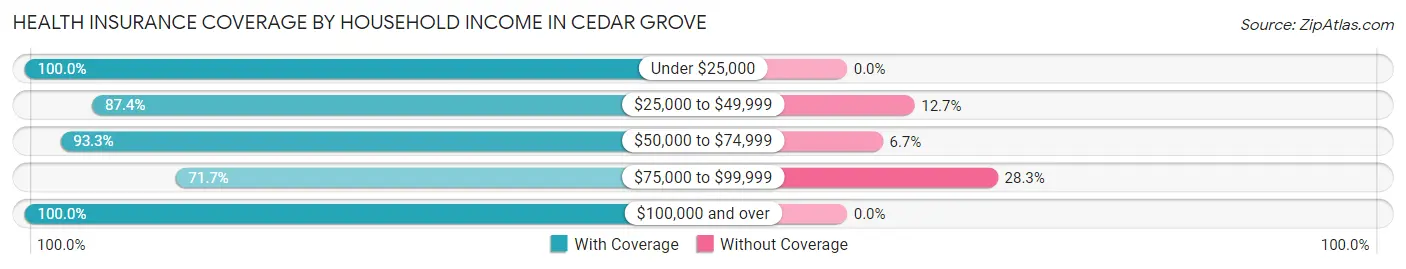
| Household Income | With Coverage | Without Coverage |
| Under $25,000 | 341 (100.0%) | 0 (0.0%) |
| $25,000 to $49,999 | 946 (87.4%) | 137 (12.7%) |
| $50,000 to $74,999 | 529 (93.3%) | 38 (6.7%) |
| $75,000 to $99,999 | 292 (71.7%) | 115 (28.3%) |
| $100,000 and over | 542 (100.0%) | 0 (0.0%) |
Public vs Private Health Insurance Coverage by Age in Cedar Grove
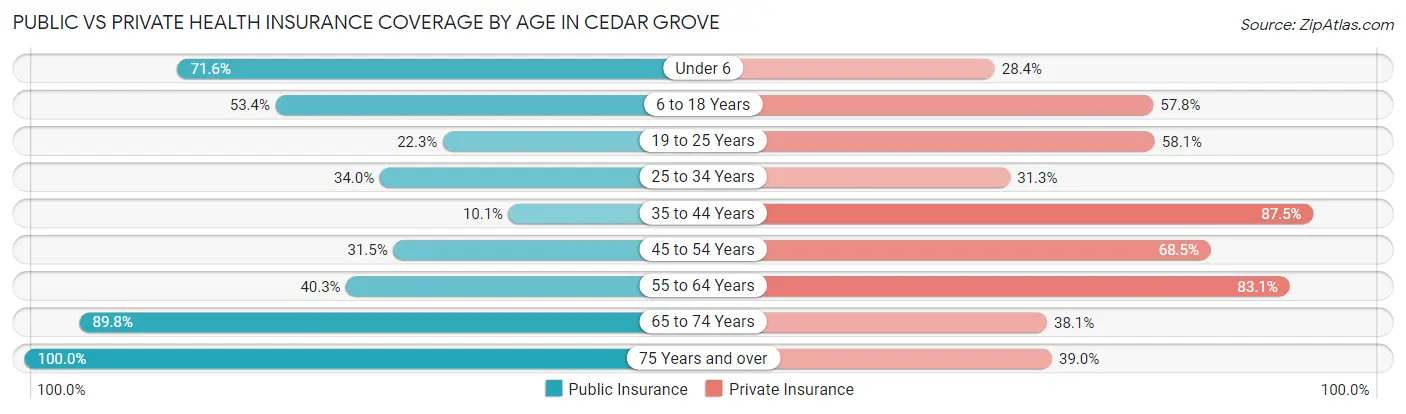
| Age Bracket | Public Insurance | Private Insurance |
| Under 6 | 194 (71.6%) | 77 (28.4%) |
| 6 to 18 Years | 300 (53.4%) | 325 (57.8%) |
| 19 to 25 Years | 66 (22.3%) | 172 (58.1%) |
| 25 to 34 Years | 99 (34.0%) | 91 (31.3%) |
| 35 to 44 Years | 30 (10.1%) | 260 (87.5%) |
| 45 to 54 Years | 110 (31.5%) | 239 (68.5%) |
| 55 to 64 Years | 217 (40.3%) | 448 (83.1%) |
| 65 to 74 Years | 264 (89.8%) | 112 (38.1%) |
| 75 Years and over | 41 (100.0%) | 16 (39.0%) |
| Total | 1,321 (44.9%) | 1,740 (59.2%) |
Disability Status by Sex by Age in Cedar Grove
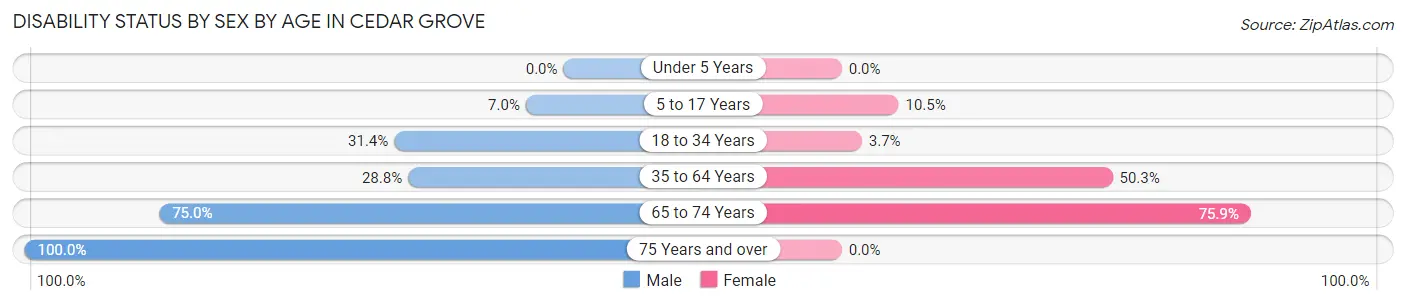
| Age Bracket | Male | Female |
| Under 5 Years | 0 (0.0%) | 0 (0.0%) |
| 5 to 17 Years | 25 (7.0%) | 28 (10.5%) |
| 18 to 34 Years | 60 (31.4%) | 16 (3.7%) |
| 35 to 64 Years | 169 (28.8%) | 301 (50.2%) |
| 65 to 74 Years | 96 (75.0%) | 126 (75.9%) |
| 75 Years and over | 12 (100.0%) | 0 (0.0%) |
Disability Class by Sex by Age in Cedar Grove
Disability Class: Hearing Difficulty
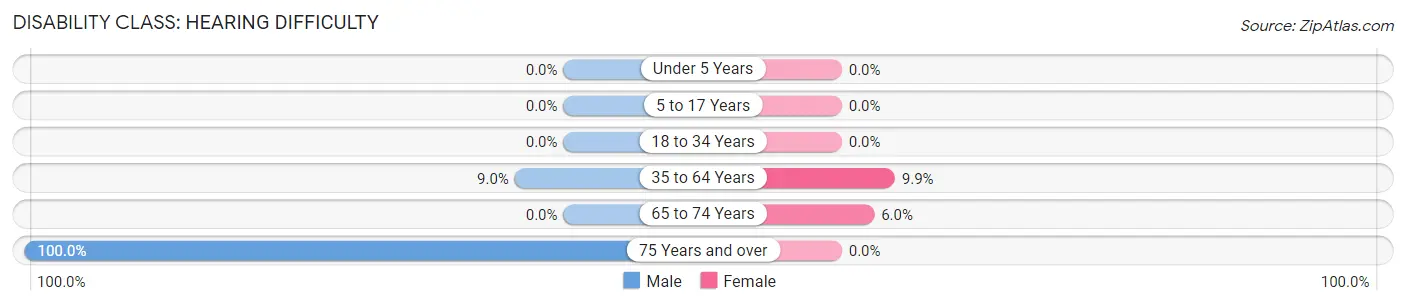
| Age Bracket | Male | Female |
| Under 5 Years | 0 (0.0%) | 0 (0.0%) |
| 5 to 17 Years | 0 (0.0%) | 0 (0.0%) |
| 18 to 34 Years | 0 (0.0%) | 0 (0.0%) |
| 35 to 64 Years | 53 (9.0%) | 59 (9.9%) |
| 65 to 74 Years | 0 (0.0%) | 10 (6.0%) |
| 75 Years and over | 12 (100.0%) | 0 (0.0%) |
Disability Class: Vision Difficulty
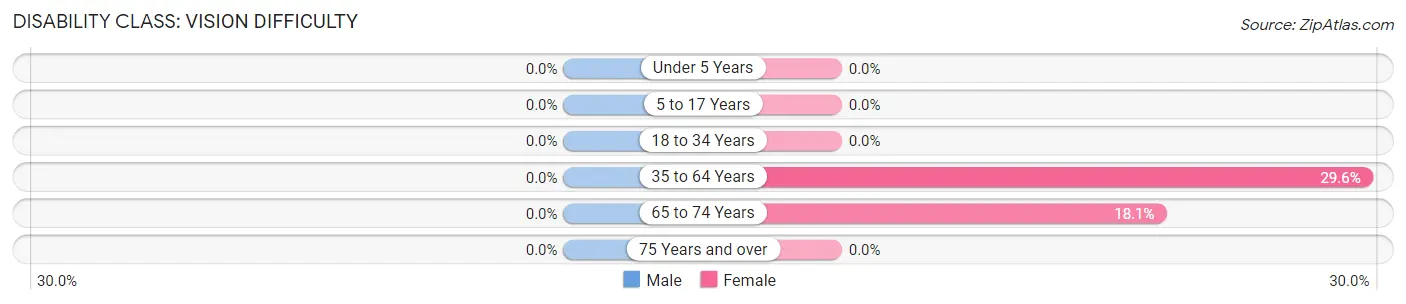
| Age Bracket | Male | Female |
| Under 5 Years | 0 (0.0%) | 0 (0.0%) |
| 5 to 17 Years | 0 (0.0%) | 0 (0.0%) |
| 18 to 34 Years | 0 (0.0%) | 0 (0.0%) |
| 35 to 64 Years | 0 (0.0%) | 177 (29.5%) |
| 65 to 74 Years | 0 (0.0%) | 30 (18.1%) |
| 75 Years and over | 0 (0.0%) | 0 (0.0%) |
Disability Class: Cognitive Difficulty
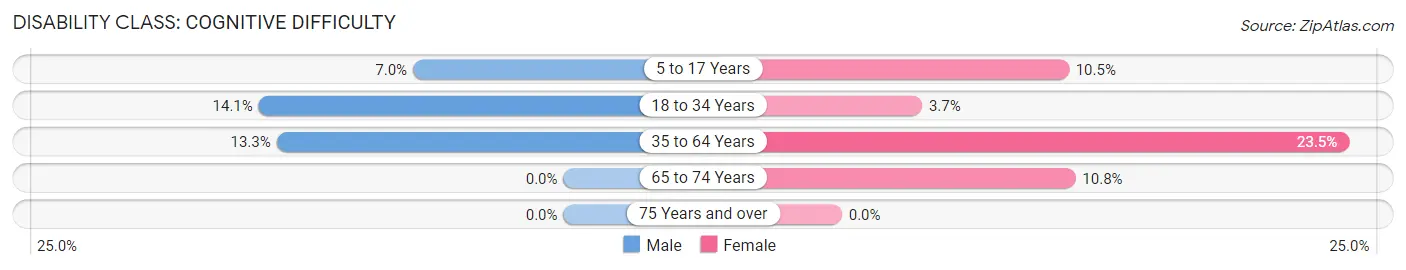
| Age Bracket | Male | Female |
| 5 to 17 Years | 25 (7.0%) | 28 (10.5%) |
| 18 to 34 Years | 27 (14.1%) | 16 (3.7%) |
| 35 to 64 Years | 78 (13.3%) | 141 (23.5%) |
| 65 to 74 Years | 0 (0.0%) | 18 (10.8%) |
| 75 Years and over | 0 (0.0%) | 0 (0.0%) |
Disability Class: Ambulatory Difficulty
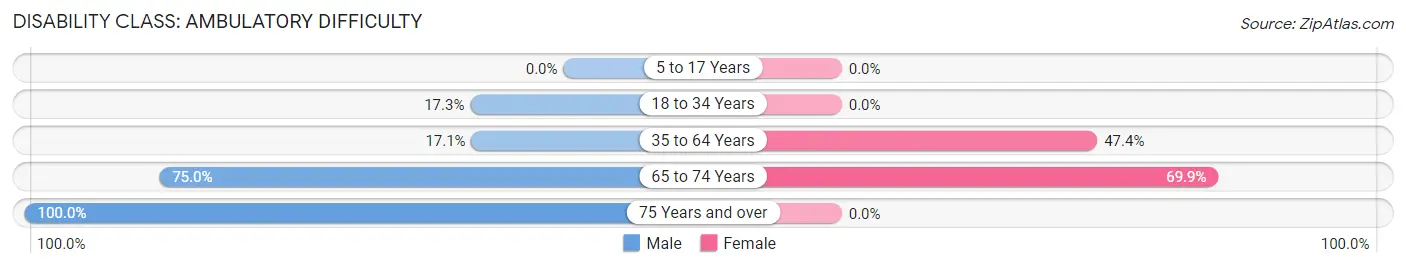
| Age Bracket | Male | Female |
| 5 to 17 Years | 0 (0.0%) | 0 (0.0%) |
| 18 to 34 Years | 33 (17.3%) | 0 (0.0%) |
| 35 to 64 Years | 100 (17.1%) | 284 (47.4%) |
| 65 to 74 Years | 96 (75.0%) | 116 (69.9%) |
| 75 Years and over | 12 (100.0%) | 0 (0.0%) |
Disability Class: Self-Care Difficulty
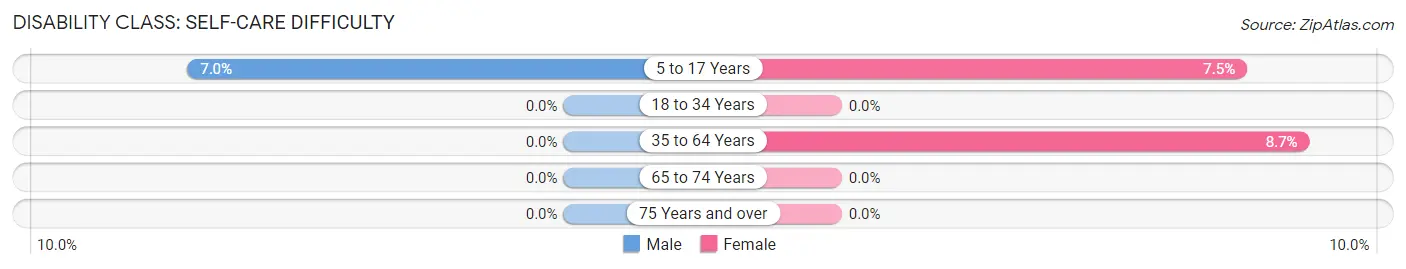
| Age Bracket | Male | Female |
| 5 to 17 Years | 25 (7.0%) | 20 (7.5%) |
| 18 to 34 Years | 0 (0.0%) | 0 (0.0%) |
| 35 to 64 Years | 0 (0.0%) | 52 (8.7%) |
| 65 to 74 Years | 0 (0.0%) | 0 (0.0%) |
| 75 Years and over | 0 (0.0%) | 0 (0.0%) |
Technology Access in Cedar Grove
Computing Device Access in Cedar Grove
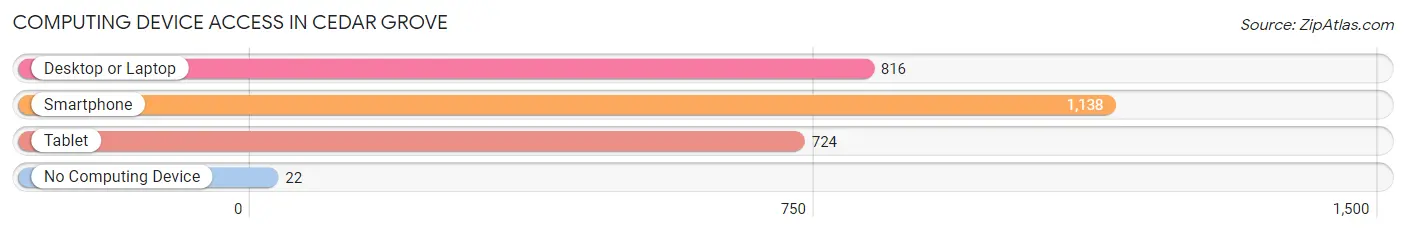
| Device Type | # Households | % Households |
| Desktop or Laptop | 816 | 69.2% |
| Smartphone | 1,138 | 96.4% |
| Tablet | 724 | 61.4% |
| No Computing Device | 22 | 1.9% |
| Total | 1,180 | 100.0% |
Internet Access in Cedar Grove
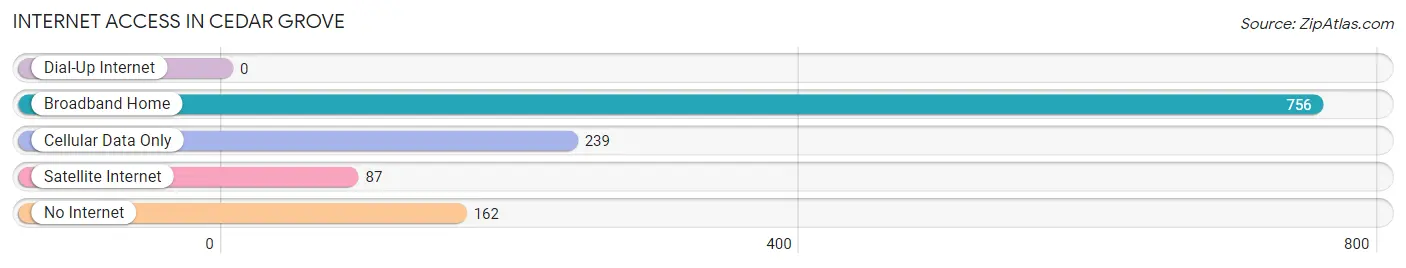
| Internet Type | # Households | % Households |
| Dial-Up Internet | 0 | 0.0% |
| Broadband Home | 756 | 64.1% |
| Cellular Data Only | 239 | 20.3% |
| Satellite Internet | 87 | 7.4% |
| No Internet | 162 | 13.7% |
| Total | 1,180 | 100.0% |
Cedar Grove Summary
Cedar Grove is a small unincorporated community located in the northern part of Clay County, Florida. It is situated on the banks of the St. Johns River, just south of the city of Jacksonville. The community is home to a population of approximately 1,000 people, and is part of the Jacksonville metropolitan area.
History
The area that is now Cedar Grove was originally inhabited by the Timucua Indians, who lived in the area for centuries before the arrival of Europeans. The first Europeans to settle in the area were French Huguenots, who established a trading post in the area in the late 1600s. The area was later settled by English colonists, who established a plantation in the area in the early 1700s. The plantation was eventually abandoned, and the area was largely uninhabited until the late 1800s, when a small community began to form.
The community was originally known as “Cedar Grove” due to the abundance of cedar trees in the area. The community was officially incorporated in 1891, and the first post office was established in 1892. The community grew slowly over the next several decades, and by the mid-1900s, it had become a popular destination for fishing and hunting.
Geography
Cedar Grove is located in northern Clay County, Florida, on the banks of the St. Johns River. The community is situated approximately 25 miles south of the city of Jacksonville, and is part of the Jacksonville metropolitan area. The community is bordered to the north by the city of Orange Park, to the east by the city of Green Cove Springs, to the south by the city of Middleburg, and to the west by the city of Keystone Heights.
The community is situated on a flat, sandy plain, and is surrounded by a variety of natural features, including wetlands, swamps, and forests. The St. Johns River forms the northern boundary of the community, and the Cedar Grove Canal runs through the center of the community.
Economy
The economy of Cedar Grove is largely based on agriculture and tourism. The community is home to several farms, which produce a variety of crops, including corn, soybeans, and hay. The community is also home to several tourist attractions, including a wildlife refuge, a state park, and a number of fishing and hunting lodges.
In addition to agriculture and tourism, the community is home to a number of small businesses, including restaurants, convenience stores, and gas stations. The community is also home to a number of manufacturing and industrial businesses, including a paper mill and a lumber mill.
Demographics
As of the 2010 census, the population of Cedar Grove was 1,000. The racial makeup of the community was 94.2% White, 2.2% African American, 0.7% Native American, 0.7% Asian, 0.3% from other races, and 1.9% from two or more races. Hispanic or Latino of any race were 2.2% of the population.
The median household income in Cedar Grove was $41,250, and the median family income was $45,625. The per capita income in the community was $19,845. About 11.2% of families and 13.2% of the population were below the poverty line, including 17.2% of those under age 18 and 8.2% of those age 65 or over.
Common Questions
What is Per Capita Income in Cedar Grove?
Per Capita income in Cedar Grove is $22,324.
What is the Median Family Income in Cedar Grove?
Median Family Income in Cedar Grove is $46,026.
What is the Median Household income in Cedar Grove?
Median Household Income in Cedar Grove is $45,041.
What is Income or Wage Gap in Cedar Grove?
Income or Wage Gap in Cedar Grove is 26.3%.
Women in Cedar Grove earn 73.7 cents for every dollar earned by a man.
What is Inequality or Gini Index in Cedar Grove?
Inequality or Gini Index in Cedar Grove is 0.38.
What is the Total Population of Cedar Grove?
Total Population of Cedar Grove is 3,019.
What is the Total Male Population of Cedar Grove?
Total Male Population of Cedar Grove is 1,429.
What is the Total Female Population of Cedar Grove?
Total Female Population of Cedar Grove is 1,590.
What is the Ratio of Males per 100 Females in Cedar Grove?
There are 89.87 Males per 100 Females in Cedar Grove.
What is the Ratio of Females per 100 Males in Cedar Grove?
There are 111.27 Females per 100 Males in Cedar Grove.
What is the Median Population Age in Cedar Grove?
Median Population Age in Cedar Grove is 35.2 Years.
What is the Average Family Size in Cedar Grove
Average Family Size in Cedar Grove is 3.1 People.
What is the Average Household Size in Cedar Grove
Average Household Size in Cedar Grove is 2.6 People.
How Large is the Labor Force in Cedar Grove?
There are 1,412 People in the Labor Forcein in Cedar Grove.
What is the Percentage of People in the Labor Force in Cedar Grove?
60.4% of People are in the Labor Force in Cedar Grove.
What is the Unemployment Rate in Cedar Grove?
Unemployment Rate in Cedar Grove is 2.8%.