Hernando Beach, FL Map & Demographics
Hernando Beach Map
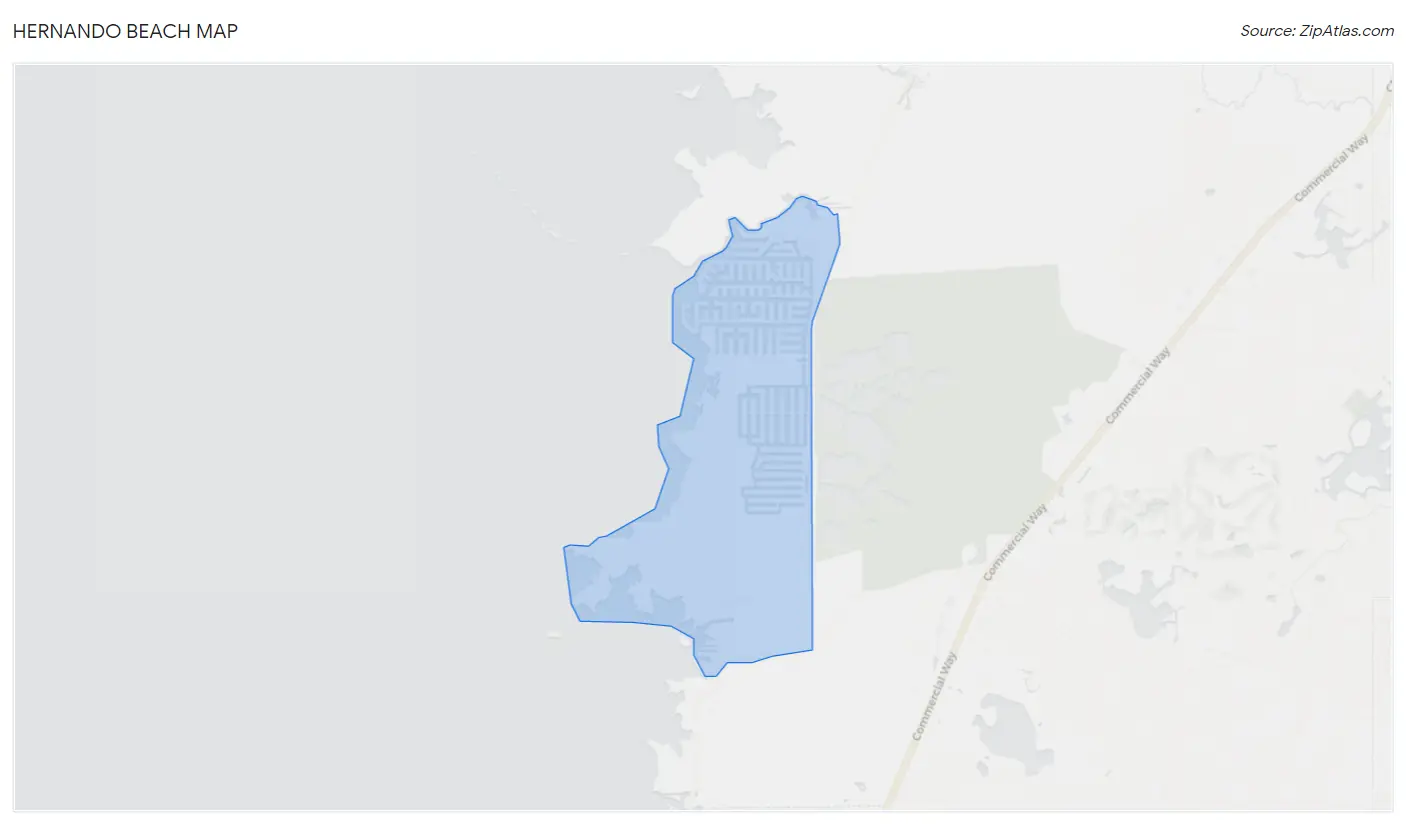
Hernando Beach Overview
$46,999
PER CAPITA INCOME
$84,976
AVG FAMILY INCOME
$84,154
AVG HOUSEHOLD INCOME
43.1%
WAGE / INCOME GAP [ % ]
56.9¢/ $1
WAGE / INCOME GAP [ $ ]
$7,663
FAMILY INCOME DEFICIT
0.35
INEQUALITY / GINI INDEX
2,558
TOTAL POPULATION
1,241
MALE POPULATION
1,317
FEMALE POPULATION
94.23
MALES / 100 FEMALES
106.12
FEMALES / 100 MALES
58.1
MEDIAN AGE
2.4
AVG FAMILY SIZE
2.3
AVG HOUSEHOLD SIZE
1,415
LABOR FORCE [ PEOPLE ]
58.2%
PERCENT IN LABOR FORCE
4.9%
UNEMPLOYMENT RATE
Hernando Beach Area Codes
Income in Hernando Beach
Income Overview in Hernando Beach
Per Capita Income in Hernando Beach is $46,999, while median incomes of families and households are $84,976 and $84,154 respectively.
| Characteristic | Number | Measure |
| Per Capita Income | 2,558 | $46,999 |
| Median Family Income | 961 | $84,976 |
| Mean Family Income | 961 | $114,107 |
| Median Household Income | 1,116 | $84,154 |
| Mean Household Income | 1,116 | $109,049 |
| Income Deficit | 961 | $7,663 |
| Wage / Income Gap (%) | 2,558 | 43.14% |
| Wage / Income Gap ($) | 2,558 | 56.86¢ per $1 |
| Gini / Inequality Index | 2,558 | 0.35 |
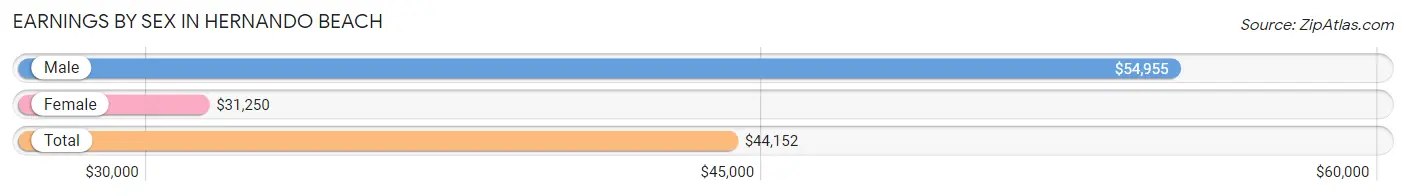
Earnings by Sex in Hernando Beach
Average Earnings in Hernando Beach are $44,152, $54,955 for men and $31,250 for women, a difference of 43.1%.
| Sex | Number | Average Earnings |
| Male | 679 (48.4%) | $54,955 |
| Female | 724 (51.6%) | $31,250 |
| Total | 1,403 (100.0%) | $44,152 |
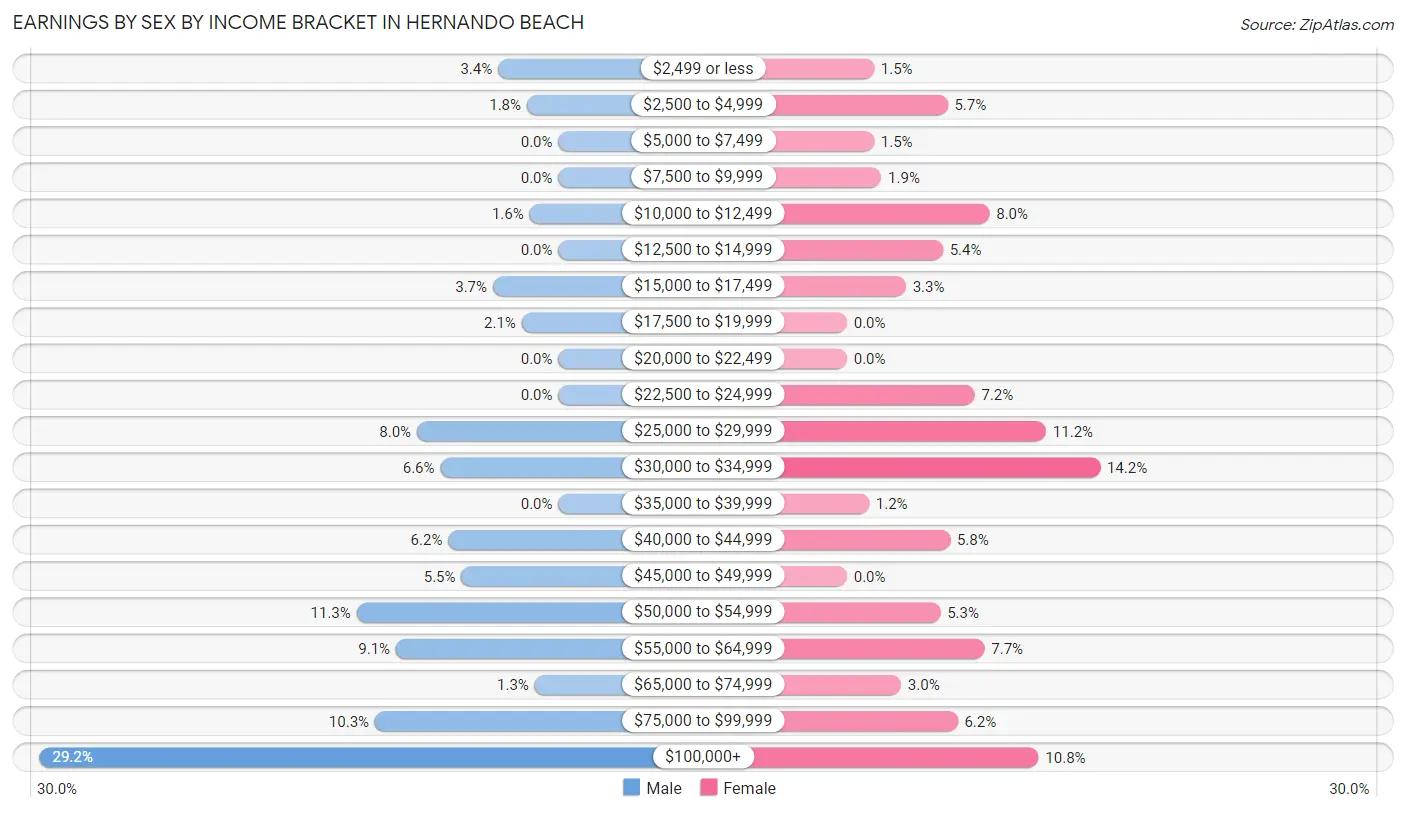
Earnings by Sex by Income Bracket in Hernando Beach
The most common earnings brackets in Hernando Beach are $100,000+ for men (198 | 29.2%) and $30,000 to $34,999 for women (103 | 14.2%).
| Income | Male | Female |
| $2,499 or less | 23 (3.4%) | 11 (1.5%) |
| $2,500 to $4,999 | 12 (1.8%) | 41 (5.7%) |
| $5,000 to $7,499 | 0 (0.0%) | 11 (1.5%) |
| $7,500 to $9,999 | 0 (0.0%) | 14 (1.9%) |
| $10,000 to $12,499 | 11 (1.6%) | 58 (8.0%) |
| $12,500 to $14,999 | 0 (0.0%) | 39 (5.4%) |
| $15,000 to $17,499 | 25 (3.7%) | 24 (3.3%) |
| $17,500 to $19,999 | 14 (2.1%) | 0 (0.0%) |
| $20,000 to $22,499 | 0 (0.0%) | 0 (0.0%) |
| $22,500 to $24,999 | 0 (0.0%) | 52 (7.2%) |
| $25,000 to $29,999 | 54 (8.0%) | 81 (11.2%) |
| $30,000 to $34,999 | 45 (6.6%) | 103 (14.2%) |
| $35,000 to $39,999 | 0 (0.0%) | 9 (1.2%) |
| $40,000 to $44,999 | 42 (6.2%) | 42 (5.8%) |
| $45,000 to $49,999 | 37 (5.4%) | 0 (0.0%) |
| $50,000 to $54,999 | 77 (11.3%) | 38 (5.2%) |
| $55,000 to $64,999 | 62 (9.1%) | 56 (7.7%) |
| $65,000 to $74,999 | 9 (1.3%) | 22 (3.0%) |
| $75,000 to $99,999 | 70 (10.3%) | 45 (6.2%) |
| $100,000+ | 198 (29.2%) | 78 (10.8%) |
| Total | 679 (100.0%) | 724 (100.0%) |
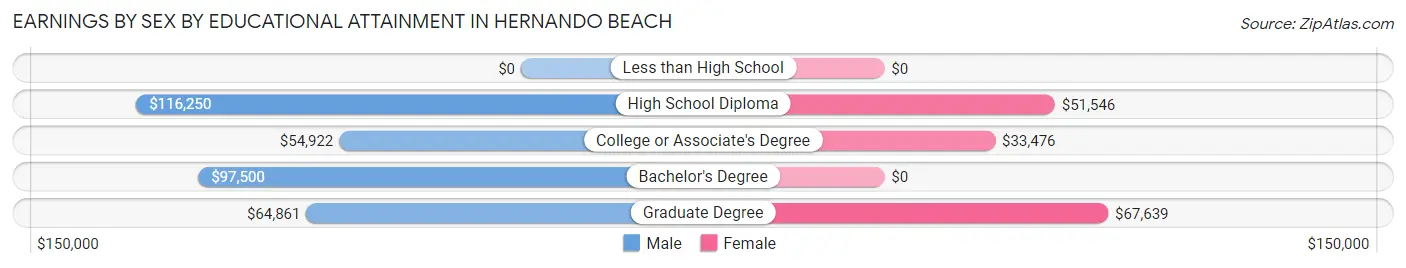
Earnings by Sex by Educational Attainment in Hernando Beach
Average earnings in Hernando Beach are $57,321 for men and $38,750 for women, a difference of 32.4%. Men with an educational attainment of high school diploma enjoy the highest average annual earnings of $116,250, while those with college or associate's degree education earn the least with $54,922. Women with an educational attainment of graduate degree earn the most with the average annual earnings of $67,639, while those with college or associate's degree education have the smallest earnings of $33,476.
| Educational Attainment | Male Income | Female Income |
| Less than High School | - | - |
| High School Diploma | $116,250 | $51,546 |
| College or Associate's Degree | $54,922 | $33,476 |
| Bachelor's Degree | $97,500 | $0 |
| Graduate Degree | $64,861 | $67,639 |
| Total | $57,321 | $38,750 |
Family Income in Hernando Beach
Family Income Brackets in Hernando Beach
According to the Hernando Beach family income data, there are 208 families falling into the $100,000 to $149,999 income range, which is the most common income bracket and makes up 21.6% of all families. Conversely, the less than $10,000 income bracket is the least frequent group with only 5 families (0.5%) belonging to this category.
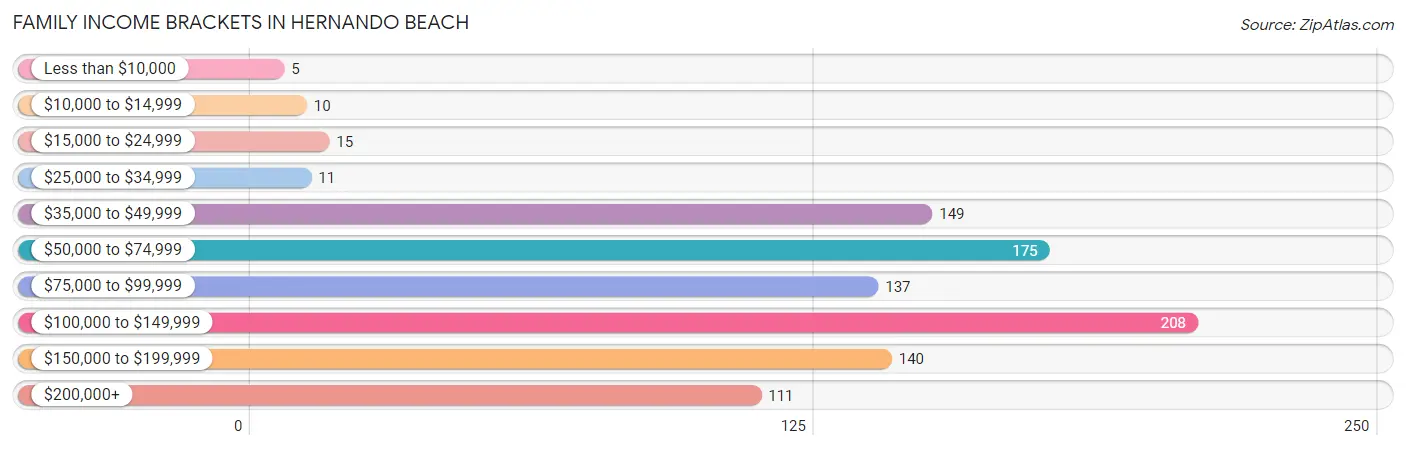
| Income Bracket | # Families | % Families |
| Less than $10,000 | 5 | 0.5% |
| $10,000 to $14,999 | 10 | 1.0% |
| $15,000 to $24,999 | 15 | 1.6% |
| $25,000 to $34,999 | 11 | 1.1% |
| $35,000 to $49,999 | 149 | 15.5% |
| $50,000 to $74,999 | 175 | 18.2% |
| $75,000 to $99,999 | 137 | 14.3% |
| $100,000 to $149,999 | 208 | 21.6% |
| $150,000 to $199,999 | 140 | 14.6% |
| $200,000+ | 111 | 11.6% |
Family Income by Famaliy Size in Hernando Beach
3-person families (195 | 20.3%) account for the highest median family income in Hernando Beach with $163,321 per family, while 3-person families (195 | 20.3%) have the highest median income of $54,440 per family member.
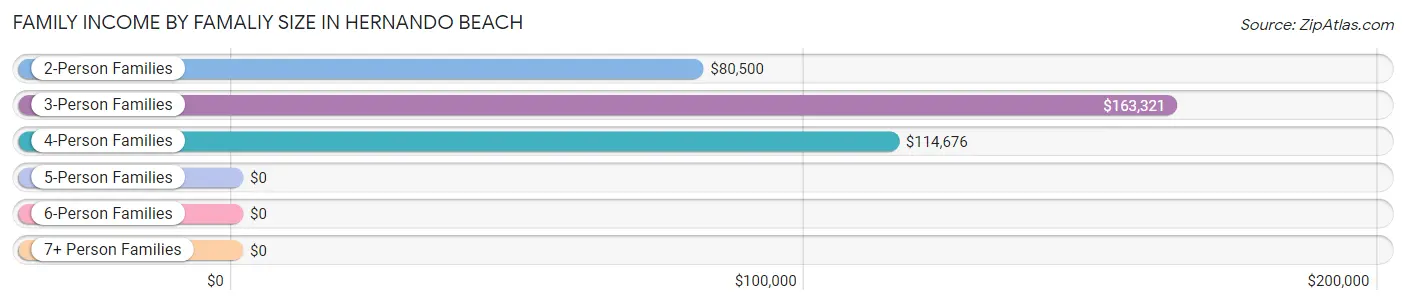
| Income Bracket | # Families | Median Income |
| 2-Person Families | 680 (70.8%) | $80,500 |
| 3-Person Families | 195 (20.3%) | $163,321 |
| 4-Person Families | 77 (8.0%) | $114,676 |
| 5-Person Families | 4 (0.4%) | $0 |
| 6-Person Families | 0 (0.0%) | $0 |
| 7+ Person Families | 5 (0.5%) | $0 |
| Total | 961 (100.0%) | $84,976 |
Family Income by Number of Earners in Hernando Beach
The median family income in Hernando Beach is $84,976, with families comprising 2 earners (193) having the highest median family income of $167,664, while families with no earners (304) have the lowest median family income of $53,750, accounting for 20.1% and 31.6% of families, respectively.
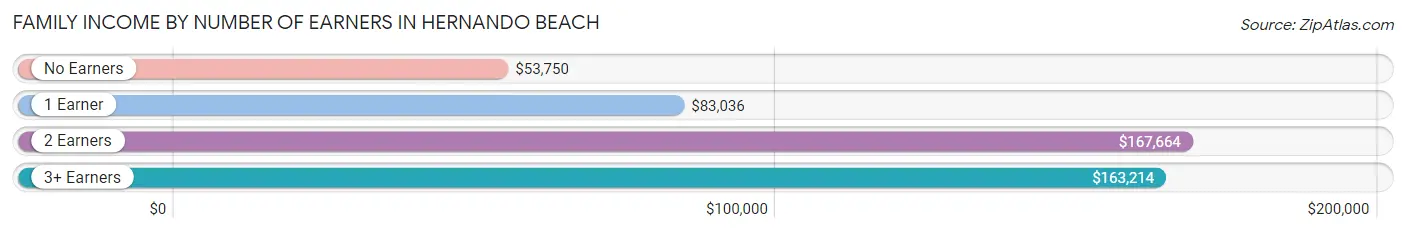
| Number of Earners | # Families | Median Income |
| No Earners | 304 (31.6%) | $53,750 |
| 1 Earner | 272 (28.3%) | $83,036 |
| 2 Earners | 193 (20.1%) | $167,664 |
| 3+ Earners | 192 (20.0%) | $163,214 |
| Total | 961 (100.0%) | $84,976 |
Household Income in Hernando Beach
Household Income Brackets in Hernando Beach
With 224 households falling in the category, the $100,000 to $149,999 income range is the most frequent in Hernando Beach, accounting for 20.1% of all households. In contrast, only 4 households (0.4%) fall into the less than $10,000 income bracket, making it the least populous group.
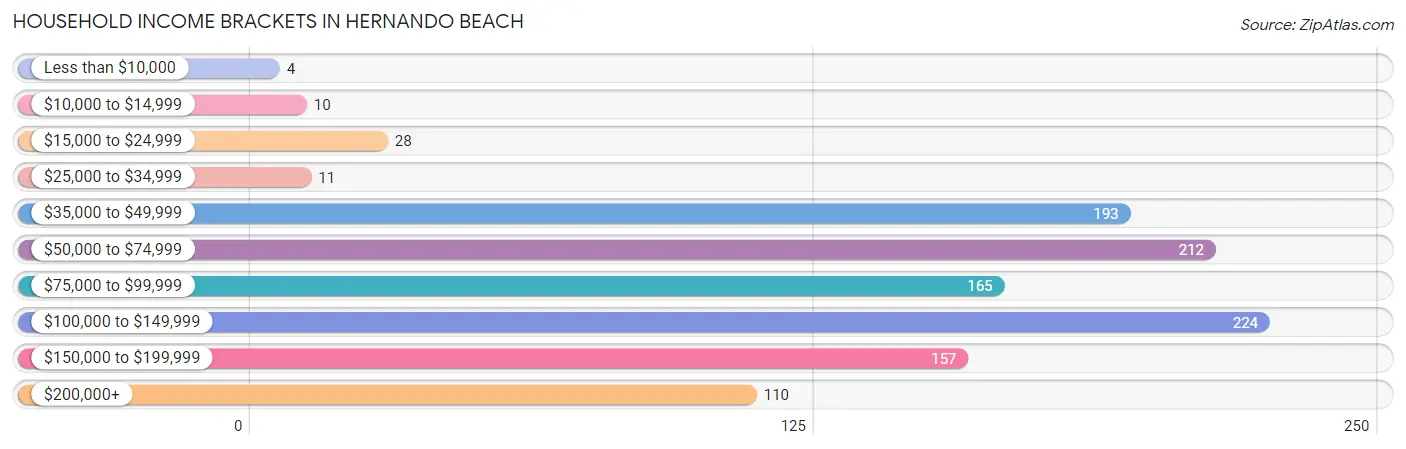
| Income Bracket | # Households | % Households |
| Less than $10,000 | 4 | 0.4% |
| $10,000 to $14,999 | 10 | 0.9% |
| $15,000 to $24,999 | 28 | 2.5% |
| $25,000 to $34,999 | 11 | 1.0% |
| $35,000 to $49,999 | 193 | 17.3% |
| $50,000 to $74,999 | 212 | 19.0% |
| $75,000 to $99,999 | 165 | 14.8% |
| $100,000 to $149,999 | 224 | 20.1% |
| $150,000 to $199,999 | 157 | 14.1% |
| $200,000+ | 110 | 9.9% |
Household Income by Householder Age in Hernando Beach
The median household income in Hernando Beach is $84,154, with the highest median household income of $122,022 found in the 45 to 64 years age bracket for the primary householder. A total of 571 households (51.2%) fall into this category. Meanwhile, the 15 to 24 years age bracket for the primary householder has the lowest median household income of $0, with 28 households (2.5%) in this group.
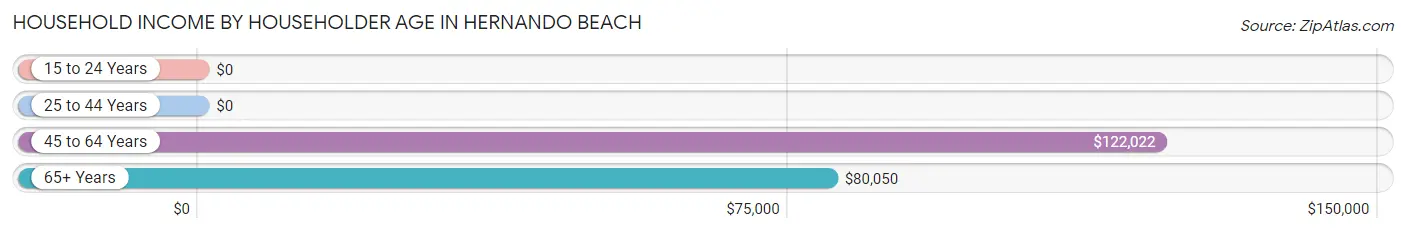
| Income Bracket | # Households | Median Income |
| 15 to 24 Years | 28 (2.5%) | $0 |
| 25 to 44 Years | 82 (7.3%) | $0 |
| 45 to 64 Years | 571 (51.2%) | $122,022 |
| 65+ Years | 435 (39.0%) | $80,050 |
| Total | 1,116 (100.0%) | $84,154 |
Poverty in Hernando Beach
Income Below Poverty by Sex and Age in Hernando Beach
With 4.0% poverty level for males and 5.9% for females among the residents of Hernando Beach, 12 to 14 year old males and 15 year old females are the most vulnerable to poverty, with 6 males (100.0%) and 6 females (100.0%) in their respective age groups living below the poverty level.
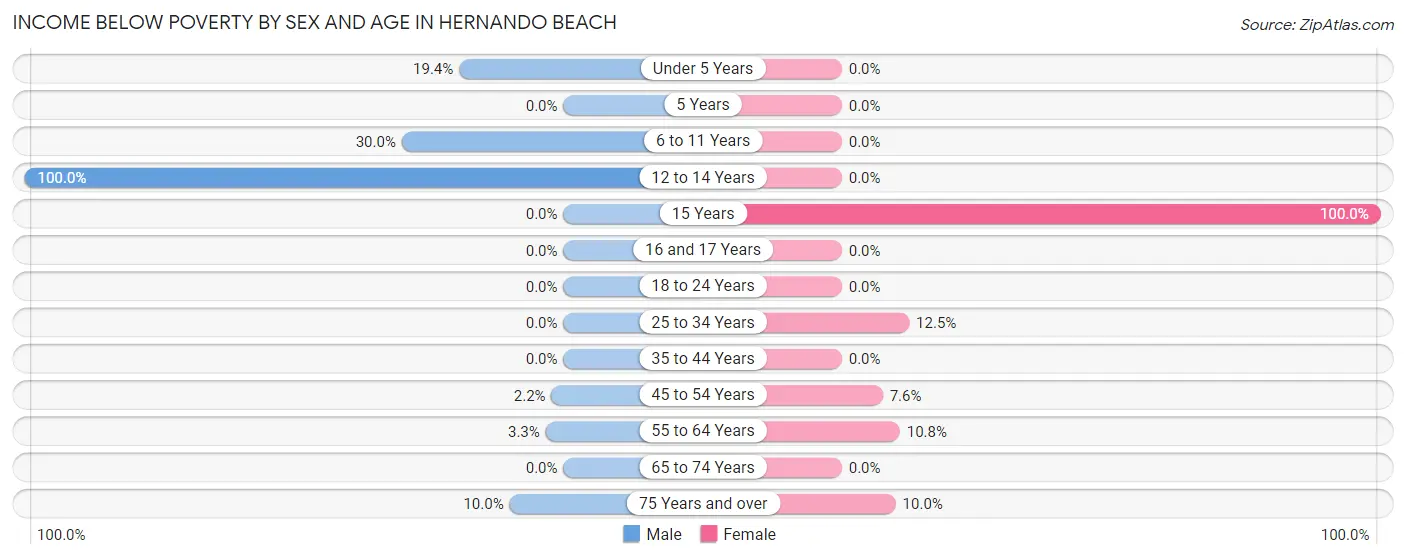
| Age Bracket | Male | Female |
| Under 5 Years | 6 (19.4%) | 0 (0.0%) |
| 5 Years | 0 (0.0%) | 0 (0.0%) |
| 6 to 11 Years | 6 (30.0%) | 0 (0.0%) |
| 12 to 14 Years | 6 (100.0%) | 0 (0.0%) |
| 15 Years | 0 (0.0%) | 6 (100.0%) |
| 16 and 17 Years | 0 (0.0%) | 0 (0.0%) |
| 18 to 24 Years | 0 (0.0%) | 0 (0.0%) |
| 25 to 34 Years | 0 (0.0%) | 6 (12.5%) |
| 35 to 44 Years | 0 (0.0%) | 0 (0.0%) |
| 45 to 54 Years | 6 (2.2%) | 17 (7.6%) |
| 55 to 64 Years | 10 (3.3%) | 34 (10.8%) |
| 65 to 74 Years | 0 (0.0%) | 0 (0.0%) |
| 75 Years and over | 15 (10.0%) | 14 (10.0%) |
| Total | 49 (4.0%) | 77 (5.9%) |
Income Above Poverty by Sex and Age in Hernando Beach
According to the poverty statistics in Hernando Beach, males aged 15 years and females aged under 5 years are the age groups that are most secure financially, with 100.0% of males and 100.0% of females in these age groups living above the poverty line.
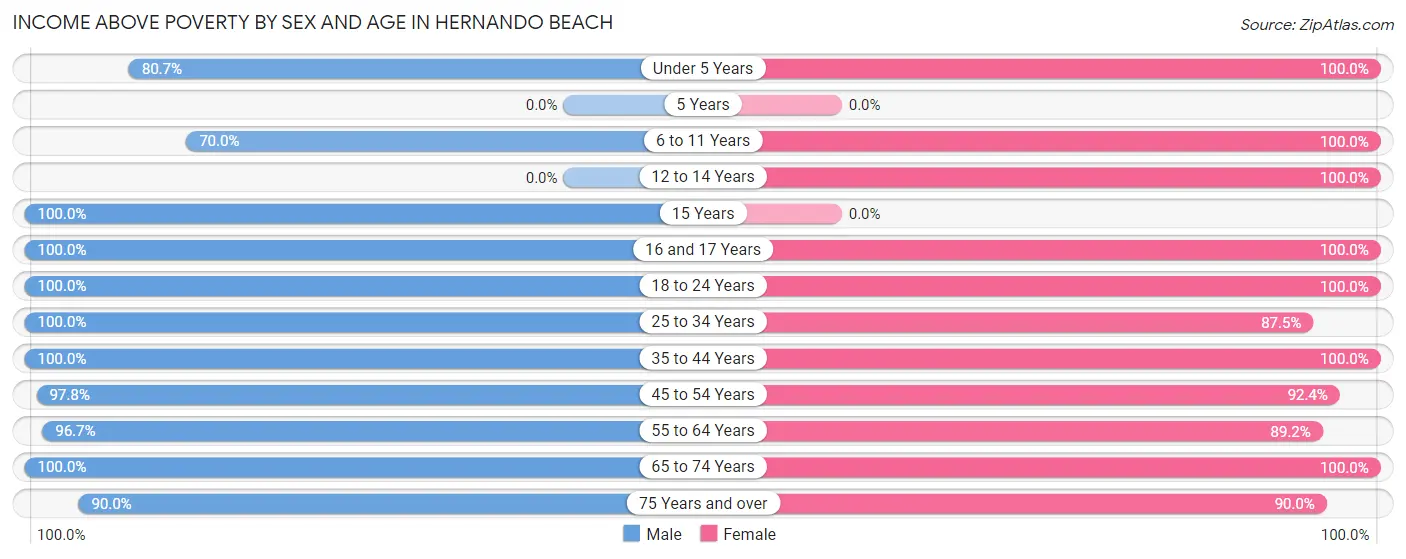
| Age Bracket | Male | Female |
| Under 5 Years | 25 (80.6%) | 7 (100.0%) |
| 5 Years | 0 (0.0%) | 0 (0.0%) |
| 6 to 11 Years | 14 (70.0%) | 34 (100.0%) |
| 12 to 14 Years | 0 (0.0%) | 9 (100.0%) |
| 15 Years | 14 (100.0%) | 0 (0.0%) |
| 16 and 17 Years | 29 (100.0%) | 11 (100.0%) |
| 18 to 24 Years | 66 (100.0%) | 167 (100.0%) |
| 25 to 34 Years | 35 (100.0%) | 42 (87.5%) |
| 35 to 44 Years | 85 (100.0%) | 49 (100.0%) |
| 45 to 54 Years | 265 (97.8%) | 207 (92.4%) |
| 55 to 64 Years | 294 (96.7%) | 282 (89.2%) |
| 65 to 74 Years | 230 (100.0%) | 306 (100.0%) |
| 75 Years and over | 135 (90.0%) | 126 (90.0%) |
| Total | 1,192 (96.1%) | 1,240 (94.2%) |
Income Below Poverty Among Married-Couple Families in Hernando Beach
The poverty statistics for married-couple families in Hernando Beach show that 3.6% or 30 of the total 835 families live below the poverty line. Families with 3 or 4 children have the highest poverty rate of 55.6%, comprising of 5 families. On the other hand, families with 1 or 2 children have the lowest poverty rate of 0.0%, which includes 0 families.
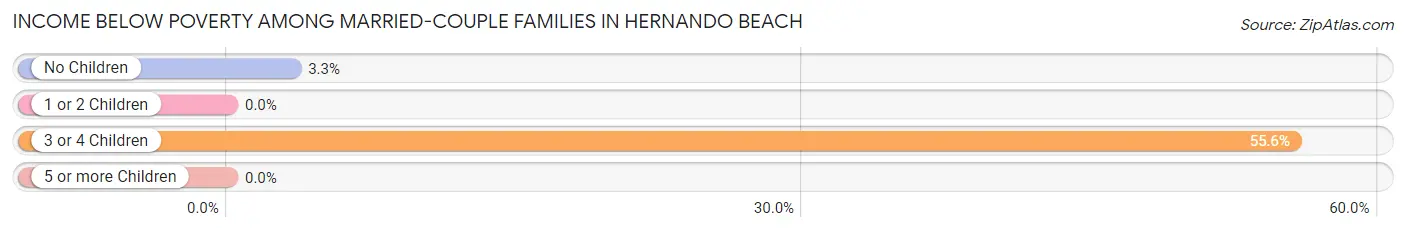
| Children | Above Poverty | Below Poverty |
| No Children | 732 (96.7%) | 25 (3.3%) |
| 1 or 2 Children | 69 (100.0%) | 0 (0.0%) |
| 3 or 4 Children | 4 (44.4%) | 5 (55.6%) |
| 5 or more Children | 0 (0.0%) | 0 (0.0%) |
| Total | 805 (96.4%) | 30 (3.6%) |
Income Below Poverty Among Single-Parent Households in Hernando Beach
| Children | Single Father | Single Mother |
| No Children | 0 (0.0%) | 0 (0.0%) |
| 1 or 2 Children | 0 (0.0%) | 0 (0.0%) |
| 3 or 4 Children | 0 (0.0%) | 0 (0.0%) |
| 5 or more Children | 0 (0.0%) | 0 (0.0%) |
| Total | 0 (0.0%) | 0 (0.0%) |
Income Below Poverty Among Married-Couple vs Single-Parent Households in Hernando Beach
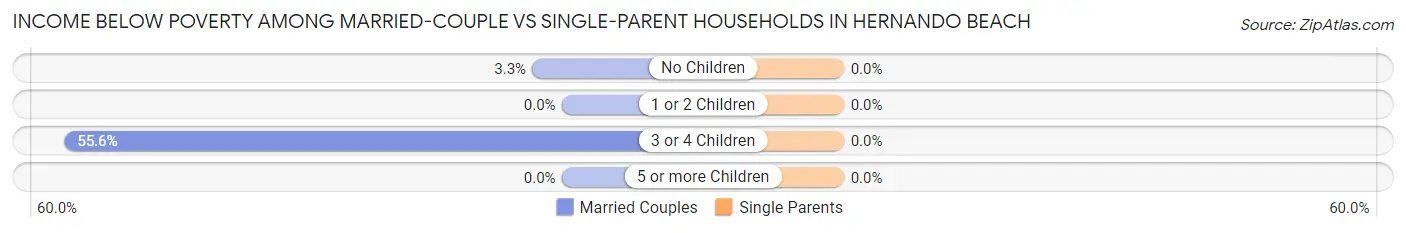
| Children | Married-Couple Families | Single-Parent Households |
| No Children | 25 (3.3%) | 0 (0.0%) |
| 1 or 2 Children | 0 (0.0%) | 0 (0.0%) |
| 3 or 4 Children | 5 (55.6%) | 0 (0.0%) |
| 5 or more Children | 0 (0.0%) | 0 (0.0%) |
| Total | 30 (3.6%) | 0 (0.0%) |
Race in Hernando Beach
The most populous races in Hernando Beach are White / Caucasian (2,394 | 93.6%), Hispanic or Latino (133 | 5.2%), and Two or more Races (90 | 3.5%).
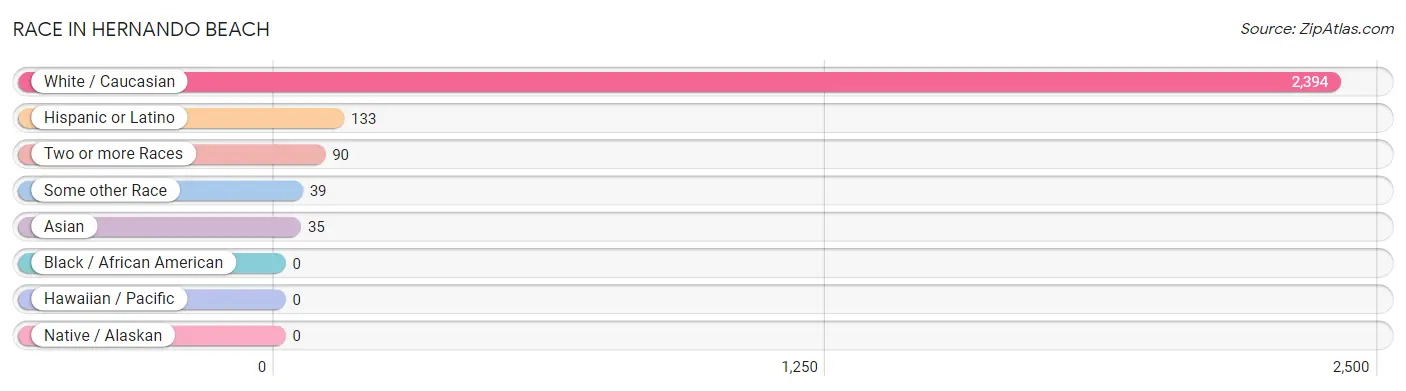
| Race | # Population | % Population |
| Asian | 35 | 1.4% |
| Black / African American | 0 | 0.0% |
| Hawaiian / Pacific | 0 | 0.0% |
| Hispanic or Latino | 133 | 5.2% |
| Native / Alaskan | 0 | 0.0% |
| White / Caucasian | 2,394 | 93.6% |
| Two or more Races | 90 | 3.5% |
| Some other Race | 39 | 1.5% |
| Total | 2,558 | 100.0% |
Ancestry in Hernando Beach
The most populous ancestries reported in Hernando Beach are Irish (595 | 23.3%), English (493 | 19.3%), German (386 | 15.1%), Italian (263 | 10.3%), and American (195 | 7.6%), together accounting for 75.5% of all Hernando Beach residents.
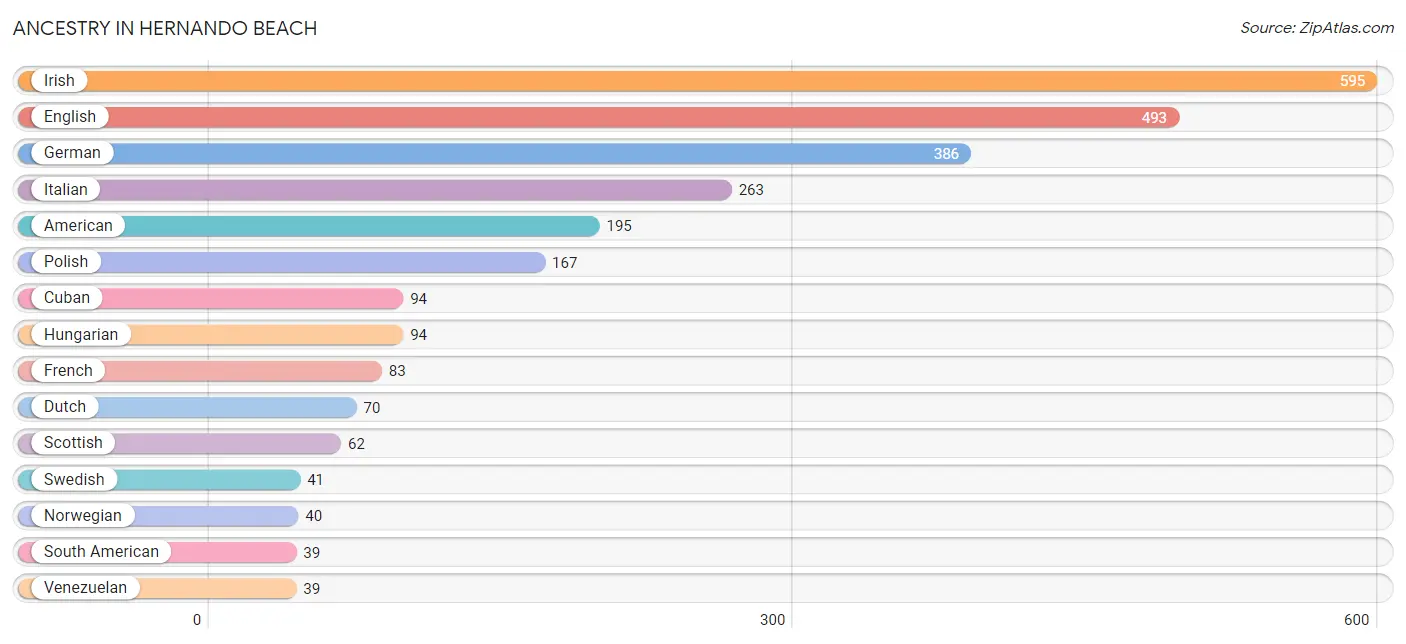
| Ancestry | # Population | % Population |
| Aleut | 10 | 0.4% |
| American | 195 | 7.6% |
| Apache | 28 | 1.1% |
| Austrian | 12 | 0.5% |
| British | 22 | 0.9% |
| Burmese | 35 | 1.4% |
| Canadian | 16 | 0.6% |
| Choctaw | 6 | 0.2% |
| Cuban | 94 | 3.7% |
| Danish | 9 | 0.4% |
| Dutch | 70 | 2.7% |
| English | 493 | 19.3% |
| French | 83 | 3.2% |
| French American Indian | 5 | 0.2% |
| French Canadian | 32 | 1.3% |
| German | 386 | 15.1% |
| Greek | 13 | 0.5% |
| Hungarian | 94 | 3.7% |
| Irish | 595 | 23.3% |
| Italian | 263 | 10.3% |
| Norwegian | 40 | 1.6% |
| Polish | 167 | 6.5% |
| Russian | 10 | 0.4% |
| Scotch-Irish | 9 | 0.4% |
| Scottish | 62 | 2.4% |
| Slovak | 26 | 1.0% |
| Slovene | 14 | 0.5% |
| South American | 39 | 1.5% |
| Swedish | 41 | 1.6% |
| Swiss | 31 | 1.2% |
| Venezuelan | 39 | 1.5% |
| Welsh | 22 | 0.9% | View All 32 Rows |
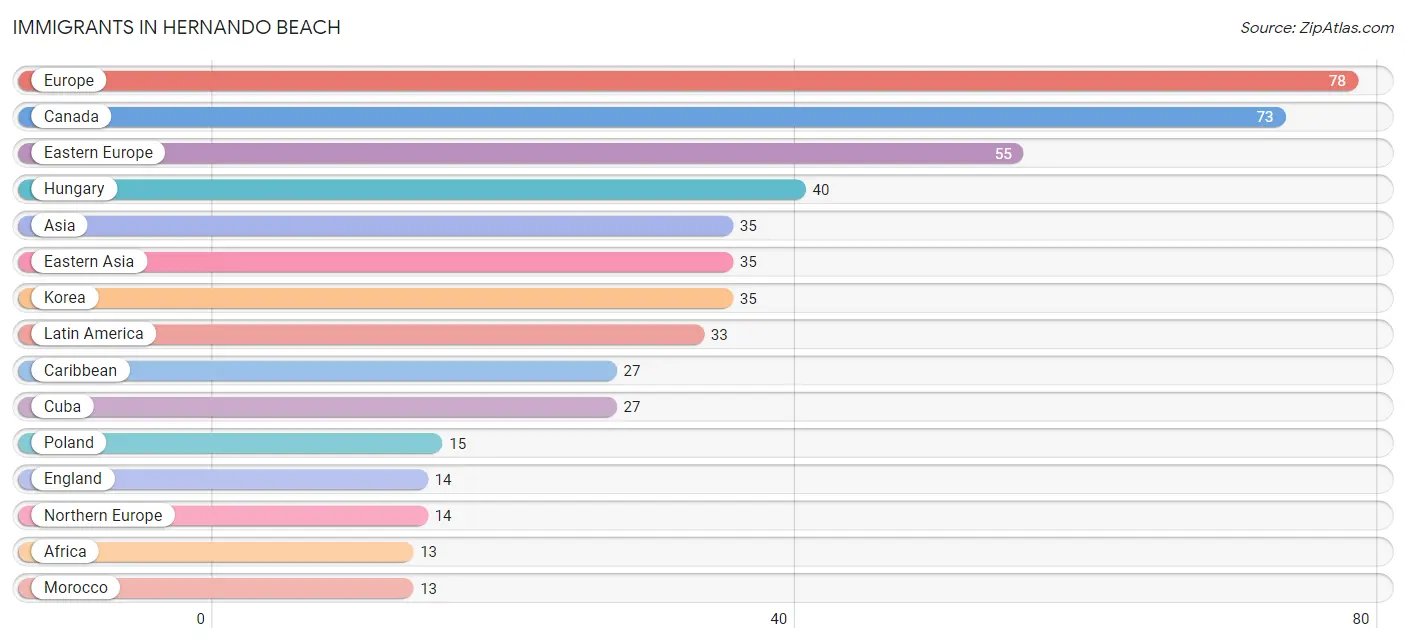
Immigrants in Hernando Beach
The most numerous immigrant groups reported in Hernando Beach came from Europe (78 | 3.0%), Canada (73 | 2.9%), Eastern Europe (55 | 2.1%), Hungary (40 | 1.6%), and Asia (35 | 1.4%), together accounting for 11.0% of all Hernando Beach residents.
| Immigration Origin | # Population | % Population |
| Africa | 13 | 0.5% |
| Asia | 35 | 1.4% |
| Canada | 73 | 2.9% |
| Caribbean | 27 | 1.1% |
| Cuba | 27 | 1.1% |
| Eastern Asia | 35 | 1.4% |
| Eastern Europe | 55 | 2.1% |
| England | 14 | 0.5% |
| Europe | 78 | 3.0% |
| Germany | 9 | 0.4% |
| Hungary | 40 | 1.6% |
| Korea | 35 | 1.4% |
| Latin America | 33 | 1.3% |
| Morocco | 13 | 0.5% |
| Northern Africa | 13 | 0.5% |
| Northern Europe | 14 | 0.5% |
| Poland | 15 | 0.6% |
| South America | 6 | 0.2% |
| Venezuela | 6 | 0.2% |
| Western Europe | 9 | 0.4% | View All 20 Rows |
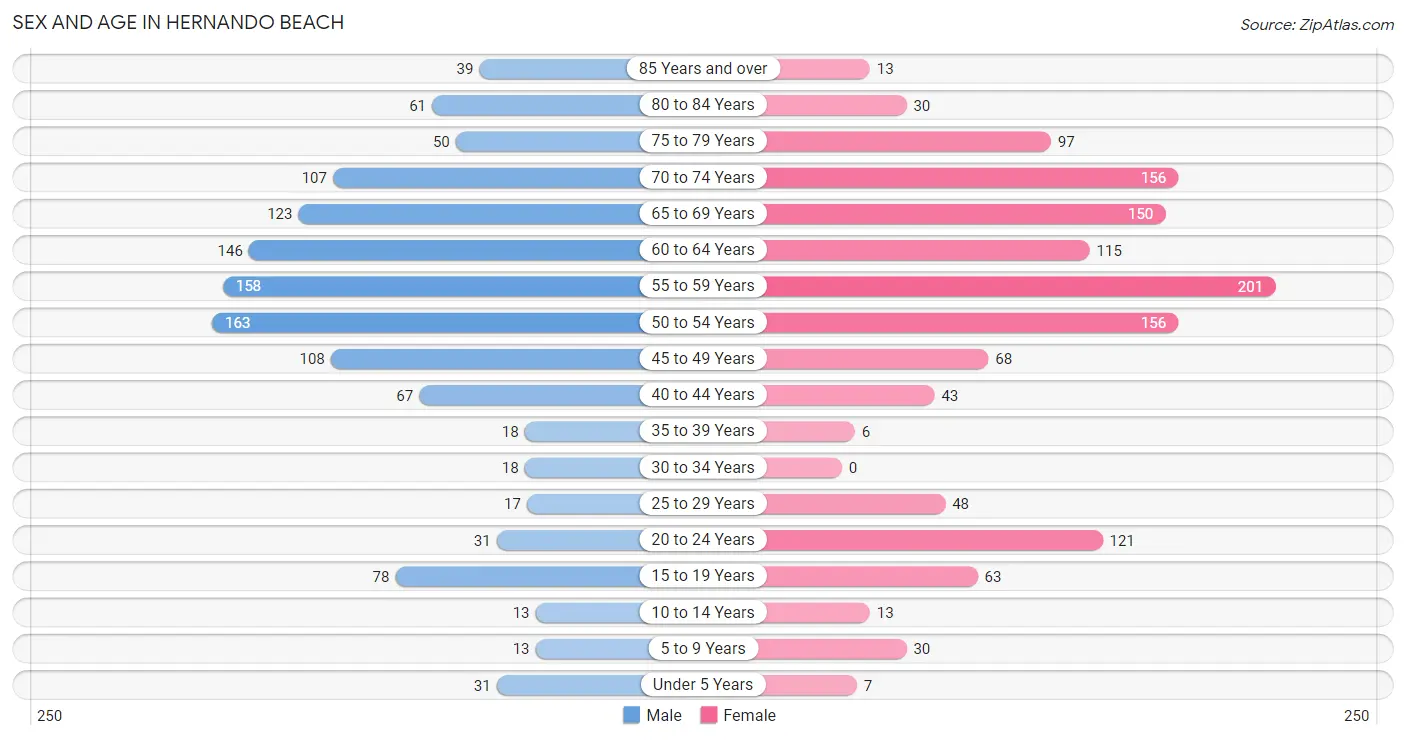
Sex and Age in Hernando Beach
Sex and Age in Hernando Beach
The most populous age groups in Hernando Beach are 50 to 54 Years (163 | 13.1%) for men and 55 to 59 Years (201 | 15.3%) for women.
| Age Bracket | Male | Female |
| Under 5 Years | 31 (2.5%) | 7 (0.5%) |
| 5 to 9 Years | 13 (1.1%) | 30 (2.3%) |
| 10 to 14 Years | 13 (1.1%) | 13 (1.0%) |
| 15 to 19 Years | 78 (6.3%) | 63 (4.8%) |
| 20 to 24 Years | 31 (2.5%) | 121 (9.2%) |
| 25 to 29 Years | 17 (1.4%) | 48 (3.6%) |
| 30 to 34 Years | 18 (1.5%) | 0 (0.0%) |
| 35 to 39 Years | 18 (1.5%) | 6 (0.5%) |
| 40 to 44 Years | 67 (5.4%) | 43 (3.3%) |
| 45 to 49 Years | 108 (8.7%) | 68 (5.2%) |
| 50 to 54 Years | 163 (13.1%) | 156 (11.8%) |
| 55 to 59 Years | 158 (12.7%) | 201 (15.3%) |
| 60 to 64 Years | 146 (11.8%) | 115 (8.7%) |
| 65 to 69 Years | 123 (9.9%) | 150 (11.4%) |
| 70 to 74 Years | 107 (8.6%) | 156 (11.8%) |
| 75 to 79 Years | 50 (4.0%) | 97 (7.4%) |
| 80 to 84 Years | 61 (4.9%) | 30 (2.3%) |
| 85 Years and over | 39 (3.1%) | 13 (1.0%) |
| Total | 1,241 (100.0%) | 1,317 (100.0%) |
Families and Households in Hernando Beach
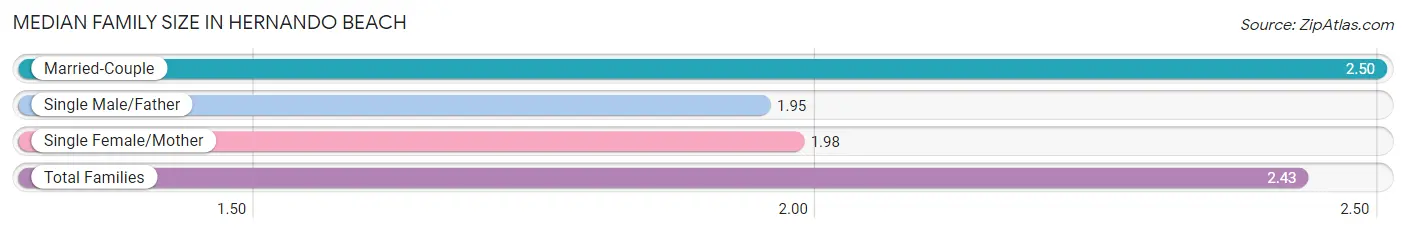
Median Family Size in Hernando Beach
The median family size in Hernando Beach is 2.43 persons per family, with married-couple families (835 | 86.9%) accounting for the largest median family size of 2.5 persons per family. On the other hand, single male/father families (43 | 4.5%) represent the smallest median family size with 1.95 persons per family.
| Family Type | # Families | Family Size |
| Married-Couple | 835 (86.9%) | 2.50 |
| Single Male/Father | 43 (4.5%) | 1.95 |
| Single Female/Mother | 83 (8.6%) | 1.98 |
| Total Families | 961 (100.0%) | 2.43 |
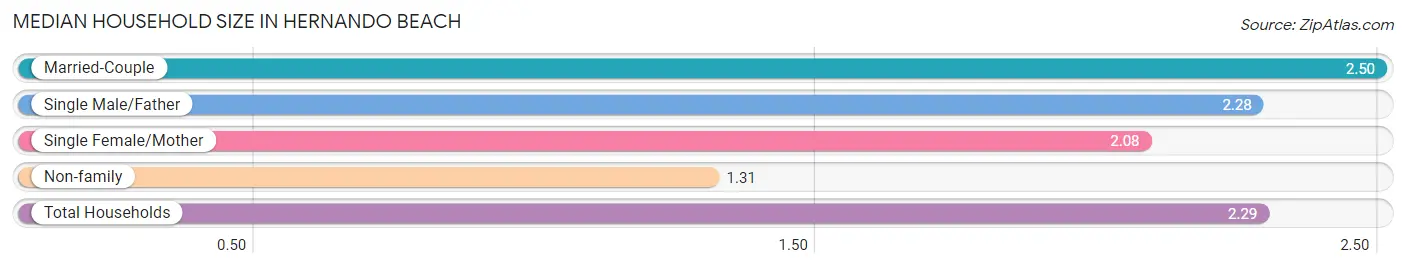
Median Household Size in Hernando Beach
The median household size in Hernando Beach is 2.29 persons per household, with married-couple households (835 | 74.8%) accounting for the largest median household size of 2.5 persons per household. non-family households (155 | 13.9%) represent the smallest median household size with 1.31 persons per household.
| Household Type | # Households | Household Size |
| Married-Couple | 835 (74.8%) | 2.50 |
| Single Male/Father | 43 (3.8%) | 2.28 |
| Single Female/Mother | 83 (7.4%) | 2.08 |
| Non-family | 155 (13.9%) | 1.31 |
| Total Households | 1,116 (100.0%) | 2.29 |
Household Size by Marriage Status in Hernando Beach
Out of a total of 1,116 households in Hernando Beach, 961 (86.1%) are family households, while 155 (13.9%) are nonfamily households. The most numerous type of family households are 2-person households, comprising 656, and the most common type of nonfamily households are 1-person households, comprising 108.
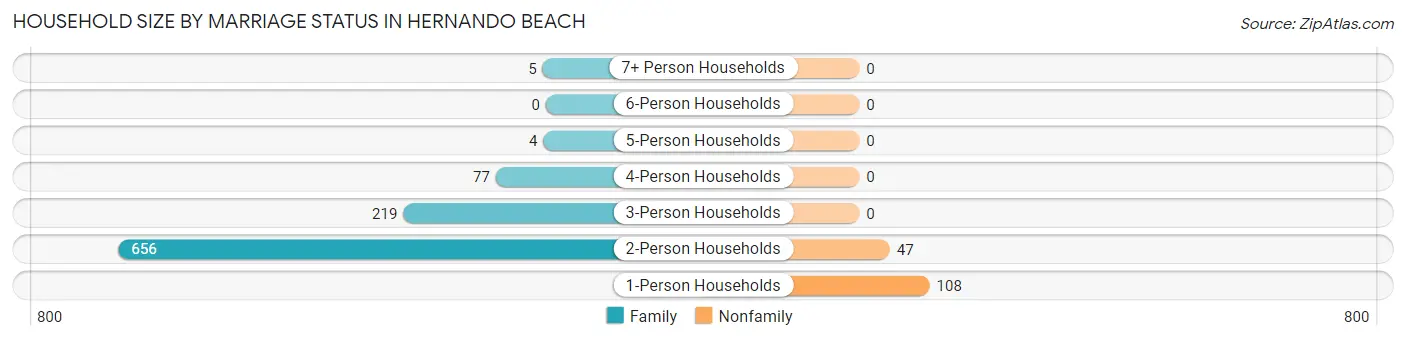
| Household Size | Family Households | Nonfamily Households |
| 1-Person Households | - | 108 (9.7%) |
| 2-Person Households | 656 (58.8%) | 47 (4.2%) |
| 3-Person Households | 219 (19.6%) | 0 (0.0%) |
| 4-Person Households | 77 (6.9%) | 0 (0.0%) |
| 5-Person Households | 4 (0.4%) | 0 (0.0%) |
| 6-Person Households | 0 (0.0%) | 0 (0.0%) |
| 7+ Person Households | 5 (0.4%) | 0 (0.0%) |
| Total | 961 (86.1%) | 155 (13.9%) |
Female Fertility in Hernando Beach
Fertility by Age in Hernando Beach
Average fertility rate in Hernando Beach is 48.0 births per 1,000 women. Women in the age bracket of 20 to 34 years have the highest fertility rate with 107.0 births per 1,000 women. Women in the age bracket of 20 to 34 years acount for 100.0% of all women with births.
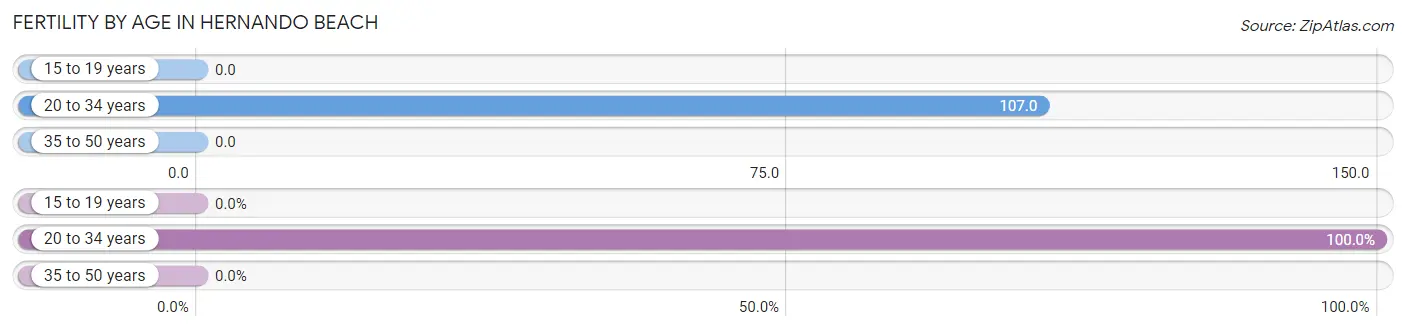
| Age Bracket | Women with Births | Births / 1,000 Women |
| 15 to 19 years | 0 (0.0%) | 0.0 |
| 20 to 34 years | 18 (100.0%) | 107.0 |
| 35 to 50 years | 0 (0.0%) | 0.0 |
| Total | 18 (100.0%) | 48.0 |
Fertility by Age by Marriage Status in Hernando Beach
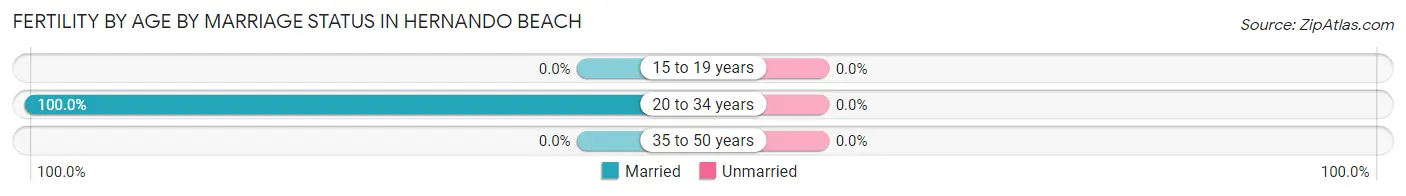
| Age Bracket | Married | Unmarried |
| 15 to 19 years | 0 (0.0%) | 0 (0.0%) |
| 20 to 34 years | 18 (100.0%) | 0 (0.0%) |
| 35 to 50 years | 0 (0.0%) | 0 (0.0%) |
| Total | 18 (100.0%) | 0 (0.0%) |
Fertility by Education in Hernando Beach
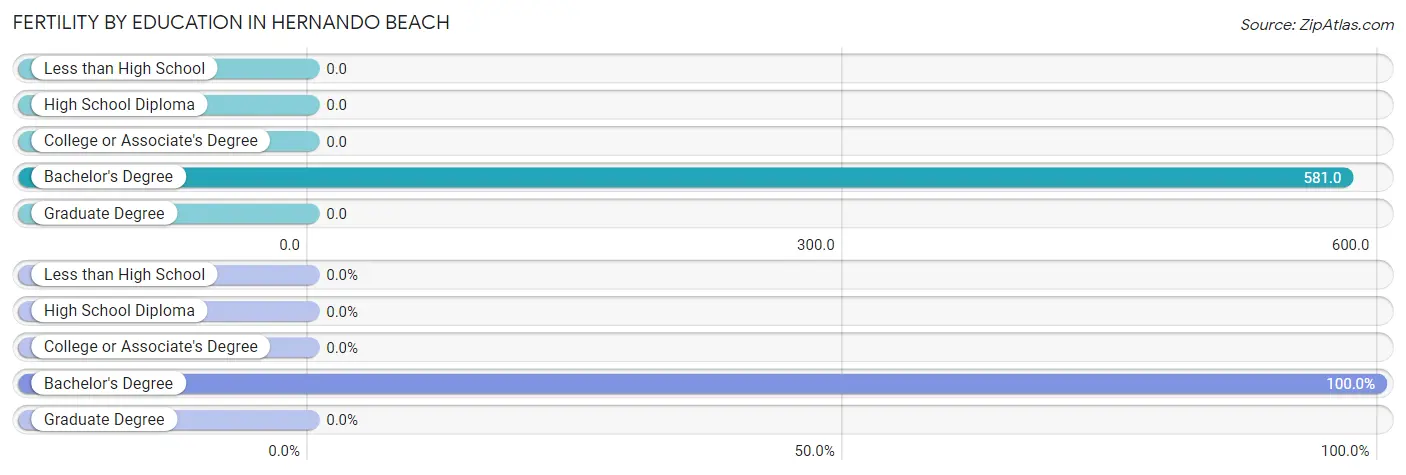
| Educational Attainment | Women with Births | Births / 1,000 Women |
| Less than High School | 0 (0.0%) | 0.0 |
| High School Diploma | 0 (0.0%) | 0.0 |
| College or Associate's Degree | 0 (0.0%) | 0.0 |
| Bachelor's Degree | 18 (100.0%) | 581.0 |
| Graduate Degree | 0 (0.0%) | 0.0 |
| Total | 18 (100.0%) | 48.0 |
Fertility by Education by Marriage Status in Hernando Beach
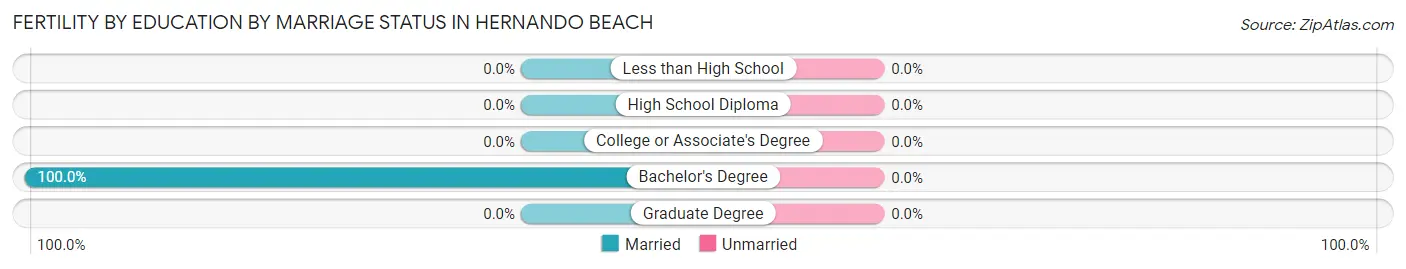
| Educational Attainment | Married | Unmarried |
| Less than High School | 0 (0.0%) | 0 (0.0%) |
| High School Diploma | 0 (0.0%) | 0 (0.0%) |
| College or Associate's Degree | 0 (0.0%) | 0 (0.0%) |
| Bachelor's Degree | 18 (100.0%) | 0 (0.0%) |
| Graduate Degree | 0 (0.0%) | 0 (0.0%) |
| Total | 18 (100.0%) | 0 (0.0%) |
Employment Characteristics in Hernando Beach
Employment by Class of Employer in Hernando Beach
Among the 1,313 employed individuals in Hernando Beach, private company employees (965 | 73.5%), local government employees (115 | 8.8%), and self-employed (incorporated) (96 | 7.3%) make up the most common classes of employment.
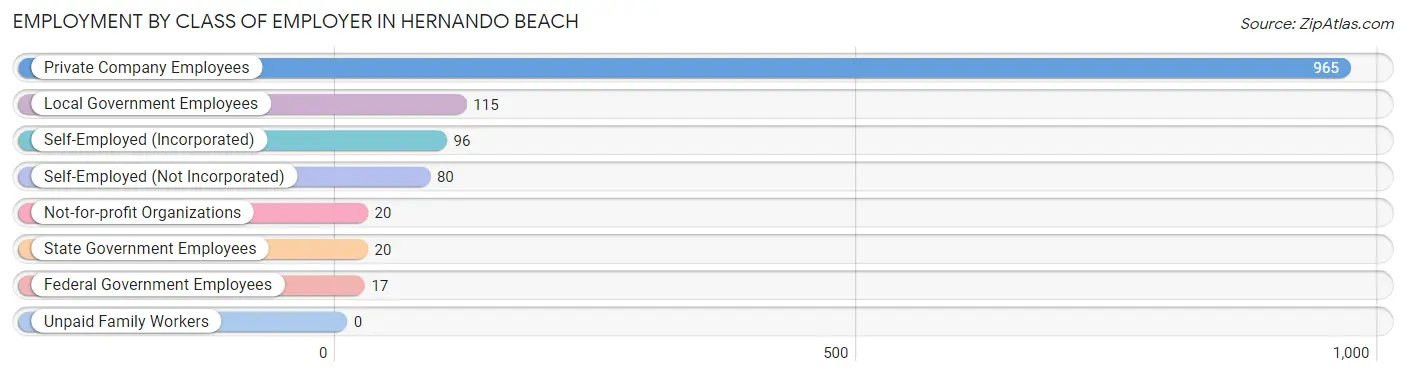
| Employer Class | # Employees | % Employees |
| Private Company Employees | 965 | 73.5% |
| Self-Employed (Incorporated) | 96 | 7.3% |
| Self-Employed (Not Incorporated) | 80 | 6.1% |
| Not-for-profit Organizations | 20 | 1.5% |
| Local Government Employees | 115 | 8.8% |
| State Government Employees | 20 | 1.5% |
| Federal Government Employees | 17 | 1.3% |
| Unpaid Family Workers | 0 | 0.0% |
| Total | 1,313 | 100.0% |
Employment Status by Age in Hernando Beach
According to the labor force statistics for Hernando Beach, out of the total population over 16 years of age (2,431), 58.2% or 1,415 individuals are in the labor force, with 4.9% or 69 of them unemployed. The age group with the highest labor force participation rate is 20 to 24 years, with 100.0% or 152 individuals in the labor force. Within the labor force, the 20 to 24 years age range has the highest percentage of unemployed individuals, with 28.9% or 44 of them being unemployed.
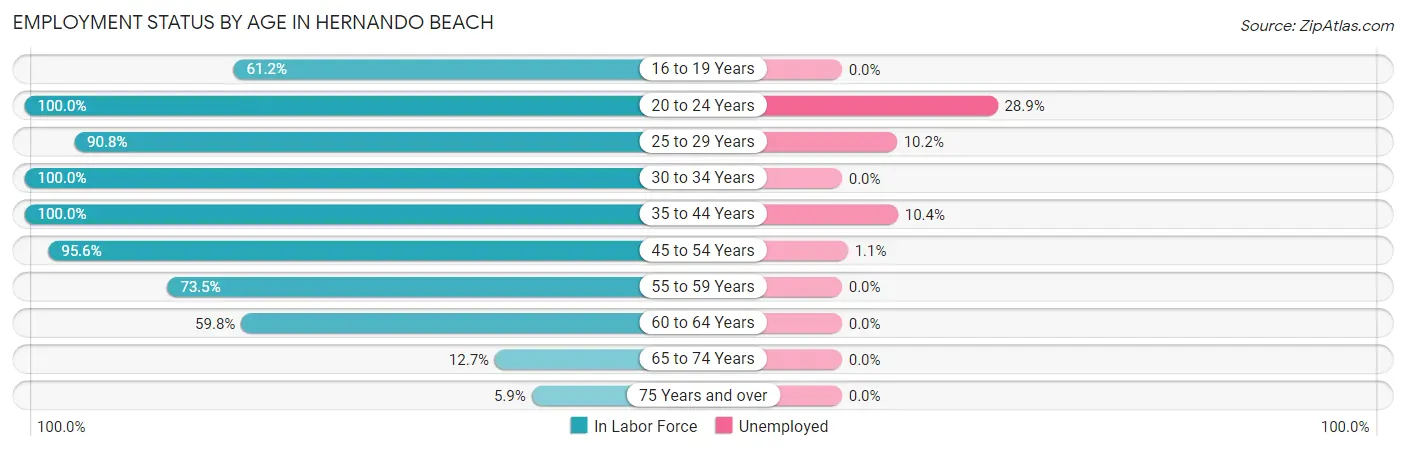
| Age Bracket | In Labor Force | Unemployed |
| 16 to 19 Years | 74 (61.2%) | 0 (0.0%) |
| 20 to 24 Years | 152 (100.0%) | 44 (28.9%) |
| 25 to 29 Years | 59 (90.8%) | 6 (10.2%) |
| 30 to 34 Years | 18 (100.0%) | 0 (0.0%) |
| 35 to 44 Years | 134 (100.0%) | 14 (10.4%) |
| 45 to 54 Years | 473 (95.6%) | 5 (1.1%) |
| 55 to 59 Years | 264 (73.5%) | 0 (0.0%) |
| 60 to 64 Years | 156 (59.8%) | 0 (0.0%) |
| 65 to 74 Years | 68 (12.7%) | 0 (0.0%) |
| 75 Years and over | 17 (5.9%) | 0 (0.0%) |
| Total | 1,415 (58.2%) | 69 (4.9%) |
Employment Status by Educational Attainment in Hernando Beach
According to labor force statistics for Hernando Beach, 82.9% of individuals (1,104) out of the total population between 25 and 64 years of age (1,332) are in the labor force, with 2.3% or 25 of them being unemployed. The group with the highest labor force participation rate are those with the educational attainment of high school diploma, with 85.1% or 222 individuals in the labor force. Within the labor force, individuals with college / associate degree education have the highest percentage of unemployment, with 3.4% or 21 of them being unemployed.
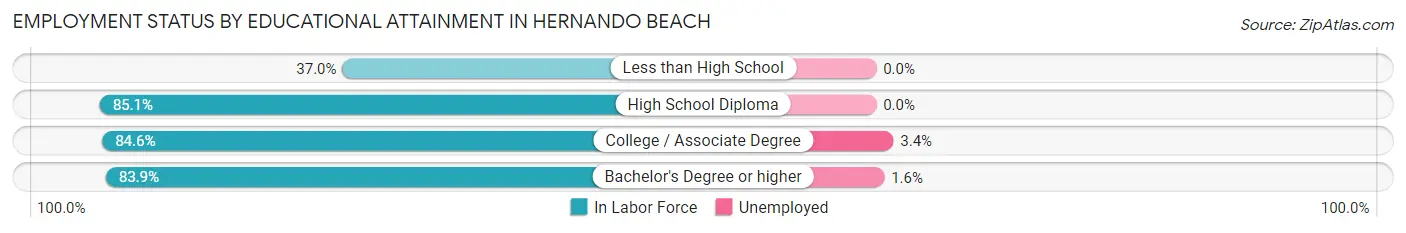
| Educational Attainment | In Labor Force | Unemployed |
| Less than High School | 17 (37.0%) | 0 (0.0%) |
| High School Diploma | 222 (85.1%) | 0 (0.0%) |
| College / Associate Degree | 614 (84.6%) | 25 (3.4%) |
| Bachelor's Degree or higher | 251 (83.9%) | 5 (1.6%) |
| Total | 1,104 (82.9%) | 31 (2.3%) |
Employment Occupations by Sex in Hernando Beach
Management, Business, Science and Arts Occupations
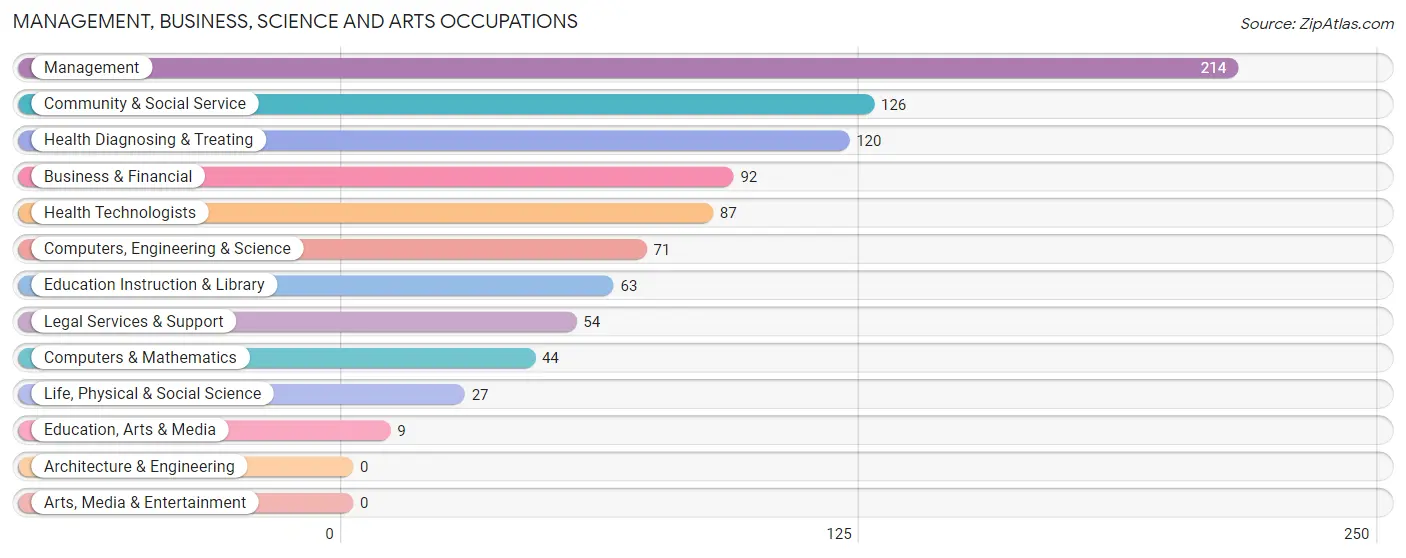
The most common Management, Business, Science and Arts occupations in Hernando Beach are Management (214 | 15.9%), Community & Social Service (126 | 9.4%), Health Diagnosing & Treating (120 | 8.9%), Business & Financial (92 | 6.8%), and Health Technologists (87 | 6.5%).
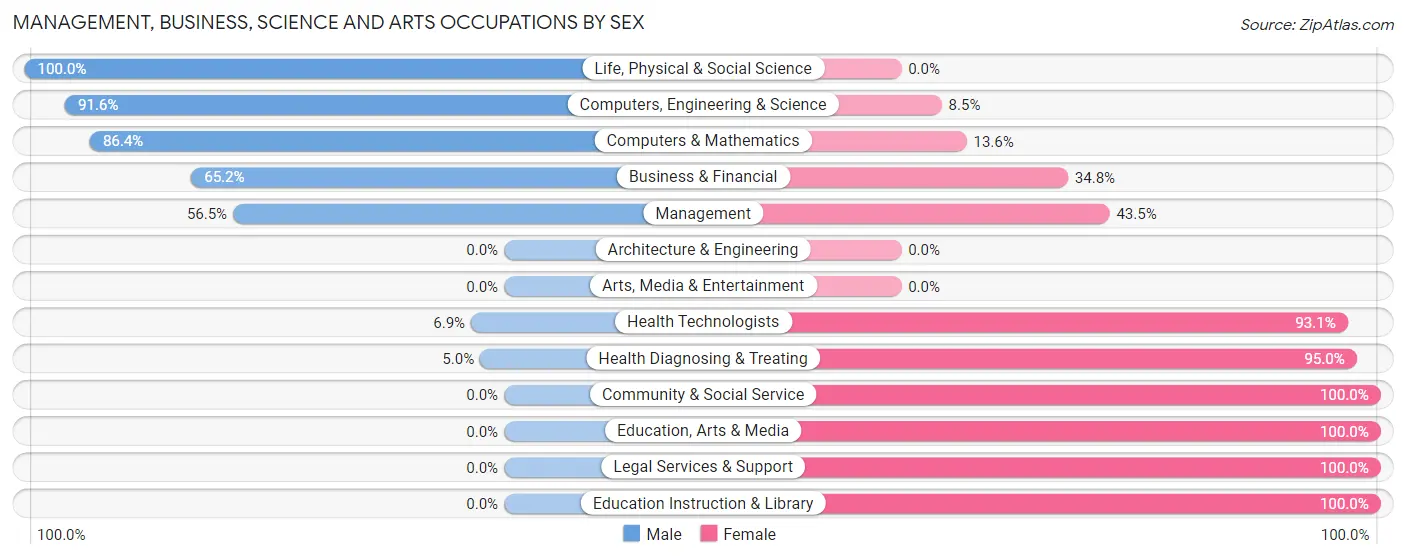
Management, Business, Science and Arts Occupations by Sex
Within the Management, Business, Science and Arts occupations in Hernando Beach, the most male-oriented occupations are Life, Physical & Social Science (100.0%), Computers, Engineering & Science (91.5%), and Computers & Mathematics (86.4%), while the most female-oriented occupations are Community & Social Service (100.0%), Education, Arts & Media (100.0%), and Legal Services & Support (100.0%).
| Occupation | Male | Female |
| Management | 121 (56.5%) | 93 (43.5%) |
| Business & Financial | 60 (65.2%) | 32 (34.8%) |
| Computers, Engineering & Science | 65 (91.5%) | 6 (8.5%) |
| Computers & Mathematics | 38 (86.4%) | 6 (13.6%) |
| Architecture & Engineering | 0 (0.0%) | 0 (0.0%) |
| Life, Physical & Social Science | 27 (100.0%) | 0 (0.0%) |
| Community & Social Service | 0 (0.0%) | 126 (100.0%) |
| Education, Arts & Media | 0 (0.0%) | 9 (100.0%) |
| Legal Services & Support | 0 (0.0%) | 54 (100.0%) |
| Education Instruction & Library | 0 (0.0%) | 63 (100.0%) |
| Arts, Media & Entertainment | 0 (0.0%) | 0 (0.0%) |
| Health Diagnosing & Treating | 6 (5.0%) | 114 (95.0%) |
| Health Technologists | 6 (6.9%) | 81 (93.1%) |
| Total (Category) | 252 (40.5%) | 371 (59.6%) |
| Total (Overall) | 673 (50.0%) | 673 (50.0%) |
Services Occupations
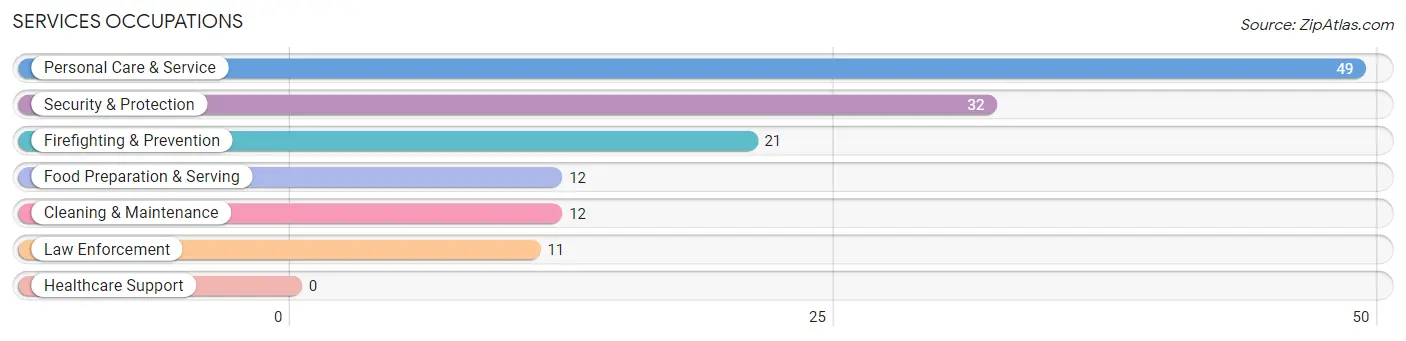
The most common Services occupations in Hernando Beach are Personal Care & Service (49 | 3.6%), Security & Protection (32 | 2.4%), Firefighting & Prevention (21 | 1.6%), Food Preparation & Serving (12 | 0.9%), and Cleaning & Maintenance (12 | 0.9%).
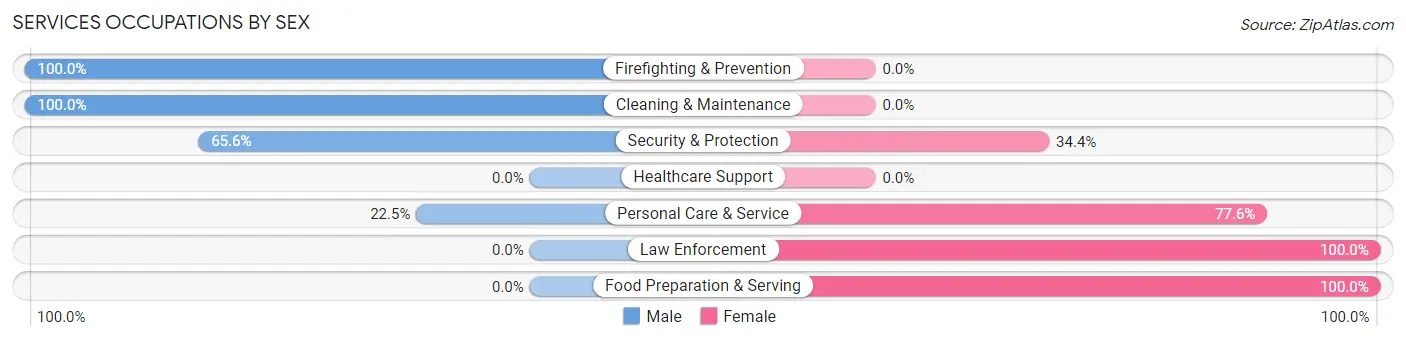
Services Occupations by Sex
Within the Services occupations in Hernando Beach, the most male-oriented occupations are Firefighting & Prevention (100.0%), Cleaning & Maintenance (100.0%), and Security & Protection (65.6%), while the most female-oriented occupations are Law Enforcement (100.0%), Food Preparation & Serving (100.0%), and Personal Care & Service (77.5%).
| Occupation | Male | Female |
| Healthcare Support | 0 (0.0%) | 0 (0.0%) |
| Security & Protection | 21 (65.6%) | 11 (34.4%) |
| Firefighting & Prevention | 21 (100.0%) | 0 (0.0%) |
| Law Enforcement | 0 (0.0%) | 11 (100.0%) |
| Food Preparation & Serving | 0 (0.0%) | 12 (100.0%) |
| Cleaning & Maintenance | 12 (100.0%) | 0 (0.0%) |
| Personal Care & Service | 11 (22.5%) | 38 (77.5%) |
| Total (Category) | 44 (41.9%) | 61 (58.1%) |
| Total (Overall) | 673 (50.0%) | 673 (50.0%) |
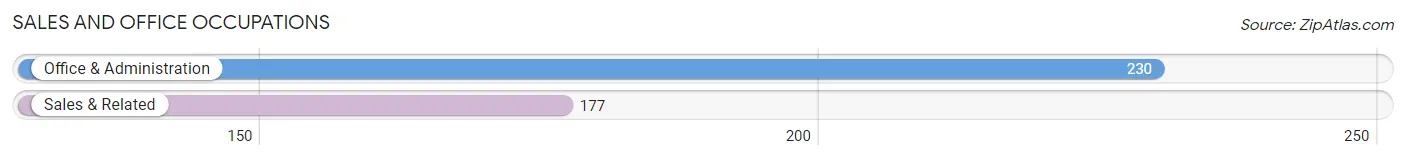
Sales and Office Occupations
The most common Sales and Office occupations in Hernando Beach are Office & Administration (230 | 17.1%), and Sales & Related (177 | 13.2%).
Sales and Office Occupations by Sex
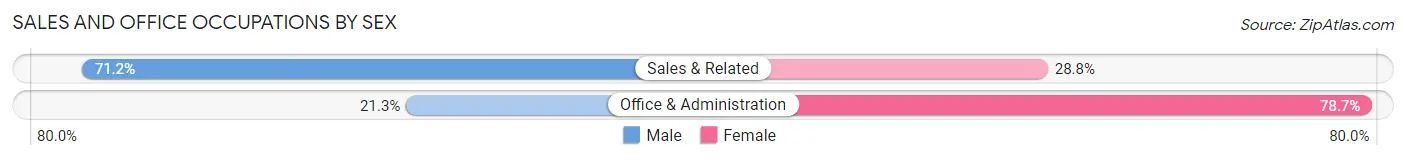
| Occupation | Male | Female |
| Sales & Related | 126 (71.2%) | 51 (28.8%) |
| Office & Administration | 49 (21.3%) | 181 (78.7%) |
| Total (Category) | 175 (43.0%) | 232 (57.0%) |
| Total (Overall) | 673 (50.0%) | 673 (50.0%) |
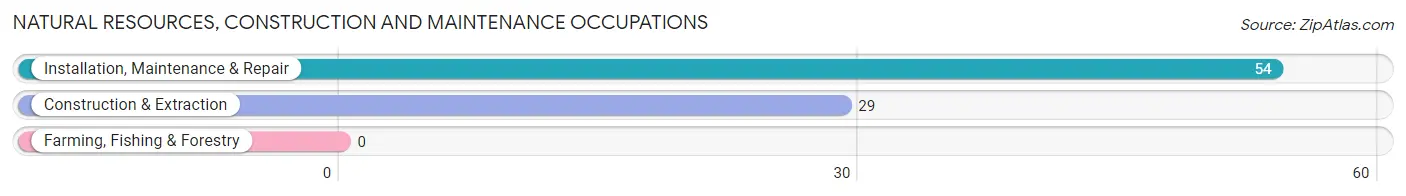
Natural Resources, Construction and Maintenance Occupations
The most common Natural Resources, Construction and Maintenance occupations in Hernando Beach are Installation, Maintenance & Repair (54 | 4.0%), and Construction & Extraction (29 | 2.1%).
Natural Resources, Construction and Maintenance Occupations by Sex
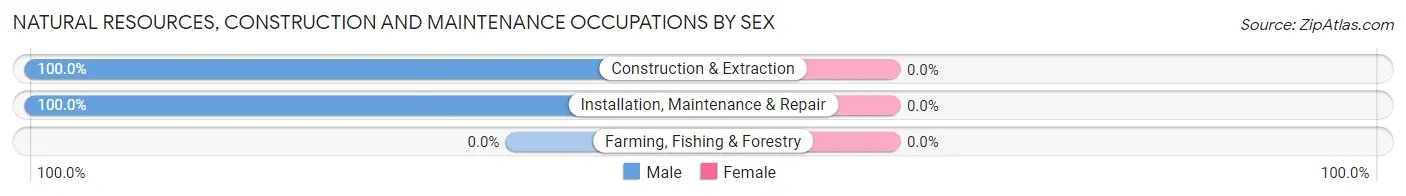
| Occupation | Male | Female |
| Farming, Fishing & Forestry | 0 (0.0%) | 0 (0.0%) |
| Construction & Extraction | 29 (100.0%) | 0 (0.0%) |
| Installation, Maintenance & Repair | 54 (100.0%) | 0 (0.0%) |
| Total (Category) | 83 (100.0%) | 0 (0.0%) |
| Total (Overall) | 673 (50.0%) | 673 (50.0%) |
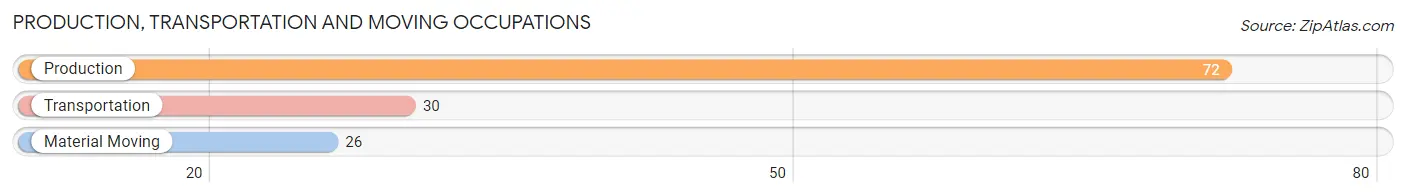
Production, Transportation and Moving Occupations
The most common Production, Transportation and Moving occupations in Hernando Beach are Production (72 | 5.3%), Transportation (30 | 2.2%), and Material Moving (26 | 1.9%).
Production, Transportation and Moving Occupations by Sex
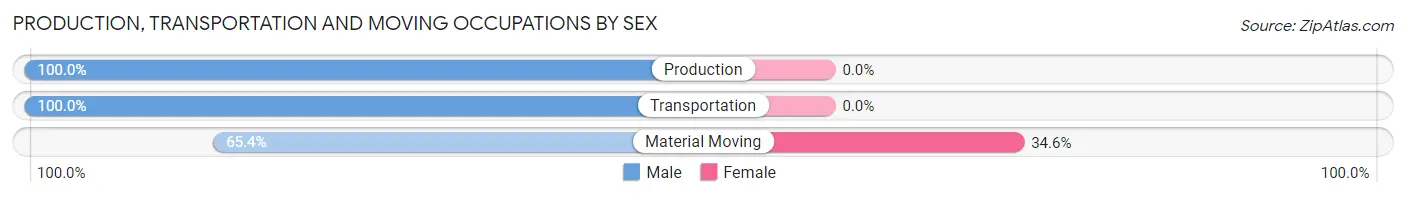
| Occupation | Male | Female |
| Production | 72 (100.0%) | 0 (0.0%) |
| Transportation | 30 (100.0%) | 0 (0.0%) |
| Material Moving | 17 (65.4%) | 9 (34.6%) |
| Total (Category) | 119 (93.0%) | 9 (7.0%) |
| Total (Overall) | 673 (50.0%) | 673 (50.0%) |
Employment Industries by Sex in Hernando Beach
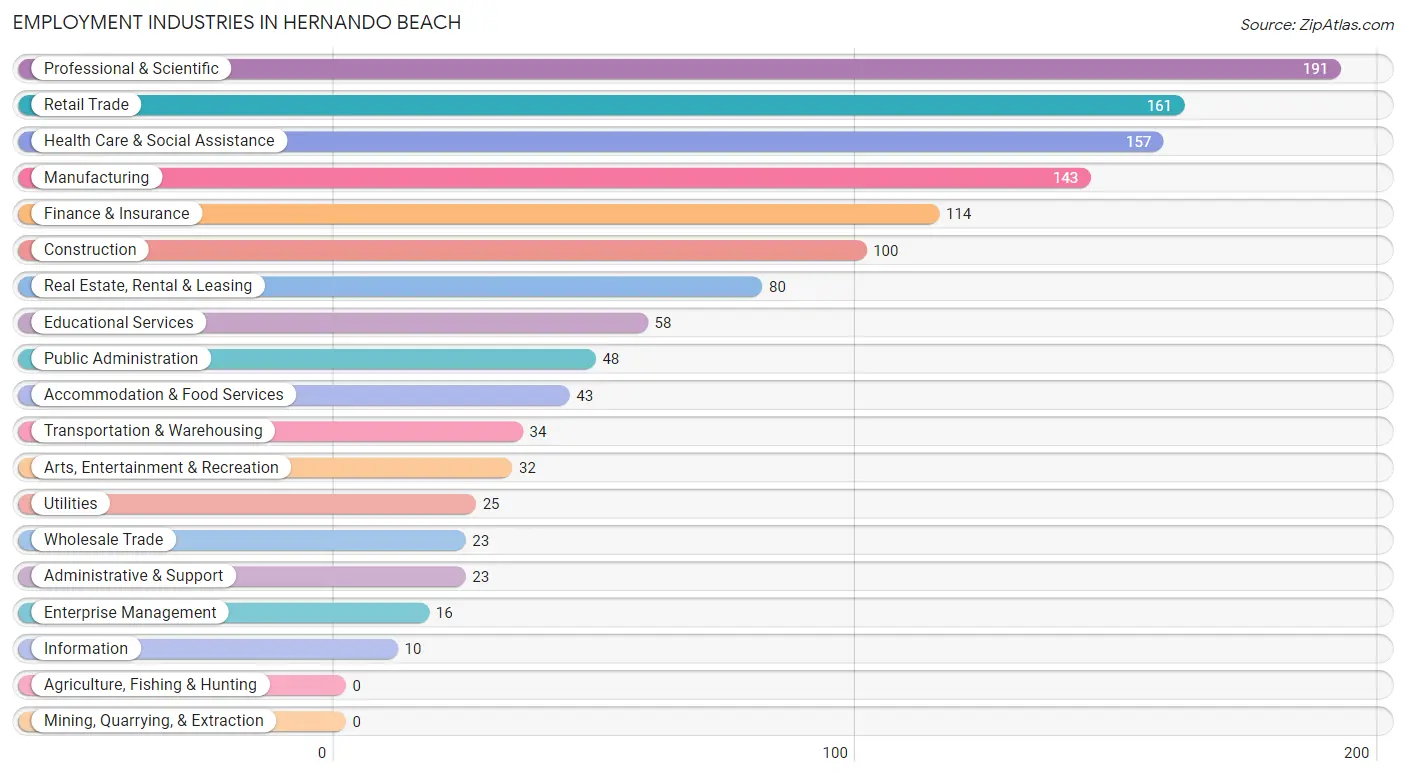
Employment Industries in Hernando Beach
The major employment industries in Hernando Beach include Professional & Scientific (191 | 14.2%), Retail Trade (161 | 12.0%), Health Care & Social Assistance (157 | 11.7%), Manufacturing (143 | 10.6%), and Finance & Insurance (114 | 8.5%).
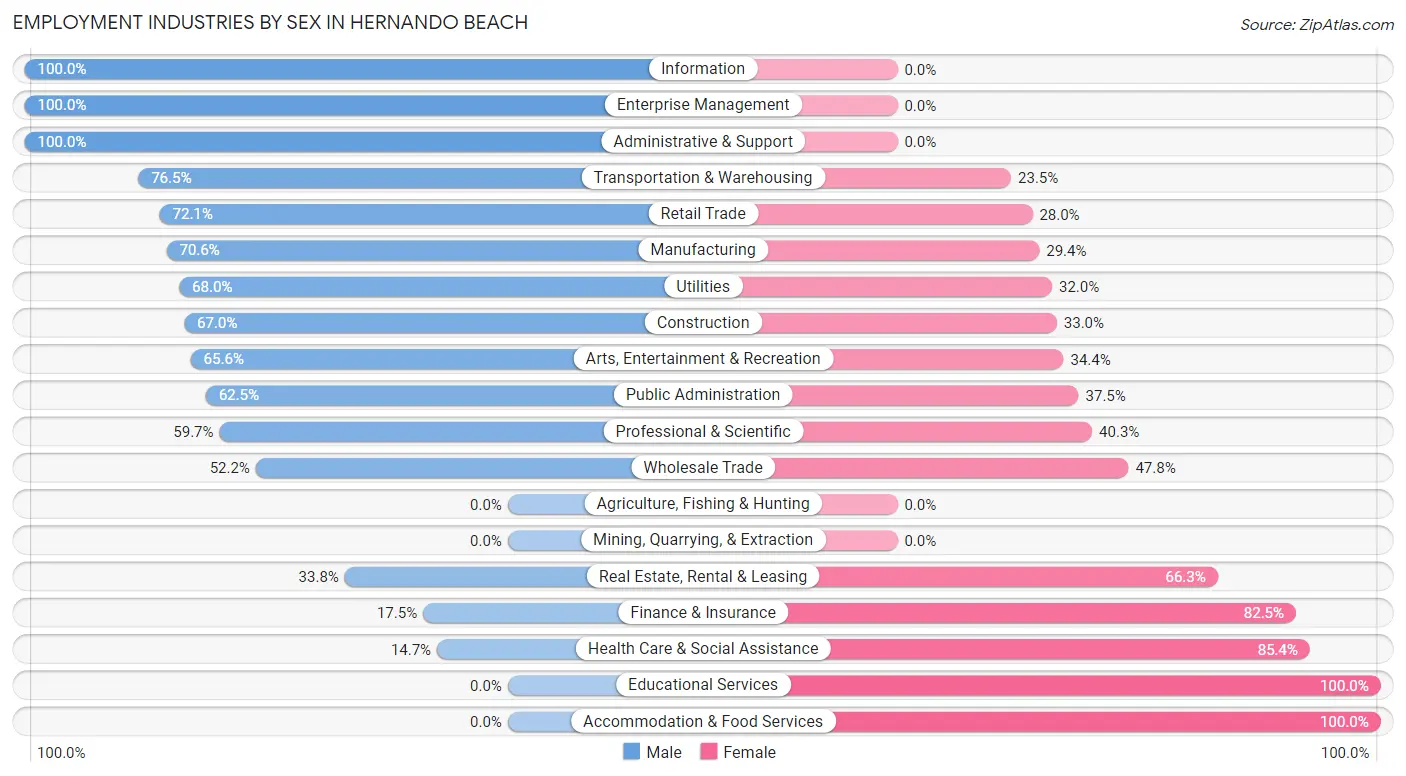
Employment Industries by Sex in Hernando Beach
The Hernando Beach industries that see more men than women are Information (100.0%), Enterprise Management (100.0%), and Administrative & Support (100.0%), whereas the industries that tend to have a higher number of women are Educational Services (100.0%), Accommodation & Food Services (100.0%), and Health Care & Social Assistance (85.4%).
| Industry | Male | Female |
| Agriculture, Fishing & Hunting | 0 (0.0%) | 0 (0.0%) |
| Mining, Quarrying, & Extraction | 0 (0.0%) | 0 (0.0%) |
| Construction | 67 (67.0%) | 33 (33.0%) |
| Manufacturing | 101 (70.6%) | 42 (29.4%) |
| Wholesale Trade | 12 (52.2%) | 11 (47.8%) |
| Retail Trade | 116 (72.1%) | 45 (28.0%) |
| Transportation & Warehousing | 26 (76.5%) | 8 (23.5%) |
| Utilities | 17 (68.0%) | 8 (32.0%) |
| Information | 10 (100.0%) | 0 (0.0%) |
| Finance & Insurance | 20 (17.5%) | 94 (82.5%) |
| Real Estate, Rental & Leasing | 27 (33.8%) | 53 (66.2%) |
| Professional & Scientific | 114 (59.7%) | 77 (40.3%) |
| Enterprise Management | 16 (100.0%) | 0 (0.0%) |
| Administrative & Support | 23 (100.0%) | 0 (0.0%) |
| Educational Services | 0 (0.0%) | 58 (100.0%) |
| Health Care & Social Assistance | 23 (14.6%) | 134 (85.4%) |
| Arts, Entertainment & Recreation | 21 (65.6%) | 11 (34.4%) |
| Accommodation & Food Services | 0 (0.0%) | 43 (100.0%) |
| Public Administration | 30 (62.5%) | 18 (37.5%) |
| Total | 673 (50.0%) | 673 (50.0%) |
Education in Hernando Beach
School Enrollment in Hernando Beach
The most common levels of schooling among the 336 students in Hernando Beach are college / undergraduate (173 | 51.5%), high school (73 | 21.7%), and elementary school (37 | 11.0%).
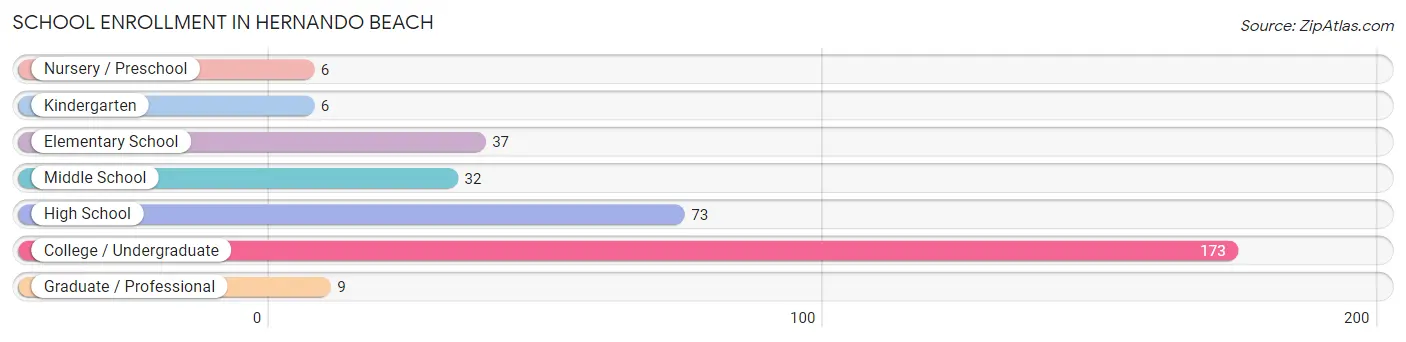
| School Level | # Students | % Students |
| Nursery / Preschool | 6 | 1.8% |
| Kindergarten | 6 | 1.8% |
| Elementary School | 37 | 11.0% |
| Middle School | 32 | 9.5% |
| High School | 73 | 21.7% |
| College / Undergraduate | 173 | 51.5% |
| Graduate / Professional | 9 | 2.7% |
| Total | 336 | 100.0% |
School Enrollment by Age by Funding Source in Hernando Beach
Out of a total of 336 students who are enrolled in schools in Hernando Beach, 16 (4.8%) attend a private institution, while the remaining 320 (95.2%) are enrolled in public schools. The age group of 3 to 4 year olds has the highest likelihood of being enrolled in private schools, with 6 (100.0% in the age bracket) enrolled. Conversely, the age group of 5 to 9 year old has the lowest likelihood of being enrolled in a private school, with 43 (100.0% in the age bracket) attending a public institution.
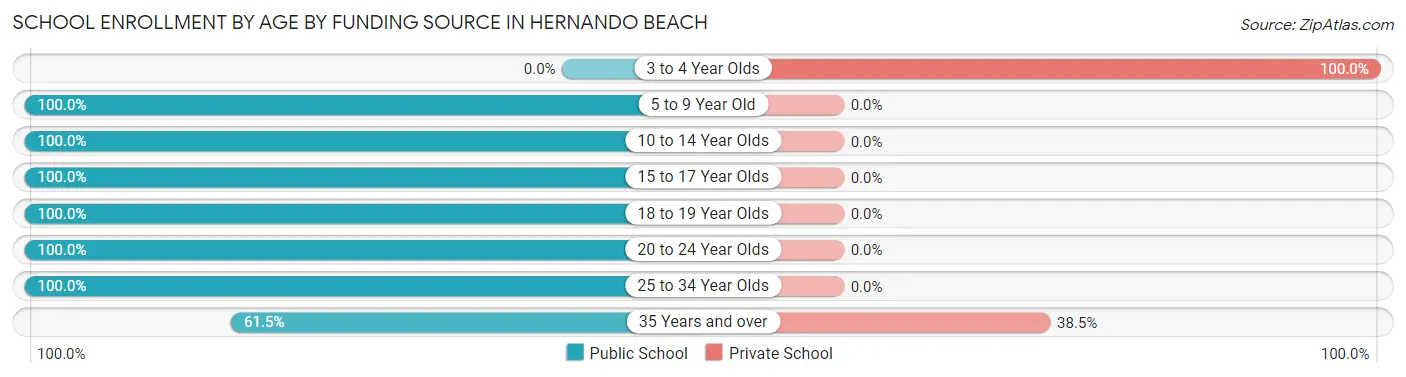
| Age Bracket | Public School | Private School |
| 3 to 4 Year Olds | 0 (0.0%) | 6 (100.0%) |
| 5 to 9 Year Old | 43 (100.0%) | 0 (0.0%) |
| 10 to 14 Year Olds | 26 (100.0%) | 0 (0.0%) |
| 15 to 17 Year Olds | 60 (100.0%) | 0 (0.0%) |
| 18 to 19 Year Olds | 75 (100.0%) | 0 (0.0%) |
| 20 to 24 Year Olds | 64 (100.0%) | 0 (0.0%) |
| 25 to 34 Year Olds | 36 (100.0%) | 0 (0.0%) |
| 35 Years and over | 16 (61.5%) | 10 (38.5%) |
| Total | 320 (95.2%) | 16 (4.8%) |
Educational Attainment by Field of Study in Hernando Beach
Education (112 | 17.9%), science & technology (72 | 11.5%), business (69 | 11.0%), bio, nature & agricultural (59 | 9.4%), and engineering (55 | 8.8%) are the most common fields of study among 626 individuals in Hernando Beach who have obtained a bachelor's degree or higher.
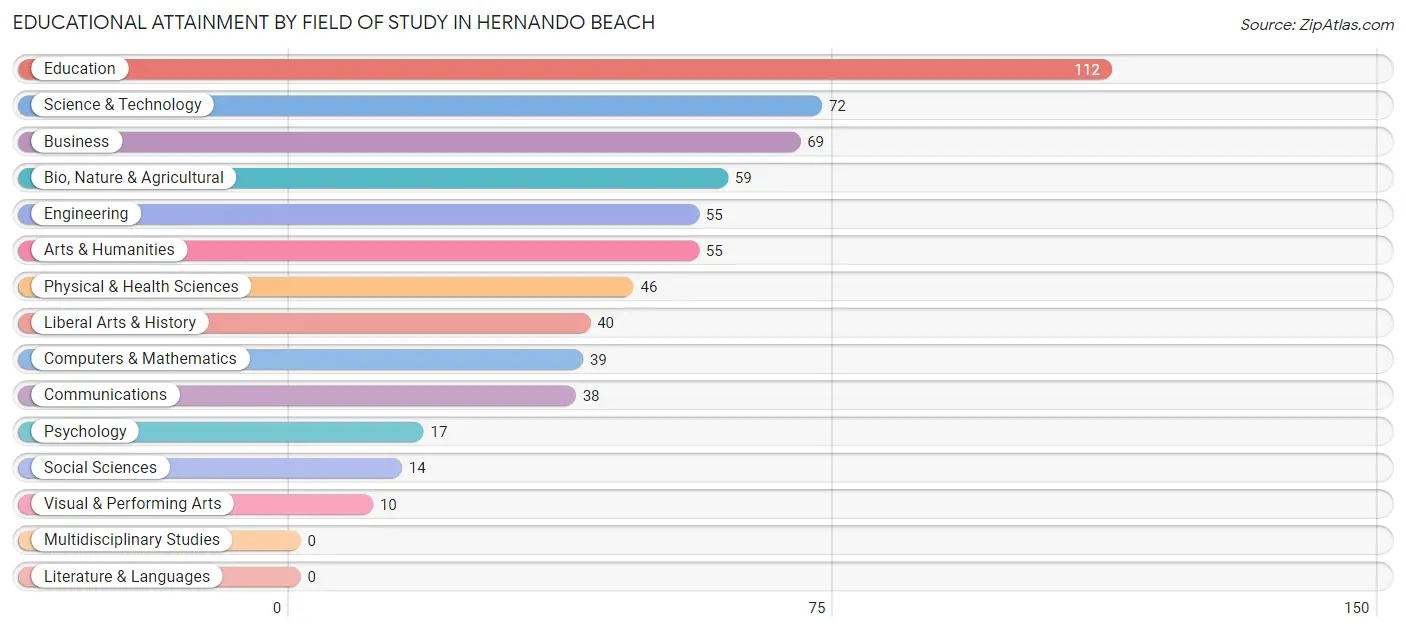
| Field of Study | # Graduates | % Graduates |
| Computers & Mathematics | 39 | 6.2% |
| Bio, Nature & Agricultural | 59 | 9.4% |
| Physical & Health Sciences | 46 | 7.3% |
| Psychology | 17 | 2.7% |
| Social Sciences | 14 | 2.2% |
| Engineering | 55 | 8.8% |
| Multidisciplinary Studies | 0 | 0.0% |
| Science & Technology | 72 | 11.5% |
| Business | 69 | 11.0% |
| Education | 112 | 17.9% |
| Literature & Languages | 0 | 0.0% |
| Liberal Arts & History | 40 | 6.4% |
| Visual & Performing Arts | 10 | 1.6% |
| Communications | 38 | 6.1% |
| Arts & Humanities | 55 | 8.8% |
| Total | 626 | 100.0% |
Transportation & Commute in Hernando Beach
Vehicle Availability by Sex in Hernando Beach
The most prevalent vehicle ownership categories in Hernando Beach are males with 2 vehicles (313, accounting for 46.5%) and females with 2 vehicles (270, making up 48.9%).
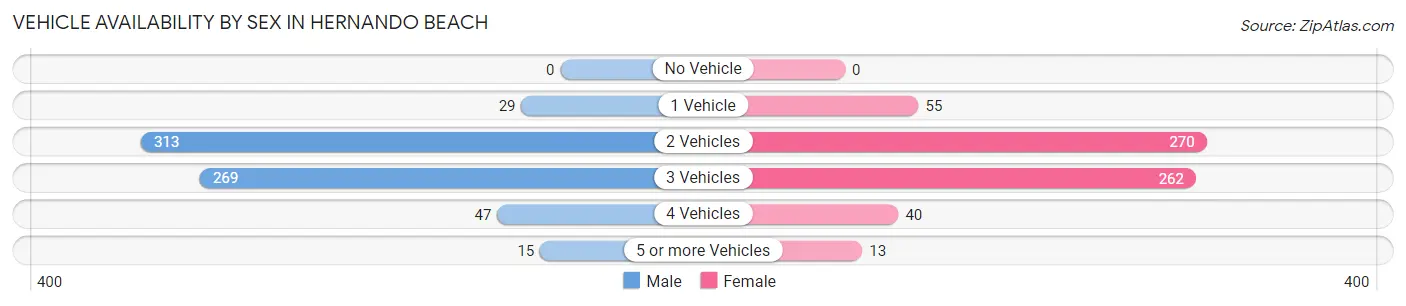
| Vehicles Available | Male | Female |
| No Vehicle | 0 (0.0%) | 0 (0.0%) |
| 1 Vehicle | 29 (4.3%) | 55 (8.6%) |
| 2 Vehicles | 313 (46.5%) | 270 (42.2%) |
| 3 Vehicles | 269 (40.0%) | 262 (40.9%) |
| 4 Vehicles | 47 (7.0%) | 40 (6.2%) |
| 5 or more Vehicles | 15 (2.2%) | 13 (2.0%) |
| Total | 673 (100.0%) | 640 (100.0%) |
Commute Time in Hernando Beach
The most frequently occuring commute durations in Hernando Beach are 20 to 24 minutes (266 commuters, 24.9%), 15 to 19 minutes (214 commuters, 20.1%), and 30 to 34 minutes (152 commuters, 14.2%).
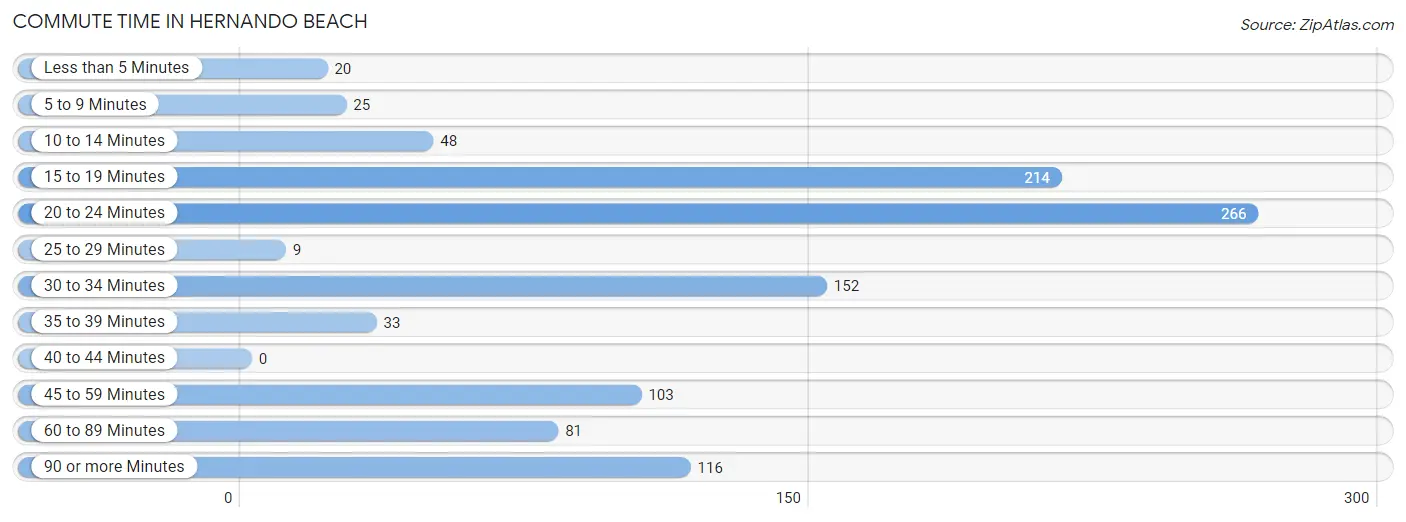
| Commute Time | # Commuters | % Commuters |
| Less than 5 Minutes | 20 | 1.9% |
| 5 to 9 Minutes | 25 | 2.3% |
| 10 to 14 Minutes | 48 | 4.5% |
| 15 to 19 Minutes | 214 | 20.1% |
| 20 to 24 Minutes | 266 | 24.9% |
| 25 to 29 Minutes | 9 | 0.8% |
| 30 to 34 Minutes | 152 | 14.2% |
| 35 to 39 Minutes | 33 | 3.1% |
| 40 to 44 Minutes | 0 | 0.0% |
| 45 to 59 Minutes | 103 | 9.7% |
| 60 to 89 Minutes | 81 | 7.6% |
| 90 or more Minutes | 116 | 10.9% |
Commute Time by Sex in Hernando Beach
The most common commute times in Hernando Beach are 30 to 34 minutes (109 commuters, 21.2%) for males and 20 to 24 minutes (209 commuters, 37.8%) for females.
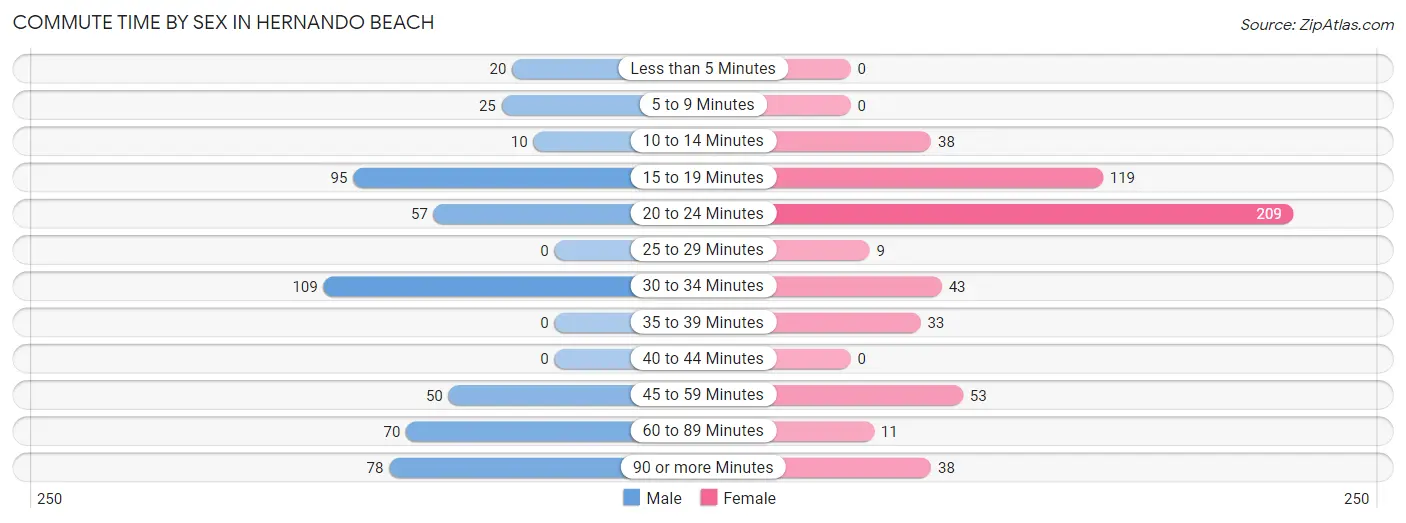
| Commute Time | Male | Female |
| Less than 5 Minutes | 20 (3.9%) | 0 (0.0%) |
| 5 to 9 Minutes | 25 (4.9%) | 0 (0.0%) |
| 10 to 14 Minutes | 10 (1.9%) | 38 (6.9%) |
| 15 to 19 Minutes | 95 (18.5%) | 119 (21.5%) |
| 20 to 24 Minutes | 57 (11.1%) | 209 (37.8%) |
| 25 to 29 Minutes | 0 (0.0%) | 9 (1.6%) |
| 30 to 34 Minutes | 109 (21.2%) | 43 (7.8%) |
| 35 to 39 Minutes | 0 (0.0%) | 33 (6.0%) |
| 40 to 44 Minutes | 0 (0.0%) | 0 (0.0%) |
| 45 to 59 Minutes | 50 (9.7%) | 53 (9.6%) |
| 60 to 89 Minutes | 70 (13.6%) | 11 (2.0%) |
| 90 or more Minutes | 78 (15.2%) | 38 (6.9%) |
Time of Departure to Work by Sex in Hernando Beach
The most frequent times of departure to work in Hernando Beach are 7:00 AM to 7:29 AM (105, 20.4%) for males and 7:00 AM to 7:29 AM (175, 31.7%) for females.
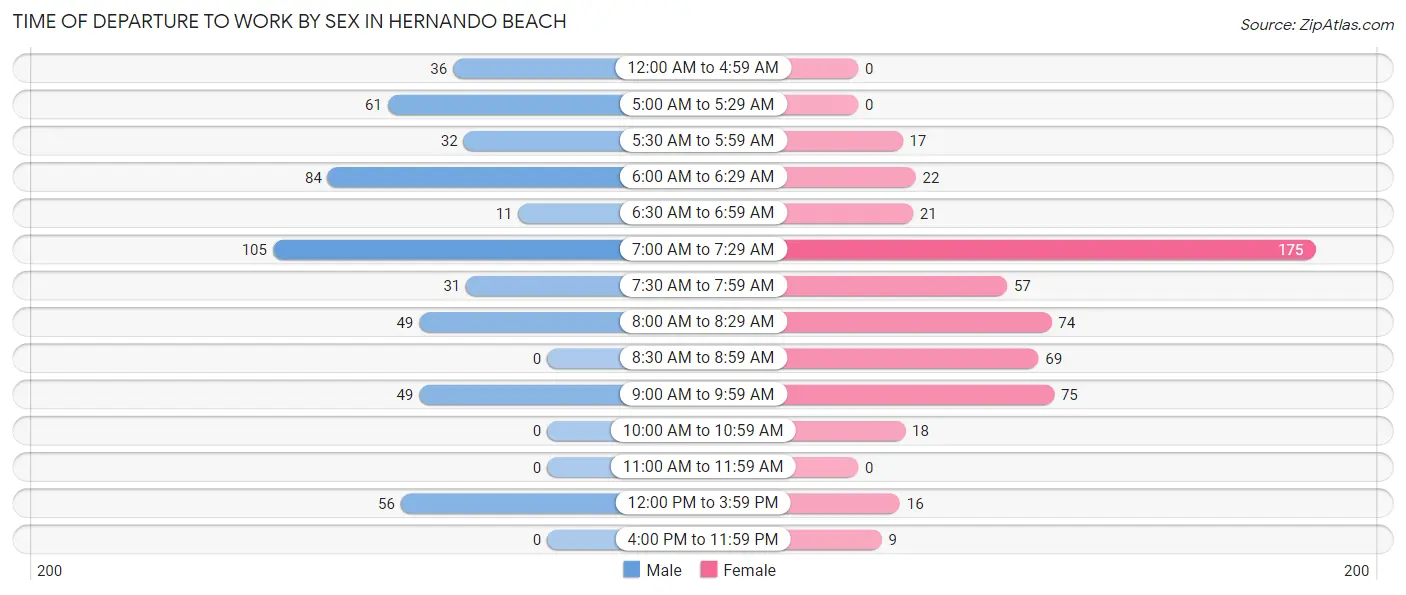
| Time of Departure | Male | Female |
| 12:00 AM to 4:59 AM | 36 (7.0%) | 0 (0.0%) |
| 5:00 AM to 5:29 AM | 61 (11.9%) | 0 (0.0%) |
| 5:30 AM to 5:59 AM | 32 (6.2%) | 17 (3.1%) |
| 6:00 AM to 6:29 AM | 84 (16.3%) | 22 (4.0%) |
| 6:30 AM to 6:59 AM | 11 (2.1%) | 21 (3.8%) |
| 7:00 AM to 7:29 AM | 105 (20.4%) | 175 (31.7%) |
| 7:30 AM to 7:59 AM | 31 (6.0%) | 57 (10.3%) |
| 8:00 AM to 8:29 AM | 49 (9.5%) | 74 (13.4%) |
| 8:30 AM to 8:59 AM | 0 (0.0%) | 69 (12.5%) |
| 9:00 AM to 9:59 AM | 49 (9.5%) | 75 (13.6%) |
| 10:00 AM to 10:59 AM | 0 (0.0%) | 18 (3.3%) |
| 11:00 AM to 11:59 AM | 0 (0.0%) | 0 (0.0%) |
| 12:00 PM to 3:59 PM | 56 (10.9%) | 16 (2.9%) |
| 4:00 PM to 11:59 PM | 0 (0.0%) | 9 (1.6%) |
| Total | 514 (100.0%) | 553 (100.0%) |
Housing Occupancy in Hernando Beach
Occupancy by Ownership in Hernando Beach
Of the total 1,116 dwellings in Hernando Beach, owner-occupied units account for 1,027 (92.0%), while renter-occupied units make up 89 (8.0%).
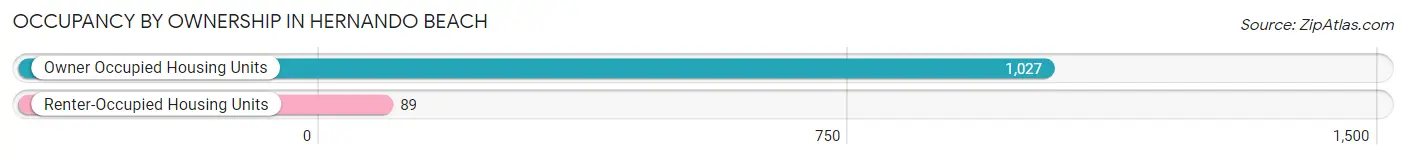
| Occupancy | # Housing Units | % Housing Units |
| Owner Occupied Housing Units | 1,027 | 92.0% |
| Renter-Occupied Housing Units | 89 | 8.0% |
| Total Occupied Housing Units | 1,116 | 100.0% |
Occupancy by Household Size in Hernando Beach
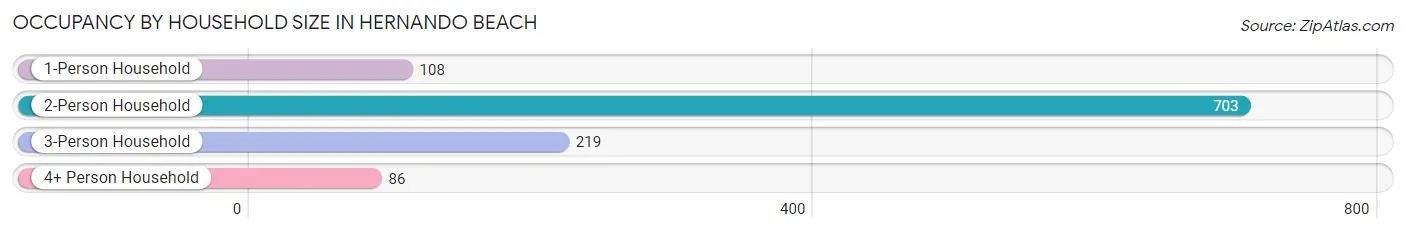
| Household Size | # Housing Units | % Housing Units |
| 1-Person Household | 108 | 9.7% |
| 2-Person Household | 703 | 63.0% |
| 3-Person Household | 219 | 19.6% |
| 4+ Person Household | 86 | 7.7% |
| Total Housing Units | 1,116 | 100.0% |
Occupancy by Ownership by Household Size in Hernando Beach
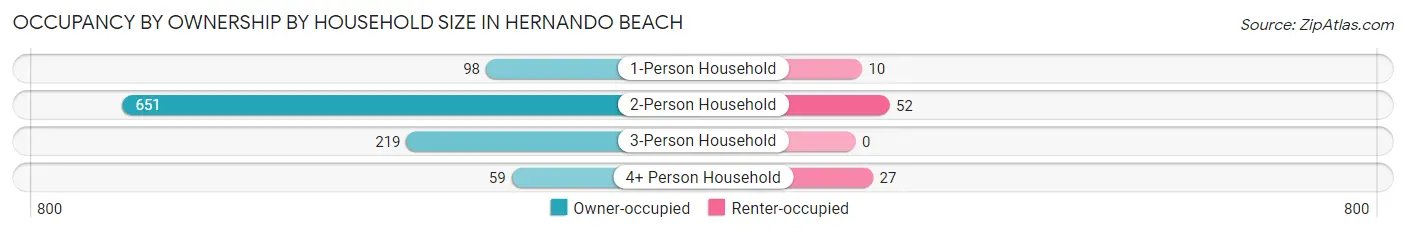
| Household Size | Owner-occupied | Renter-occupied |
| 1-Person Household | 98 (90.7%) | 10 (9.3%) |
| 2-Person Household | 651 (92.6%) | 52 (7.4%) |
| 3-Person Household | 219 (100.0%) | 0 (0.0%) |
| 4+ Person Household | 59 (68.6%) | 27 (31.4%) |
| Total Housing Units | 1,027 (92.0%) | 89 (8.0%) |
Occupancy by Educational Attainment in Hernando Beach
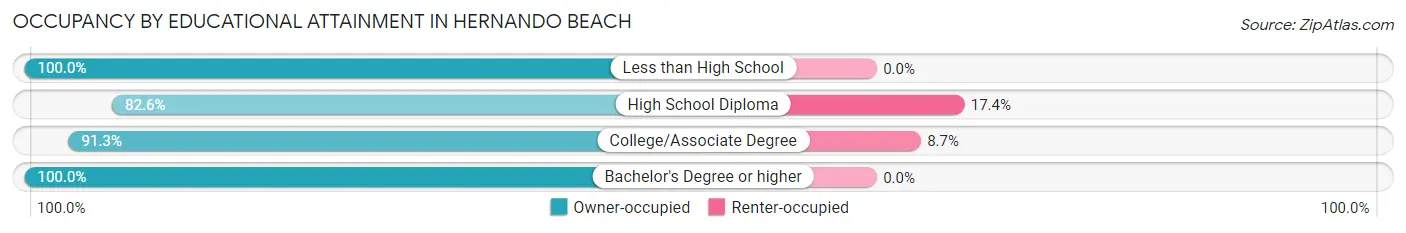
| Household Size | Owner-occupied | Renter-occupied |
| Less than High School | 7 (100.0%) | 0 (0.0%) |
| High School Diploma | 195 (82.6%) | 41 (17.4%) |
| College/Associate Degree | 502 (91.3%) | 48 (8.7%) |
| Bachelor's Degree or higher | 323 (100.0%) | 0 (0.0%) |
Occupancy by Age of Householder in Hernando Beach
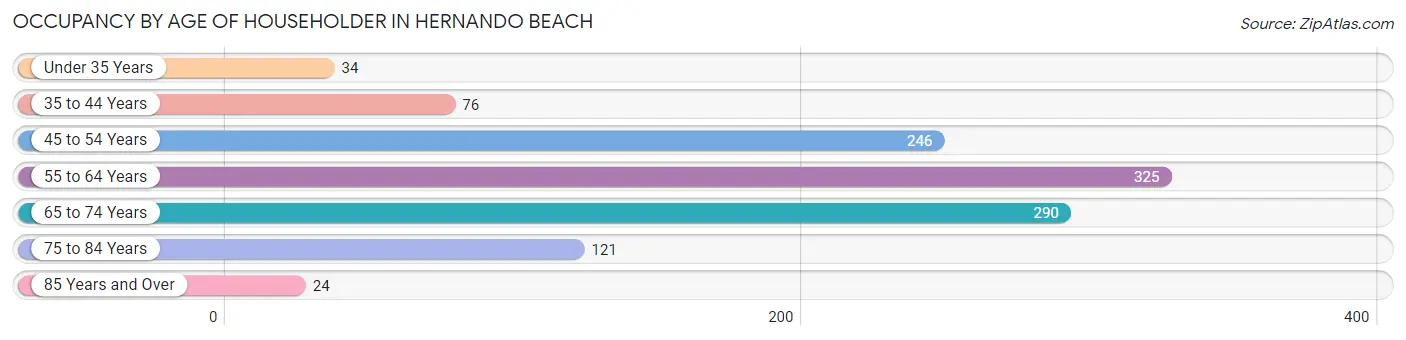
| Age Bracket | # Households | % Households |
| Under 35 Years | 34 | 3.0% |
| 35 to 44 Years | 76 | 6.8% |
| 45 to 54 Years | 246 | 22.0% |
| 55 to 64 Years | 325 | 29.1% |
| 65 to 74 Years | 290 | 26.0% |
| 75 to 84 Years | 121 | 10.8% |
| 85 Years and Over | 24 | 2.1% |
| Total | 1,116 | 100.0% |
Housing Finances in Hernando Beach
Median Income by Occupancy in Hernando Beach
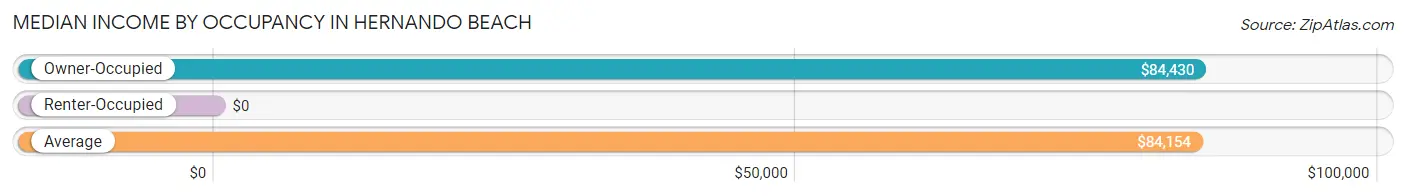
| Occupancy Type | # Households | Median Income |
| Owner-Occupied | 1,027 (92.0%) | $84,430 |
| Renter-Occupied | 89 (8.0%) | $0 |
| Average | 1,116 (100.0%) | $84,154 |
Occupancy by Householder Income Bracket in Hernando Beach
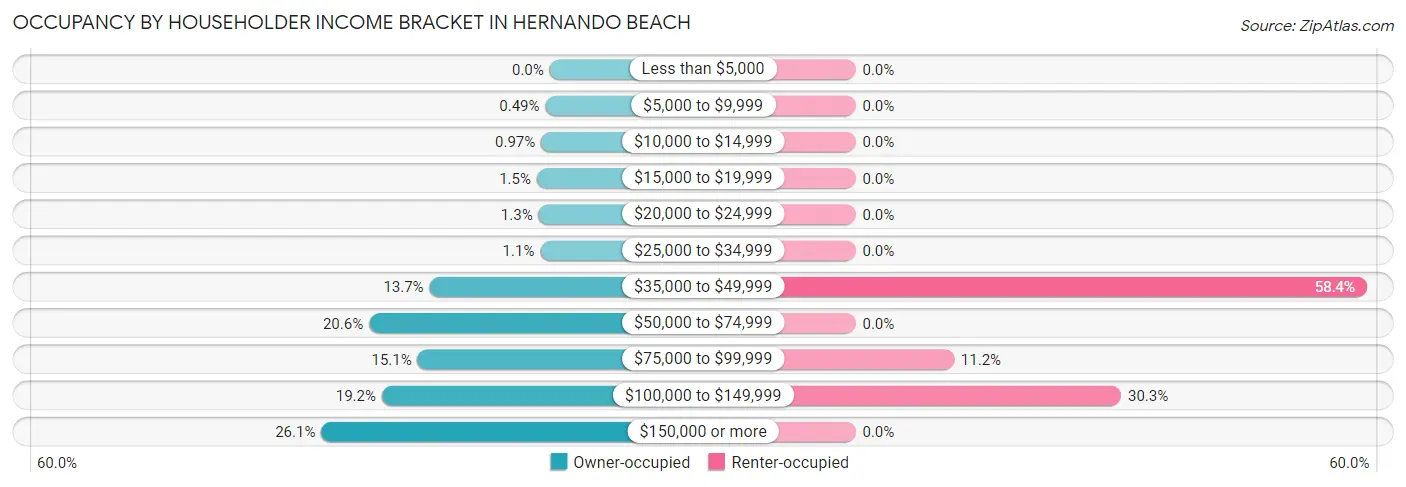
| Income Bracket | Owner-occupied | Renter-occupied |
| Less than $5,000 | 0 (0.0%) | 0 (0.0%) |
| $5,000 to $9,999 | 5 (0.5%) | 0 (0.0%) |
| $10,000 to $14,999 | 10 (1.0%) | 0 (0.0%) |
| $15,000 to $19,999 | 15 (1.5%) | 0 (0.0%) |
| $20,000 to $24,999 | 13 (1.3%) | 0 (0.0%) |
| $25,000 to $34,999 | 11 (1.1%) | 0 (0.0%) |
| $35,000 to $49,999 | 141 (13.7%) | 52 (58.4%) |
| $50,000 to $74,999 | 212 (20.6%) | 0 (0.0%) |
| $75,000 to $99,999 | 155 (15.1%) | 10 (11.2%) |
| $100,000 to $149,999 | 197 (19.2%) | 27 (30.3%) |
| $150,000 or more | 268 (26.1%) | 0 (0.0%) |
| Total | 1,027 (100.0%) | 89 (100.0%) |
Monthly Housing Cost Tiers in Hernando Beach
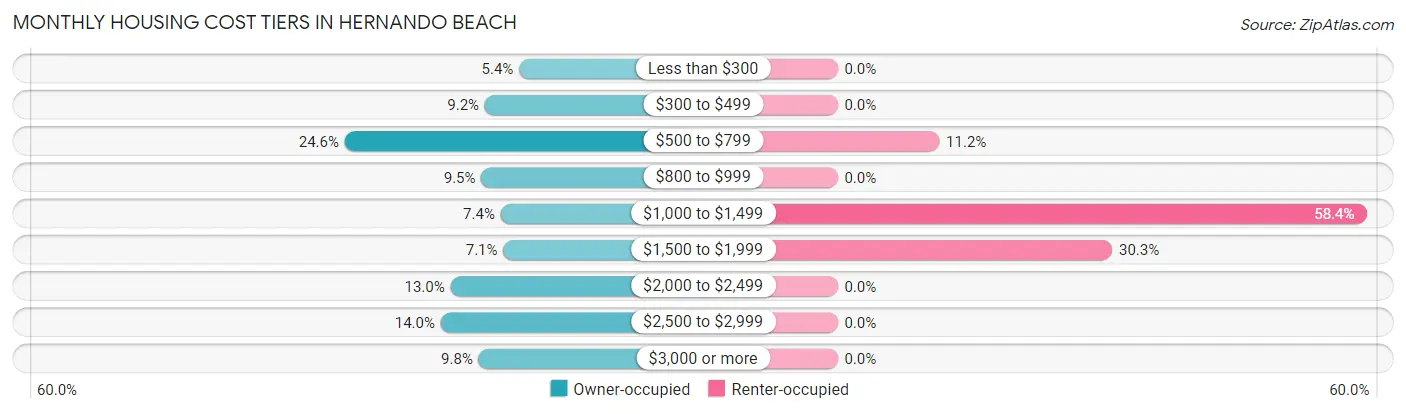
| Monthly Cost | Owner-occupied | Renter-occupied |
| Less than $300 | 55 (5.4%) | 0 (0.0%) |
| $300 to $499 | 94 (9.1%) | 0 (0.0%) |
| $500 to $799 | 253 (24.6%) | 10 (11.2%) |
| $800 to $999 | 98 (9.5%) | 0 (0.0%) |
| $1,000 to $1,499 | 76 (7.4%) | 52 (58.4%) |
| $1,500 to $1,999 | 73 (7.1%) | 27 (30.3%) |
| $2,000 to $2,499 | 133 (13.0%) | 0 (0.0%) |
| $2,500 to $2,999 | 144 (14.0%) | 0 (0.0%) |
| $3,000 or more | 101 (9.8%) | 0 (0.0%) |
| Total | 1,027 (100.0%) | 89 (100.0%) |
Physical Housing Characteristics in Hernando Beach
Housing Structures in Hernando Beach
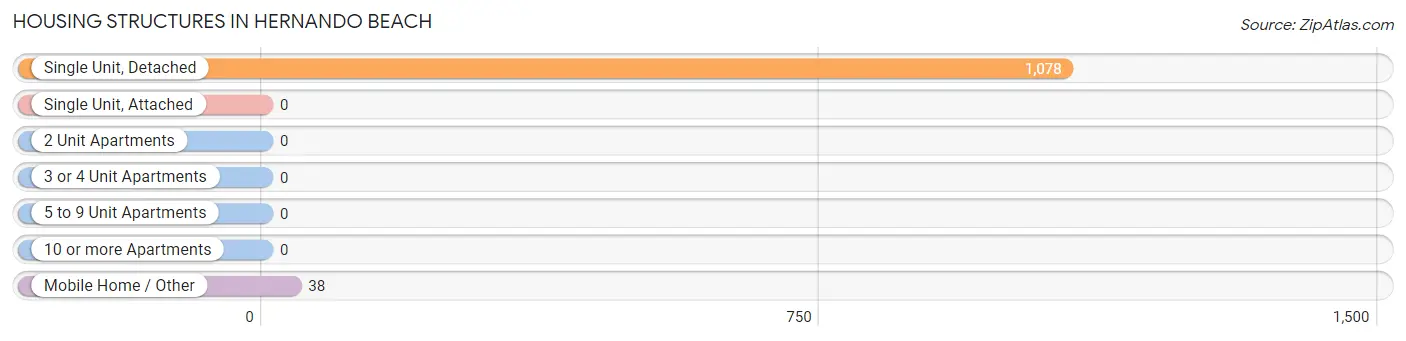
| Structure Type | # Housing Units | % Housing Units |
| Single Unit, Detached | 1,078 | 96.6% |
| Single Unit, Attached | 0 | 0.0% |
| 2 Unit Apartments | 0 | 0.0% |
| 3 or 4 Unit Apartments | 0 | 0.0% |
| 5 to 9 Unit Apartments | 0 | 0.0% |
| 10 or more Apartments | 0 | 0.0% |
| Mobile Home / Other | 38 | 3.4% |
| Total | 1,116 | 100.0% |
Housing Structures by Occupancy in Hernando Beach
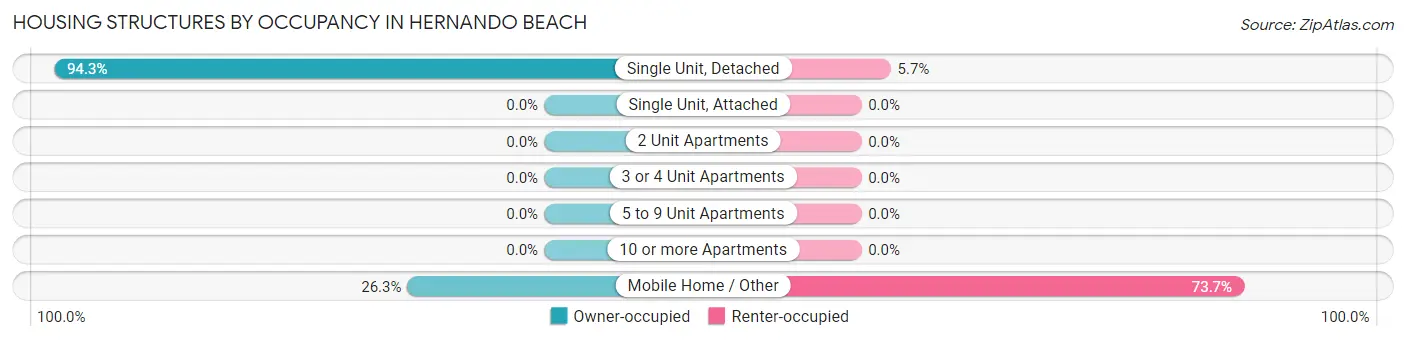
| Structure Type | Owner-occupied | Renter-occupied |
| Single Unit, Detached | 1,017 (94.3%) | 61 (5.7%) |
| Single Unit, Attached | 0 (0.0%) | 0 (0.0%) |
| 2 Unit Apartments | 0 (0.0%) | 0 (0.0%) |
| 3 or 4 Unit Apartments | 0 (0.0%) | 0 (0.0%) |
| 5 to 9 Unit Apartments | 0 (0.0%) | 0 (0.0%) |
| 10 or more Apartments | 0 (0.0%) | 0 (0.0%) |
| Mobile Home / Other | 10 (26.3%) | 28 (73.7%) |
| Total | 1,027 (92.0%) | 89 (8.0%) |
Housing Structures by Number of Rooms in Hernando Beach
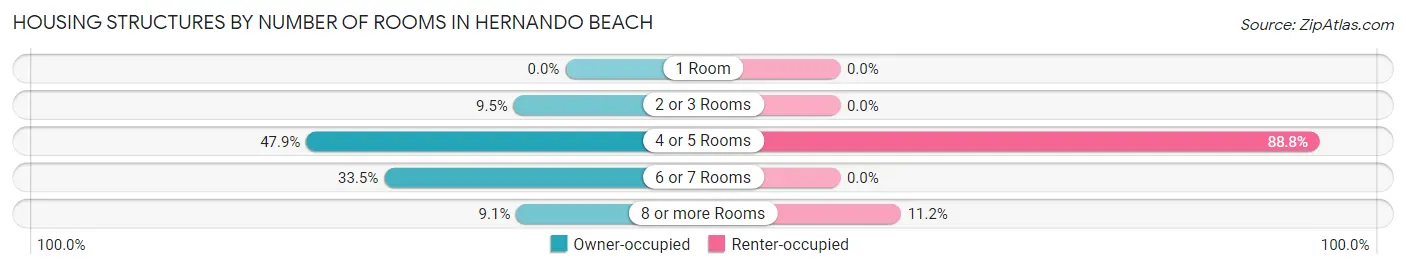
| Number of Rooms | Owner-occupied | Renter-occupied |
| 1 Room | 0 (0.0%) | 0 (0.0%) |
| 2 or 3 Rooms | 98 (9.5%) | 0 (0.0%) |
| 4 or 5 Rooms | 492 (47.9%) | 79 (88.8%) |
| 6 or 7 Rooms | 344 (33.5%) | 0 (0.0%) |
| 8 or more Rooms | 93 (9.1%) | 10 (11.2%) |
| Total | 1,027 (100.0%) | 89 (100.0%) |
Housing Structure by Heating Type in Hernando Beach
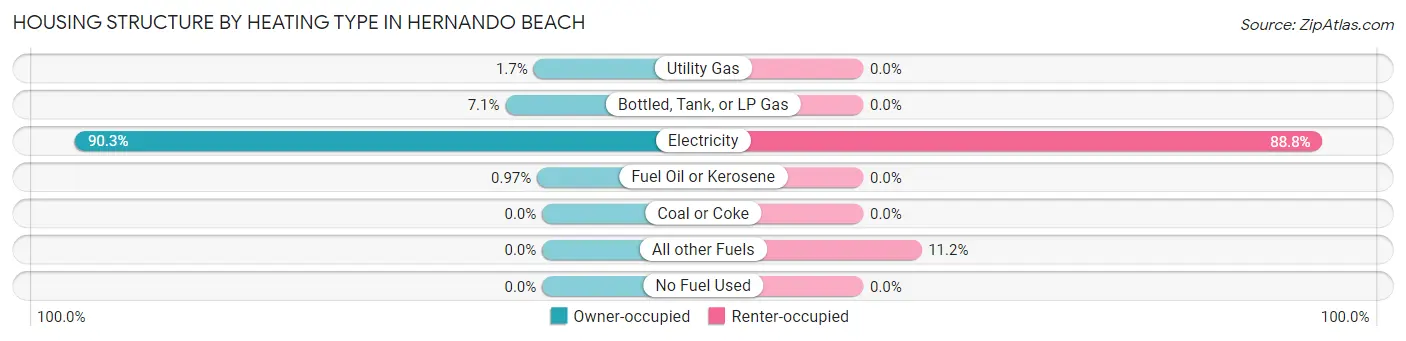
| Heating Type | Owner-occupied | Renter-occupied |
| Utility Gas | 17 (1.7%) | 0 (0.0%) |
| Bottled, Tank, or LP Gas | 73 (7.1%) | 0 (0.0%) |
| Electricity | 927 (90.3%) | 79 (88.8%) |
| Fuel Oil or Kerosene | 10 (1.0%) | 0 (0.0%) |
| Coal or Coke | 0 (0.0%) | 0 (0.0%) |
| All other Fuels | 0 (0.0%) | 10 (11.2%) |
| No Fuel Used | 0 (0.0%) | 0 (0.0%) |
| Total | 1,027 (100.0%) | 89 (100.0%) |
Household Vehicle Usage in Hernando Beach
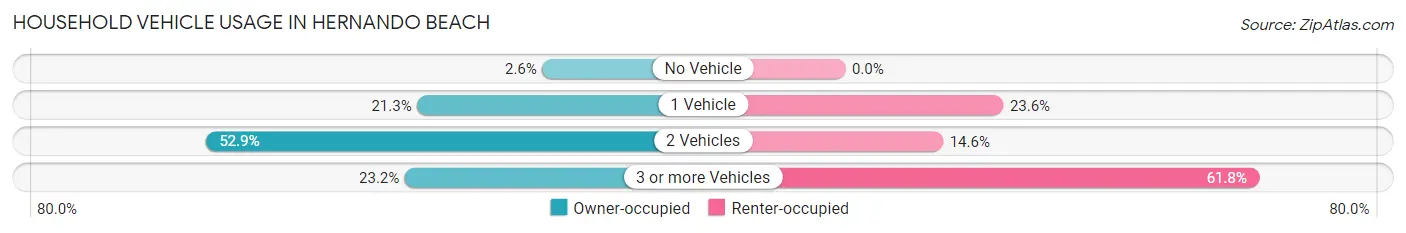
| Vehicles per Household | Owner-occupied | Renter-occupied |
| No Vehicle | 27 (2.6%) | 0 (0.0%) |
| 1 Vehicle | 219 (21.3%) | 21 (23.6%) |
| 2 Vehicles | 543 (52.9%) | 13 (14.6%) |
| 3 or more Vehicles | 238 (23.2%) | 55 (61.8%) |
| Total | 1,027 (100.0%) | 89 (100.0%) |
Real Estate & Mortgages in Hernando Beach
Real Estate and Mortgage Overview in Hernando Beach
| Characteristic | Without Mortgage | With Mortgage |
| Housing Units | 521 | 506 |
| Median Property Value | $354,200 | $424,800 |
| Median Household Income | $79,417 | $203 |
| Monthly Housing Costs | $583 | $101 |
| Real Estate Taxes | $2,865 | $16 |
Property Value by Mortgage Status in Hernando Beach
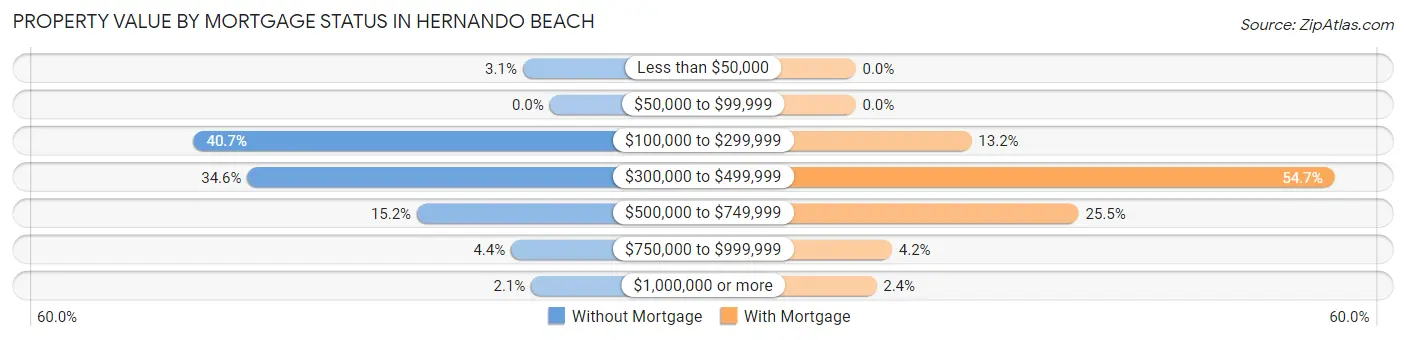
| Property Value | Without Mortgage | With Mortgage |
| Less than $50,000 | 16 (3.1%) | 0 (0.0%) |
| $50,000 to $99,999 | 0 (0.0%) | 0 (0.0%) |
| $100,000 to $299,999 | 212 (40.7%) | 67 (13.2%) |
| $300,000 to $499,999 | 180 (34.5%) | 277 (54.7%) |
| $500,000 to $749,999 | 79 (15.2%) | 129 (25.5%) |
| $750,000 to $999,999 | 23 (4.4%) | 21 (4.2%) |
| $1,000,000 or more | 11 (2.1%) | 12 (2.4%) |
| Total | 521 (100.0%) | 506 (100.0%) |
Household Income by Mortgage Status in Hernando Beach
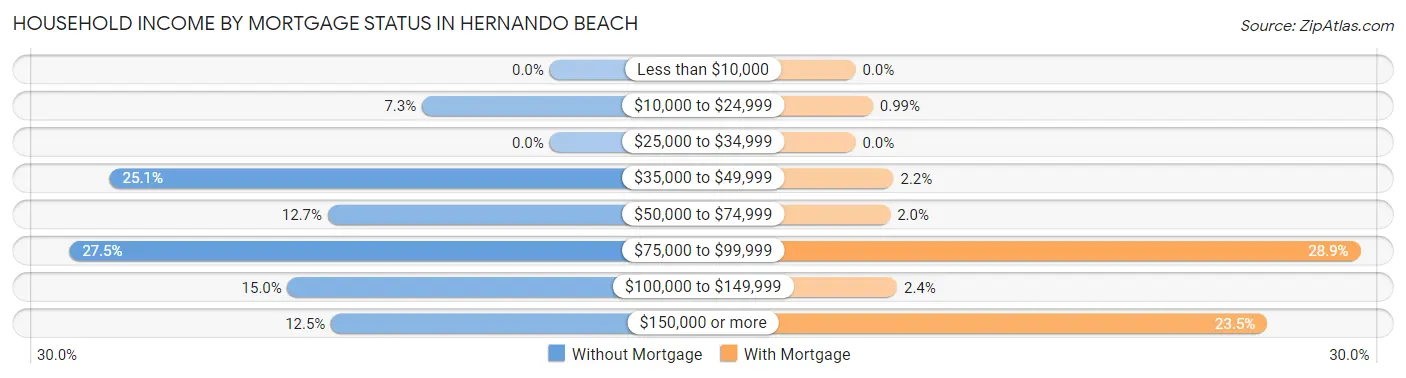
| Household Income | Without Mortgage | With Mortgage |
| Less than $10,000 | 0 (0.0%) | 0 (0.0%) |
| $10,000 to $24,999 | 38 (7.3%) | 5 (1.0%) |
| $25,000 to $34,999 | 0 (0.0%) | 0 (0.0%) |
| $35,000 to $49,999 | 131 (25.1%) | 11 (2.2%) |
| $50,000 to $74,999 | 66 (12.7%) | 10 (2.0%) |
| $75,000 to $99,999 | 143 (27.5%) | 146 (28.8%) |
| $100,000 to $149,999 | 78 (15.0%) | 12 (2.4%) |
| $150,000 or more | 65 (12.5%) | 119 (23.5%) |
| Total | 521 (100.0%) | 506 (100.0%) |
Property Value to Household Income Ratio in Hernando Beach
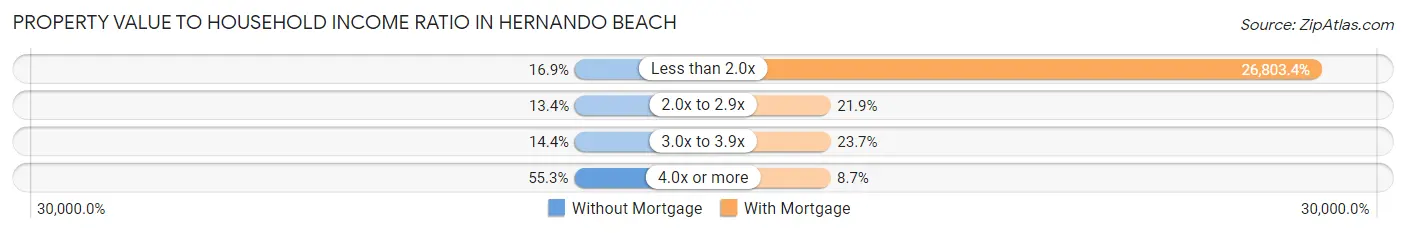
| Value-to-Income Ratio | Without Mortgage | With Mortgage |
| Less than 2.0x | 88 (16.9%) | 135,625 (26,803.4%) |
| 2.0x to 2.9x | 70 (13.4%) | 111 (21.9%) |
| 3.0x to 3.9x | 75 (14.4%) | 120 (23.7%) |
| 4.0x or more | 288 (55.3%) | 44 (8.7%) |
| Total | 521 (100.0%) | 506 (100.0%) |
Real Estate Taxes by Mortgage Status in Hernando Beach
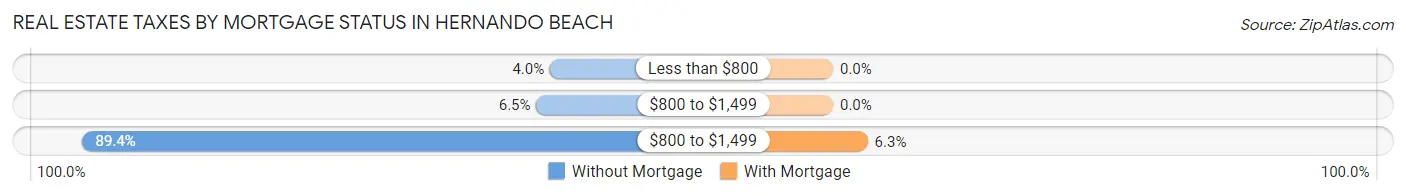
| Property Taxes | Without Mortgage | With Mortgage |
| Less than $800 | 21 (4.0%) | 0 (0.0%) |
| $800 to $1,499 | 34 (6.5%) | 0 (0.0%) |
| $800 to $1,499 | 466 (89.4%) | 32 (6.3%) |
| Total | 521 (100.0%) | 506 (100.0%) |
Health & Disability in Hernando Beach
Health Insurance Coverage by Age in Hernando Beach
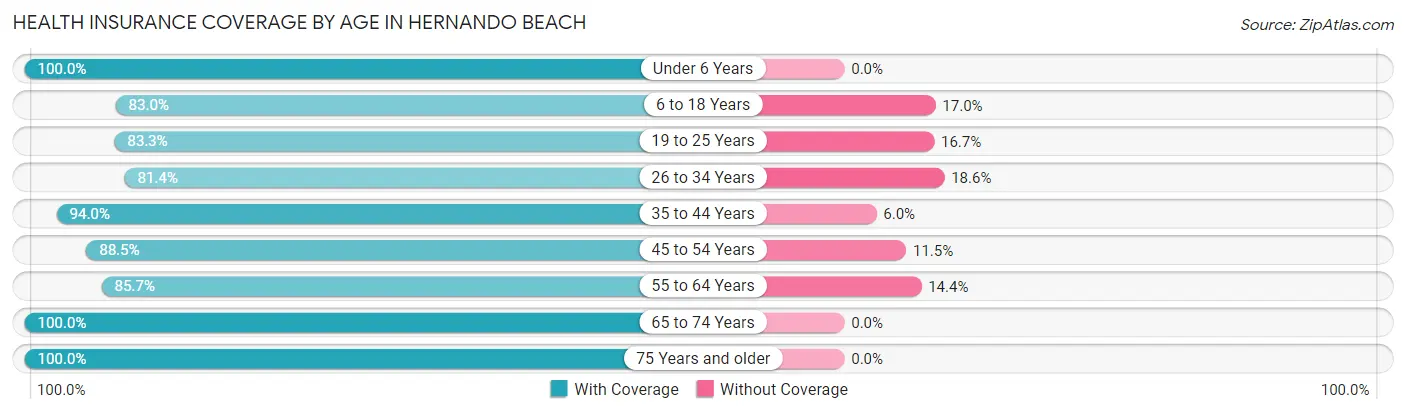
| Age Bracket | With Coverage | Without Coverage |
| Under 6 Years | 38 (100.0%) | 0 (0.0%) |
| 6 to 18 Years | 127 (83.0%) | 26 (17.0%) |
| 19 to 25 Years | 194 (83.3%) | 39 (16.7%) |
| 26 to 34 Years | 48 (81.4%) | 11 (18.6%) |
| 35 to 44 Years | 126 (94.0%) | 8 (6.0%) |
| 45 to 54 Years | 438 (88.5%) | 57 (11.5%) |
| 55 to 64 Years | 531 (85.7%) | 89 (14.3%) |
| 65 to 74 Years | 536 (100.0%) | 0 (0.0%) |
| 75 Years and older | 290 (100.0%) | 0 (0.0%) |
| Total | 2,328 (91.0%) | 230 (9.0%) |
Health Insurance Coverage by Citizenship Status in Hernando Beach
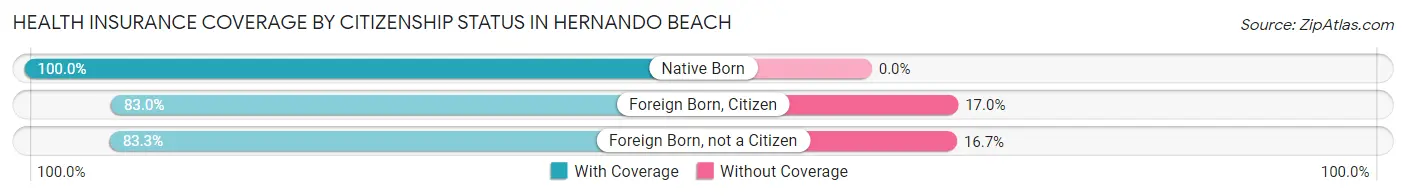
| Citizenship Status | With Coverage | Without Coverage |
| Native Born | 38 (100.0%) | 0 (0.0%) |
| Foreign Born, Citizen | 127 (83.0%) | 26 (17.0%) |
| Foreign Born, not a Citizen | 194 (83.3%) | 39 (16.7%) |
Health Insurance Coverage by Household Income in Hernando Beach
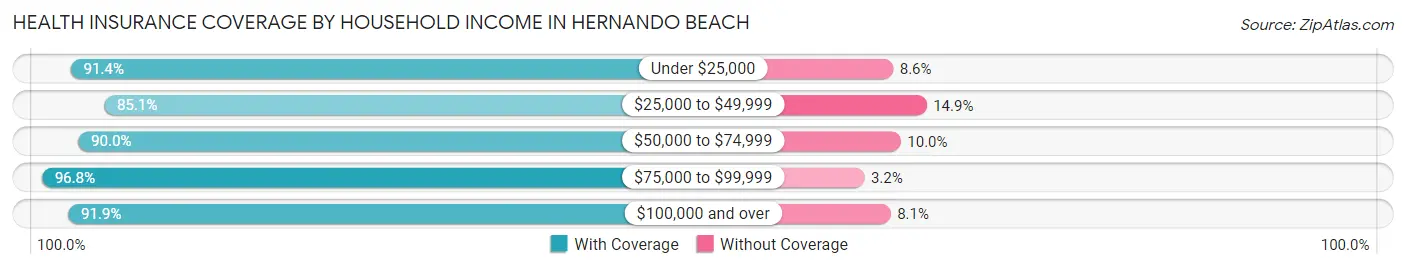
| Household Income | With Coverage | Without Coverage |
| Under $25,000 | 106 (91.4%) | 10 (8.6%) |
| $25,000 to $49,999 | 349 (85.1%) | 61 (14.9%) |
| $50,000 to $74,999 | 421 (90.0%) | 47 (10.0%) |
| $75,000 to $99,999 | 301 (96.8%) | 10 (3.2%) |
| $100,000 and over | 1,151 (91.9%) | 102 (8.1%) |
Public vs Private Health Insurance Coverage by Age in Hernando Beach
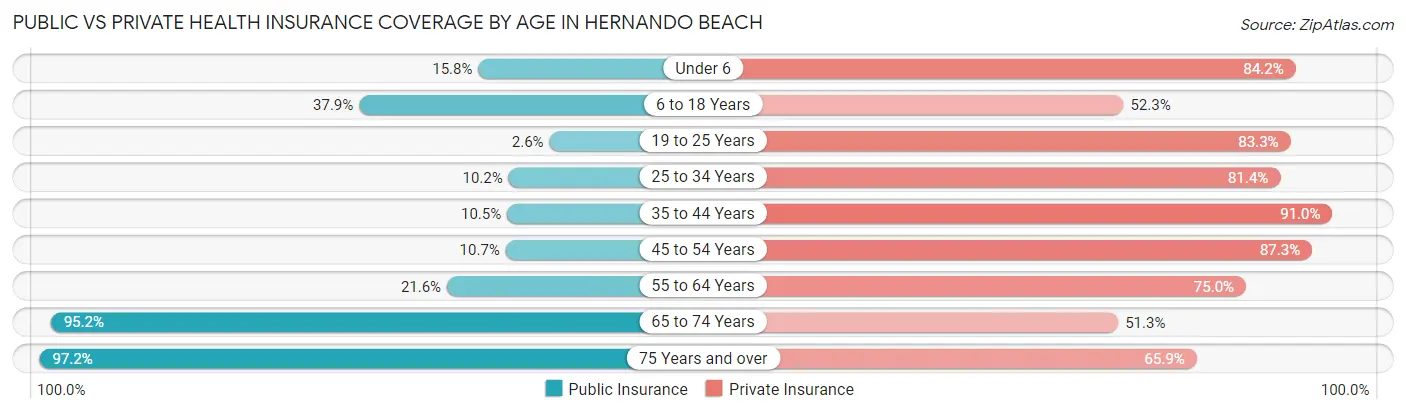
| Age Bracket | Public Insurance | Private Insurance |
| Under 6 | 6 (15.8%) | 32 (84.2%) |
| 6 to 18 Years | 58 (37.9%) | 80 (52.3%) |
| 19 to 25 Years | 6 (2.6%) | 194 (83.3%) |
| 25 to 34 Years | 6 (10.2%) | 48 (81.4%) |
| 35 to 44 Years | 14 (10.4%) | 122 (91.0%) |
| 45 to 54 Years | 53 (10.7%) | 432 (87.3%) |
| 55 to 64 Years | 134 (21.6%) | 465 (75.0%) |
| 65 to 74 Years | 510 (95.2%) | 275 (51.3%) |
| 75 Years and over | 282 (97.2%) | 191 (65.9%) |
| Total | 1,069 (41.8%) | 1,839 (71.9%) |
Disability Status by Sex by Age in Hernando Beach
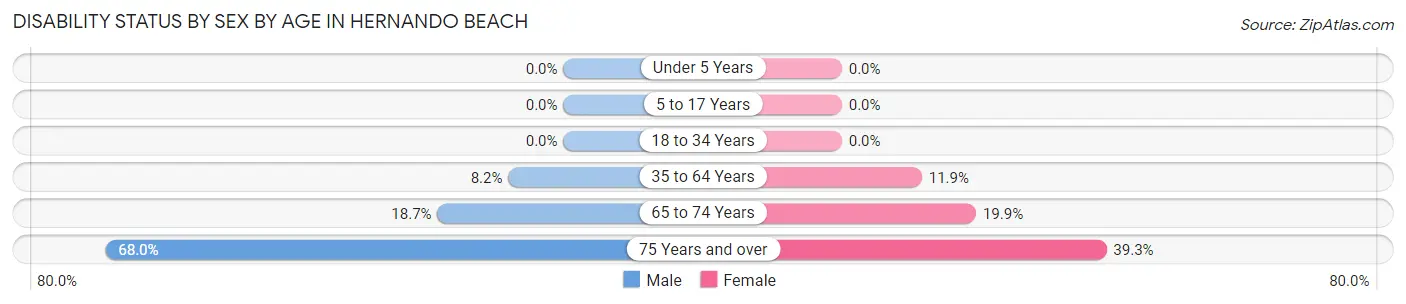
| Age Bracket | Male | Female |
| Under 5 Years | 0 (0.0%) | 0 (0.0%) |
| 5 to 17 Years | 0 (0.0%) | 0 (0.0%) |
| 18 to 34 Years | 0 (0.0%) | 0 (0.0%) |
| 35 to 64 Years | 54 (8.2%) | 70 (11.9%) |
| 65 to 74 Years | 43 (18.7%) | 61 (19.9%) |
| 75 Years and over | 102 (68.0%) | 55 (39.3%) |
Disability Class by Sex by Age in Hernando Beach
Disability Class: Hearing Difficulty
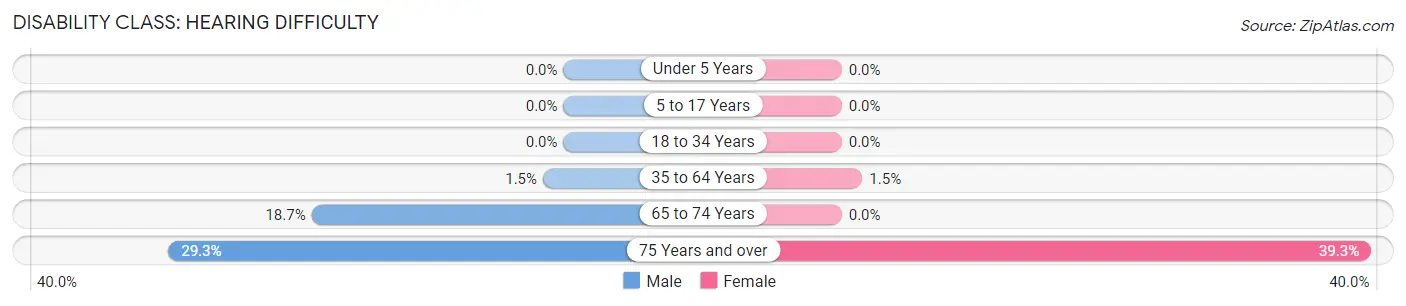
| Age Bracket | Male | Female |
| Under 5 Years | 0 (0.0%) | 0 (0.0%) |
| 5 to 17 Years | 0 (0.0%) | 0 (0.0%) |
| 18 to 34 Years | 0 (0.0%) | 0 (0.0%) |
| 35 to 64 Years | 10 (1.5%) | 9 (1.5%) |
| 65 to 74 Years | 43 (18.7%) | 0 (0.0%) |
| 75 Years and over | 44 (29.3%) | 55 (39.3%) |
Disability Class: Vision Difficulty
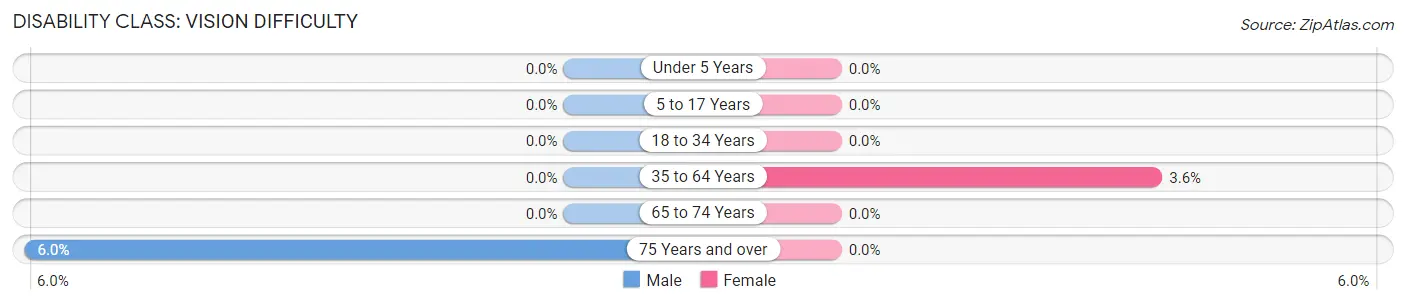
| Age Bracket | Male | Female |
| Under 5 Years | 0 (0.0%) | 0 (0.0%) |
| 5 to 17 Years | 0 (0.0%) | 0 (0.0%) |
| 18 to 34 Years | 0 (0.0%) | 0 (0.0%) |
| 35 to 64 Years | 0 (0.0%) | 21 (3.6%) |
| 65 to 74 Years | 0 (0.0%) | 0 (0.0%) |
| 75 Years and over | 9 (6.0%) | 0 (0.0%) |
Disability Class: Cognitive Difficulty
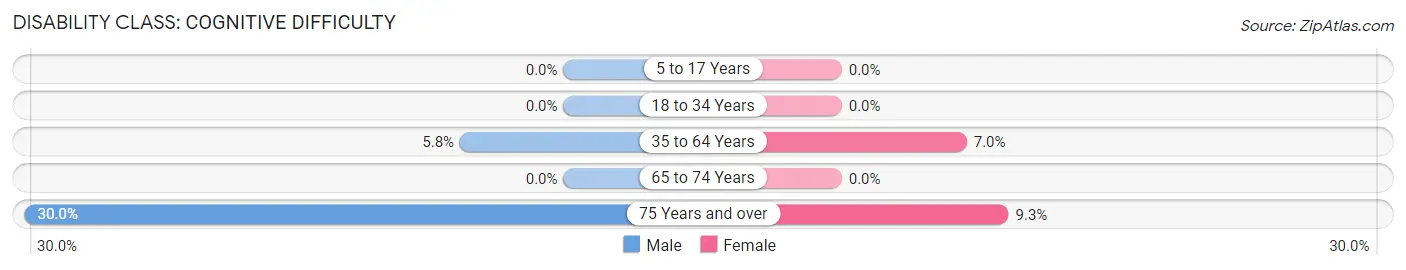
| Age Bracket | Male | Female |
| 5 to 17 Years | 0 (0.0%) | 0 (0.0%) |
| 18 to 34 Years | 0 (0.0%) | 0 (0.0%) |
| 35 to 64 Years | 38 (5.8%) | 41 (7.0%) |
| 65 to 74 Years | 0 (0.0%) | 0 (0.0%) |
| 75 Years and over | 45 (30.0%) | 13 (9.3%) |
Disability Class: Ambulatory Difficulty
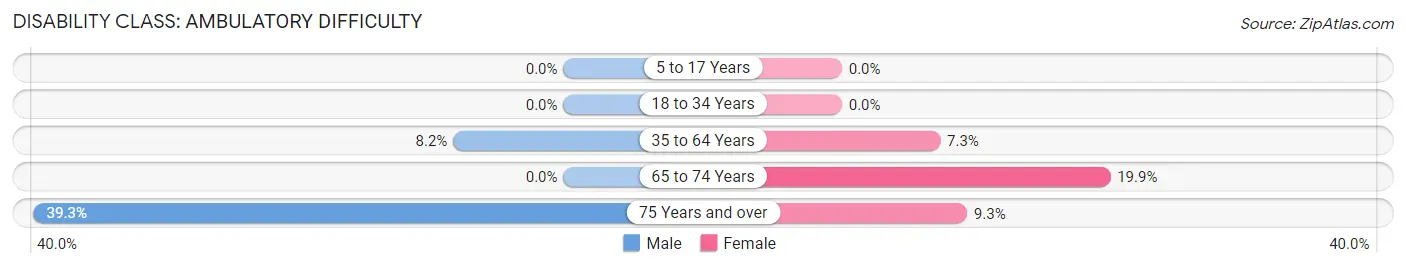
| Age Bracket | Male | Female |
| 5 to 17 Years | 0 (0.0%) | 0 (0.0%) |
| 18 to 34 Years | 0 (0.0%) | 0 (0.0%) |
| 35 to 64 Years | 54 (8.2%) | 43 (7.3%) |
| 65 to 74 Years | 0 (0.0%) | 61 (19.9%) |
| 75 Years and over | 59 (39.3%) | 13 (9.3%) |
Disability Class: Self-Care Difficulty
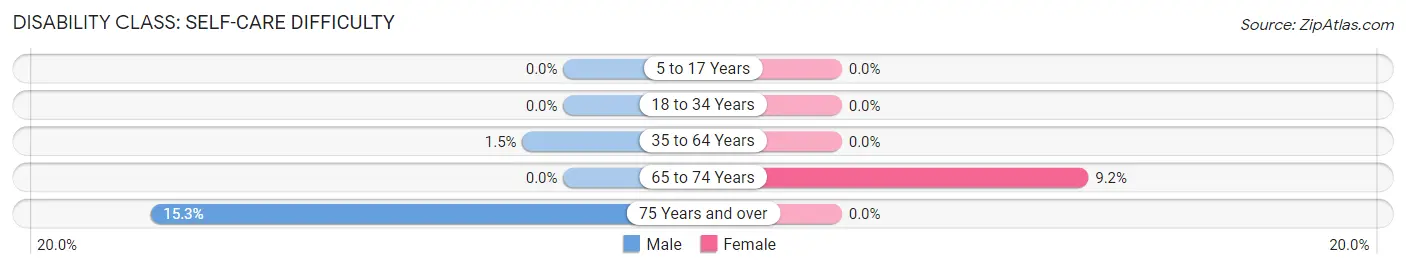
| Age Bracket | Male | Female |
| 5 to 17 Years | 0 (0.0%) | 0 (0.0%) |
| 18 to 34 Years | 0 (0.0%) | 0 (0.0%) |
| 35 to 64 Years | 10 (1.5%) | 0 (0.0%) |
| 65 to 74 Years | 0 (0.0%) | 28 (9.1%) |
| 75 Years and over | 23 (15.3%) | 0 (0.0%) |
Technology Access in Hernando Beach
Computing Device Access in Hernando Beach
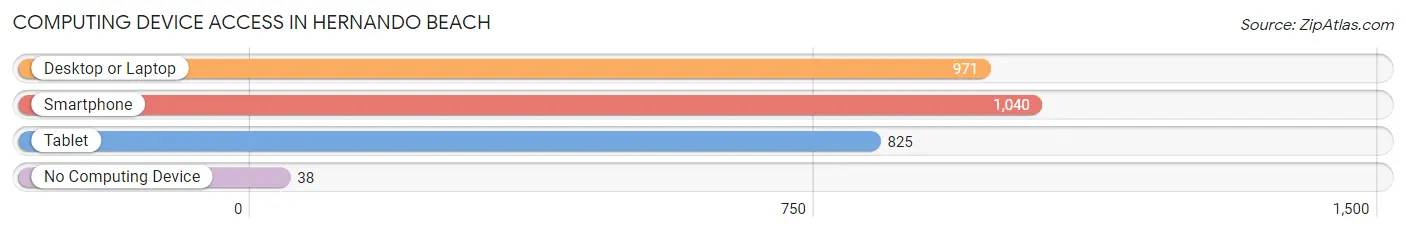
| Device Type | # Households | % Households |
| Desktop or Laptop | 971 | 87.0% |
| Smartphone | 1,040 | 93.2% |
| Tablet | 825 | 73.9% |
| No Computing Device | 38 | 3.4% |
| Total | 1,116 | 100.0% |
Internet Access in Hernando Beach
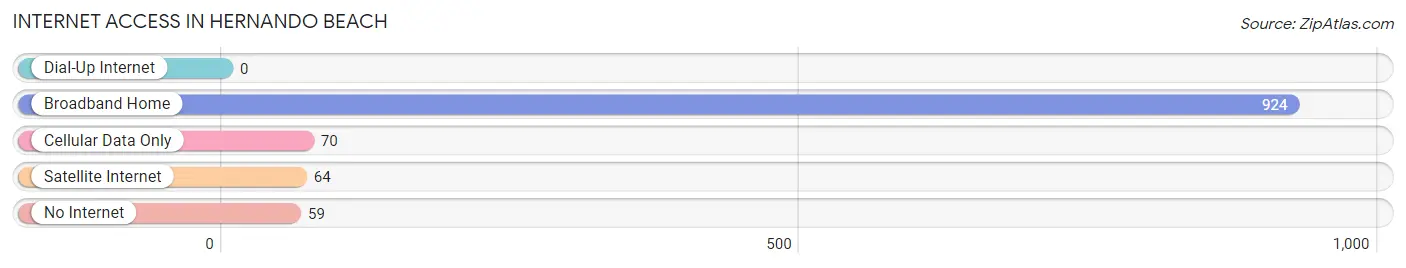
| Internet Type | # Households | % Households |
| Dial-Up Internet | 0 | 0.0% |
| Broadband Home | 924 | 82.8% |
| Cellular Data Only | 70 | 6.3% |
| Satellite Internet | 64 | 5.7% |
| No Internet | 59 | 5.3% |
| Total | 1,116 | 100.0% |
Hernando Beach Summary
Hernando Beach is a small unincorporated community located in Hernando County, Florida. It is situated on the Gulf of Mexico, approximately 40 miles north of Tampa. The community is bordered by the Weeki Wachee River to the east and the Gulf of Mexico to the west. Hernando Beach is a popular destination for fishing, boating, and other outdoor activities.
History
Hernando Beach was originally inhabited by the Timucua Indians, who lived in the area for centuries before the arrival of Europeans. The first European settlers arrived in the area in the late 1700s, and the community was officially established in 1845. The town was named after Spanish explorer Hernando de Soto, who explored the area in 1539.
In the early 1900s, the area began to develop as a fishing village. The first bridge connecting Hernando Beach to the mainland was built in 1925, and the town was incorporated in 1927. The town grew steadily throughout the 20th century, and by the 2000s, it had become a popular tourist destination.
Geography
Hernando Beach is located in Hernando County, Florida, on the Gulf of Mexico. It is situated on the Weeki Wachee River, approximately 40 miles north of Tampa. The town is bordered by the Gulf of Mexico to the west and the Weeki Wachee River to the east. The town is located on a peninsula, with the Gulf of Mexico to the west and the Weeki Wachee River to the east.
The town has a total area of 4.2 square miles, of which 3.9 square miles is land and 0.3 square miles is water. The town is located at an elevation of 10 feet above sea level.
Economy
Hernando Beach is a popular tourist destination, and the local economy is largely driven by tourism. The town is home to several marinas, restaurants, and other businesses catering to tourists. Fishing is also a major industry in the area, and the town is home to several charter fishing companies.
Demographics
As of the 2010 census, Hernando Beach had a population of 2,711. The racial makeup of the town was 94.3% White, 1.7% African American, 0.7% Native American, 0.7% Asian, 0.1% Pacific Islander, 1.2% from other races, and 1.2% from two or more races. Hispanic or Latino of any race were 4.2% of the population.
The median household income in Hernando Beach was $45,938, and the median family income was $50,938. The per capita income for the town was $25,938. About 8.3% of families and 10.2% of the population were below the poverty line, including 14.2% of those under age 18 and 6.2% of those age 65 or over.
Common Questions
What is Per Capita Income in Hernando Beach?
Per Capita income in Hernando Beach is $46,999.
What is the Median Family Income in Hernando Beach?
Median Family Income in Hernando Beach is $84,976.
What is the Median Household income in Hernando Beach?
Median Household Income in Hernando Beach is $84,154.
What is Income or Wage Gap in Hernando Beach?
Income or Wage Gap in Hernando Beach is 43.1%.
Women in Hernando Beach earn 56.9 cents for every dollar earned by a man.
What is Family Income Deficit in Hernando Beach?
Family Income Deficit in Hernando Beach is $7,663.
Families that are below poverty line in Hernando Beach earn $7,663 less on average than the poverty threshold level.
What is Inequality or Gini Index in Hernando Beach?
Inequality or Gini Index in Hernando Beach is 0.35.
What is the Total Population of Hernando Beach?
Total Population of Hernando Beach is 2,558.
What is the Total Male Population of Hernando Beach?
Total Male Population of Hernando Beach is 1,241.
What is the Total Female Population of Hernando Beach?
Total Female Population of Hernando Beach is 1,317.
What is the Ratio of Males per 100 Females in Hernando Beach?
There are 94.23 Males per 100 Females in Hernando Beach.
What is the Ratio of Females per 100 Males in Hernando Beach?
There are 106.12 Females per 100 Males in Hernando Beach.
What is the Median Population Age in Hernando Beach?
Median Population Age in Hernando Beach is 58.1 Years.
What is the Average Family Size in Hernando Beach
Average Family Size in Hernando Beach is 2.4 People.
What is the Average Household Size in Hernando Beach
Average Household Size in Hernando Beach is 2.3 People.
How Large is the Labor Force in Hernando Beach?
There are 1,415 People in the Labor Forcein in Hernando Beach.
What is the Percentage of People in the Labor Force in Hernando Beach?
58.2% of People are in the Labor Force in Hernando Beach.
What is the Unemployment Rate in Hernando Beach?
Unemployment Rate in Hernando Beach is 4.9%.