Tlingit-Haida vs Trinidadian and Tobagonian GED/Equivalency
COMPARE
Tlingit-Haida
Trinidadian and Tobagonian
GED/Equivalency
GED/Equivalency Comparison
Tlingit-Haida
Trinidadians and Tobagonians
87.0%
GED/EQUIVALENCY
94.8/ 100
METRIC RATING
112th/ 347
METRIC RANK
83.0%
GED/EQUIVALENCY
0.2/ 100
METRIC RATING
267th/ 347
METRIC RANK
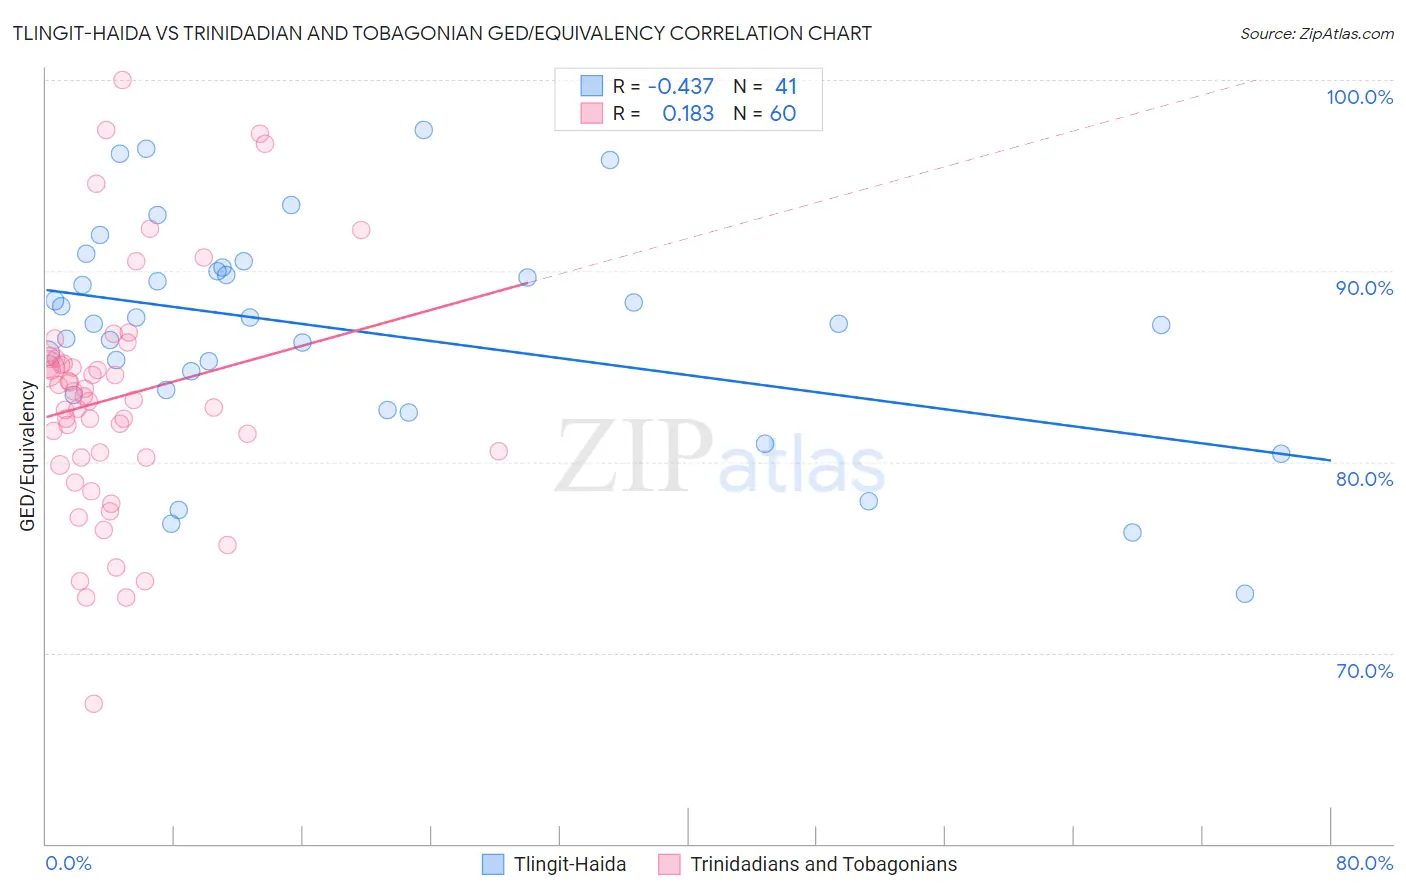
Tlingit-Haida vs Trinidadian and Tobagonian GED/Equivalency Correlation Chart
The statistical analysis conducted on geographies consisting of 60,871,919 people shows a moderate negative correlation between the proportion of Tlingit-Haida and percentage of population with at least ged/equivalency education in the United States with a correlation coefficient (R) of -0.437 and weighted average of 87.0%. Similarly, the statistical analysis conducted on geographies consisting of 219,883,449 people shows a poor positive correlation between the proportion of Trinidadians and Tobagonians and percentage of population with at least ged/equivalency education in the United States with a correlation coefficient (R) of 0.183 and weighted average of 83.0%, a difference of 4.8%.
GED/Equivalency Correlation Summary
| Measurement | Tlingit-Haida | Trinidadian and Tobagonian |
| Minimum | 73.1% | 67.3% |
| Maximum | 97.4% | 100.0% |
| Range | 24.3% | 32.7% |
| Mean | 86.9% | 83.4% |
| Median | 87.2% | 83.4% |
| Interquartile 25% (IQ1) | 83.6% | 80.2% |
| Interquartile 75% (IQ3) | 90.1% | 85.3% |
| Interquartile Range (IQR) | 6.4% | 5.0% |
| Standard Deviation (Sample) | 5.6% | 6.3% |
| Standard Deviation (Population) | 5.6% | 6.3% |
Similar Demographics by GED/Equivalency
Demographics Similar to Tlingit-Haida by GED/Equivalency
In terms of ged/equivalency, the demographic groups most similar to Tlingit-Haida are Assyrian/Chaldean/Syriac (87.0%, a difference of 0.0%), Immigrants from Kazakhstan (87.0%, a difference of 0.010%), Mongolian (87.0%, a difference of 0.020%), Swiss (87.0%, a difference of 0.030%), and Egyptian (87.1%, a difference of 0.050%).
| Demographics | Rating | Rank | GED/Equivalency |
| Indians (Asian) | 95.9 /100 | #105 | Exceptional 87.1% |
| Immigrants | Zimbabwe | 95.8 /100 | #106 | Exceptional 87.1% |
| Icelanders | 95.7 /100 | #107 | Exceptional 87.1% |
| Canadians | 95.6 /100 | #108 | Exceptional 87.1% |
| Immigrants | Eastern Europe | 95.5 /100 | #109 | Exceptional 87.1% |
| Egyptians | 95.3 /100 | #110 | Exceptional 87.1% |
| French | 95.2 /100 | #111 | Exceptional 87.1% |
| Tlingit-Haida | 94.8 /100 | #112 | Exceptional 87.0% |
| Assyrians/Chaldeans/Syriacs | 94.8 /100 | #113 | Exceptional 87.0% |
| Immigrants | Kazakhstan | 94.7 /100 | #114 | Exceptional 87.0% |
| Mongolians | 94.6 /100 | #115 | Exceptional 87.0% |
| Swiss | 94.5 /100 | #116 | Exceptional 87.0% |
| Immigrants | Hong Kong | 93.8 /100 | #117 | Exceptional 86.9% |
| French Canadians | 93.2 /100 | #118 | Exceptional 86.9% |
| Immigrants | China | 93.2 /100 | #119 | Exceptional 86.9% |
Demographics Similar to Trinidadians and Tobagonians by GED/Equivalency
In terms of ged/equivalency, the demographic groups most similar to Trinidadians and Tobagonians are West Indian (83.1%, a difference of 0.020%), Kiowa (83.1%, a difference of 0.020%), Bangladeshi (83.1%, a difference of 0.030%), Immigrants from Congo (83.1%, a difference of 0.040%), and Immigrants from Burma/Myanmar (83.0%, a difference of 0.040%).
| Demographics | Rating | Rank | GED/Equivalency |
| Choctaw | 0.3 /100 | #260 | Tragic 83.1% |
| Inupiat | 0.2 /100 | #261 | Tragic 83.1% |
| Immigrants | Armenia | 0.2 /100 | #262 | Tragic 83.1% |
| Immigrants | Congo | 0.2 /100 | #263 | Tragic 83.1% |
| Bangladeshis | 0.2 /100 | #264 | Tragic 83.1% |
| West Indians | 0.2 /100 | #265 | Tragic 83.1% |
| Kiowa | 0.2 /100 | #266 | Tragic 83.1% |
| Trinidadians and Tobagonians | 0.2 /100 | #267 | Tragic 83.0% |
| Immigrants | Burma/Myanmar | 0.2 /100 | #268 | Tragic 83.0% |
| Hopi | 0.2 /100 | #269 | Tragic 83.0% |
| Immigrants | Jamaica | 0.2 /100 | #270 | Tragic 82.9% |
| U.S. Virgin Islanders | 0.2 /100 | #271 | Tragic 82.9% |
| Barbadians | 0.1 /100 | #272 | Tragic 82.9% |
| Pennsylvania Germans | 0.1 /100 | #273 | Tragic 82.9% |
| Immigrants | Trinidad and Tobago | 0.1 /100 | #274 | Tragic 82.8% |