Tlingit-Haida vs Ecuadorian GED/Equivalency
COMPARE
Tlingit-Haida
Ecuadorian
GED/Equivalency
GED/Equivalency Comparison
Tlingit-Haida
Ecuadorians
87.0%
GED/EQUIVALENCY
94.8/ 100
METRIC RATING
112th/ 347
METRIC RANK
81.7%
GED/EQUIVALENCY
0.0/ 100
METRIC RATING
299th/ 347
METRIC RANK
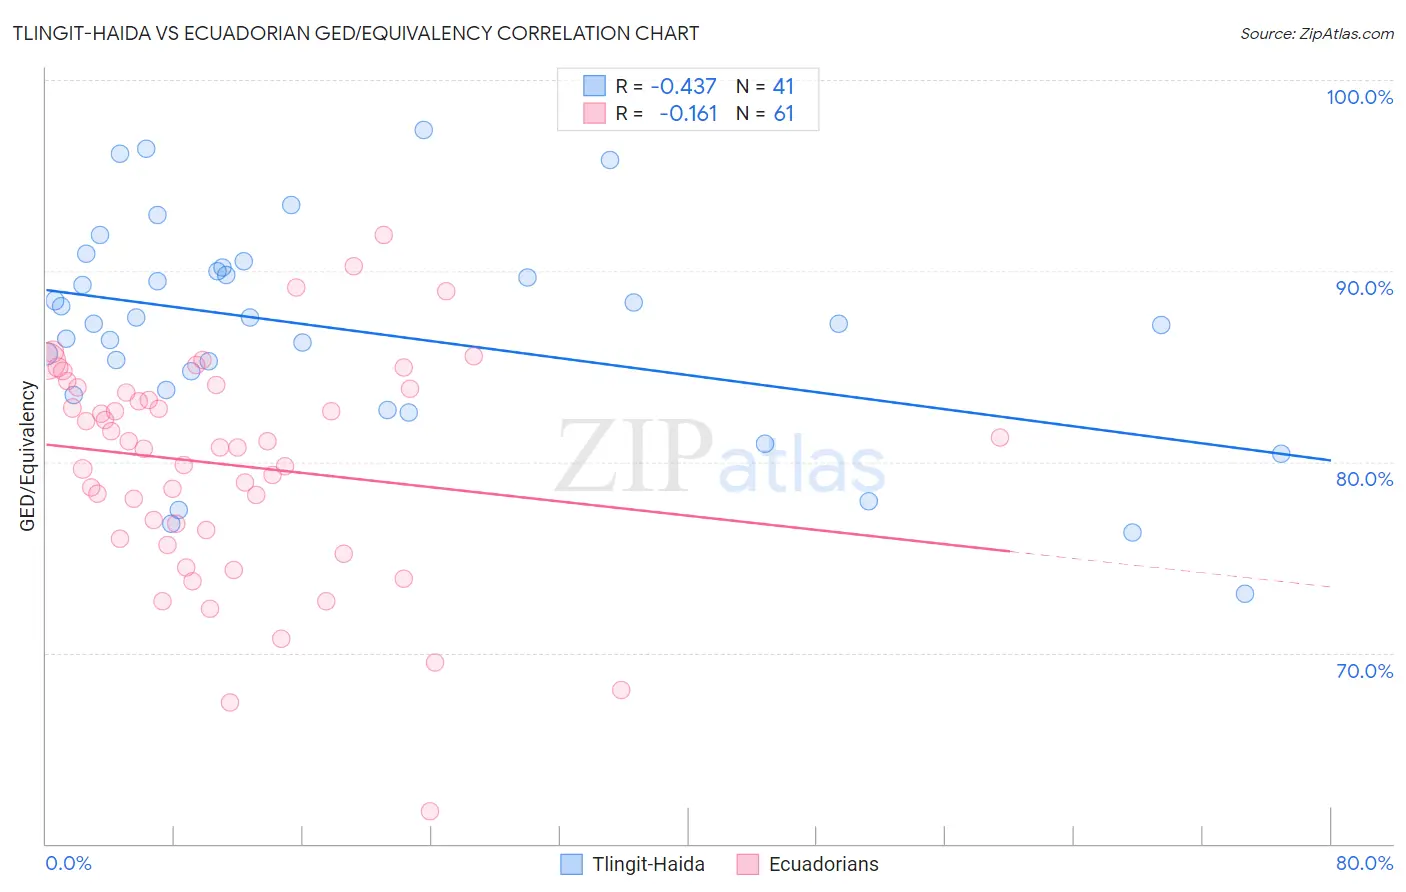
Tlingit-Haida vs Ecuadorian GED/Equivalency Correlation Chart
The statistical analysis conducted on geographies consisting of 60,871,919 people shows a moderate negative correlation between the proportion of Tlingit-Haida and percentage of population with at least ged/equivalency education in the United States with a correlation coefficient (R) of -0.437 and weighted average of 87.0%. Similarly, the statistical analysis conducted on geographies consisting of 317,864,750 people shows a poor negative correlation between the proportion of Ecuadorians and percentage of population with at least ged/equivalency education in the United States with a correlation coefficient (R) of -0.161 and weighted average of 81.7%, a difference of 6.5%.
GED/Equivalency Correlation Summary
| Measurement | Tlingit-Haida | Ecuadorian |
| Minimum | 73.1% | 61.7% |
| Maximum | 97.4% | 91.9% |
| Range | 24.3% | 30.2% |
| Mean | 86.9% | 79.8% |
| Median | 87.2% | 80.8% |
| Interquartile 25% (IQ1) | 83.6% | 76.2% |
| Interquartile 75% (IQ3) | 90.1% | 83.9% |
| Interquartile Range (IQR) | 6.4% | 7.7% |
| Standard Deviation (Sample) | 5.6% | 5.8% |
| Standard Deviation (Population) | 5.6% | 5.8% |
Similar Demographics by GED/Equivalency
Demographics Similar to Tlingit-Haida by GED/Equivalency
In terms of ged/equivalency, the demographic groups most similar to Tlingit-Haida are Assyrian/Chaldean/Syriac (87.0%, a difference of 0.0%), Immigrants from Kazakhstan (87.0%, a difference of 0.010%), Mongolian (87.0%, a difference of 0.020%), Swiss (87.0%, a difference of 0.030%), and Egyptian (87.1%, a difference of 0.050%).
| Demographics | Rating | Rank | GED/Equivalency |
| Indians (Asian) | 95.9 /100 | #105 | Exceptional 87.1% |
| Immigrants | Zimbabwe | 95.8 /100 | #106 | Exceptional 87.1% |
| Icelanders | 95.7 /100 | #107 | Exceptional 87.1% |
| Canadians | 95.6 /100 | #108 | Exceptional 87.1% |
| Immigrants | Eastern Europe | 95.5 /100 | #109 | Exceptional 87.1% |
| Egyptians | 95.3 /100 | #110 | Exceptional 87.1% |
| French | 95.2 /100 | #111 | Exceptional 87.1% |
| Tlingit-Haida | 94.8 /100 | #112 | Exceptional 87.0% |
| Assyrians/Chaldeans/Syriacs | 94.8 /100 | #113 | Exceptional 87.0% |
| Immigrants | Kazakhstan | 94.7 /100 | #114 | Exceptional 87.0% |
| Mongolians | 94.6 /100 | #115 | Exceptional 87.0% |
| Swiss | 94.5 /100 | #116 | Exceptional 87.0% |
| Immigrants | Hong Kong | 93.8 /100 | #117 | Exceptional 86.9% |
| French Canadians | 93.2 /100 | #118 | Exceptional 86.9% |
| Immigrants | China | 93.2 /100 | #119 | Exceptional 86.9% |
Demographics Similar to Ecuadorians by GED/Equivalency
In terms of ged/equivalency, the demographic groups most similar to Ecuadorians are Fijian (81.6%, a difference of 0.070%), Dutch West Indian (81.6%, a difference of 0.13%), Ute (81.8%, a difference of 0.14%), Immigrants from Haiti (81.6%, a difference of 0.16%), and Immigrants from Portugal (81.6%, a difference of 0.17%).
| Demographics | Rating | Rank | GED/Equivalency |
| Paiute | 0.0 /100 | #292 | Tragic 82.0% |
| British West Indians | 0.0 /100 | #293 | Tragic 82.0% |
| Immigrants | St. Vincent and the Grenadines | 0.0 /100 | #294 | Tragic 82.0% |
| Nepalese | 0.0 /100 | #295 | Tragic 81.9% |
| Vietnamese | 0.0 /100 | #296 | Tragic 81.9% |
| Immigrants | Bangladesh | 0.0 /100 | #297 | Tragic 81.9% |
| Ute | 0.0 /100 | #298 | Tragic 81.8% |
| Ecuadorians | 0.0 /100 | #299 | Tragic 81.7% |
| Fijians | 0.0 /100 | #300 | Tragic 81.6% |
| Dutch West Indians | 0.0 /100 | #301 | Tragic 81.6% |
| Immigrants | Haiti | 0.0 /100 | #302 | Tragic 81.6% |
| Immigrants | Portugal | 0.0 /100 | #303 | Tragic 81.6% |
| Navajo | 0.0 /100 | #304 | Tragic 81.5% |
| Immigrants | Grenada | 0.0 /100 | #305 | Tragic 81.3% |
| Guyanese | 0.0 /100 | #306 | Tragic 81.3% |