Pueblo vs Immigrants from Caribbean Self-Care Disability
COMPARE
Pueblo
Immigrants from Caribbean
Self-Care Disability
Self-Care Disability Comparison
Pueblo
Immigrants from Caribbean
3.3%
SELF-CARE DISABILITY
0.0/ 100
METRIC RATING
344th/ 347
METRIC RANK
2.8%
SELF-CARE DISABILITY
0.0/ 100
METRIC RATING
312th/ 347
METRIC RANK
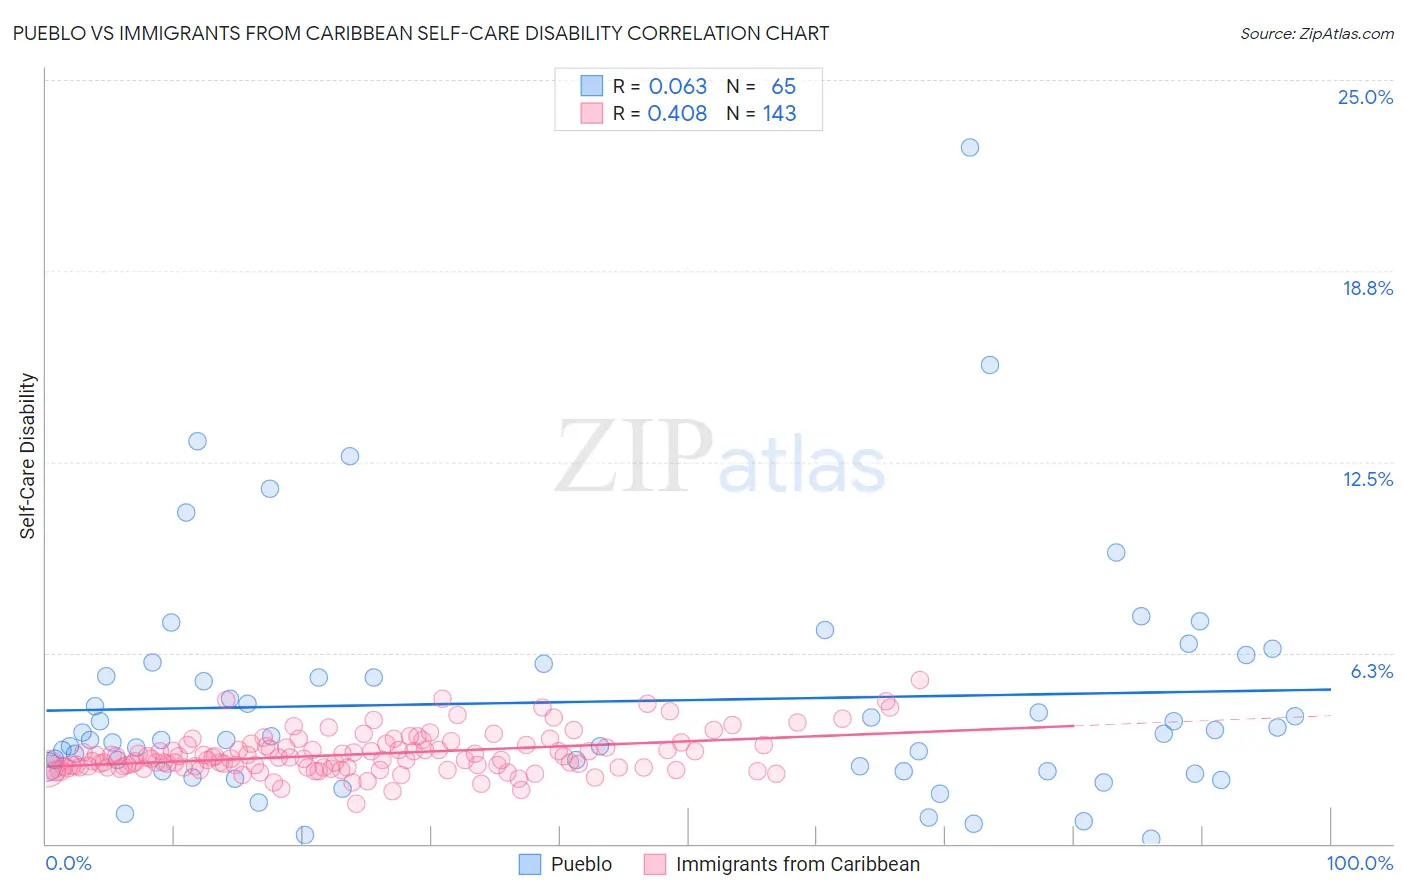
Pueblo vs Immigrants from Caribbean Self-Care Disability Correlation Chart
The statistical analysis conducted on geographies consisting of 120,015,705 people shows a slight positive correlation between the proportion of Pueblo and percentage of population with self-care disability in the United States with a correlation coefficient (R) of 0.063 and weighted average of 3.3%. Similarly, the statistical analysis conducted on geographies consisting of 449,223,668 people shows a moderate positive correlation between the proportion of Immigrants from Caribbean and percentage of population with self-care disability in the United States with a correlation coefficient (R) of 0.408 and weighted average of 2.8%, a difference of 15.3%.
Self-Care Disability Correlation Summary
| Measurement | Pueblo | Immigrants from Caribbean |
| Minimum | 0.17% | 1.3% |
| Maximum | 22.8% | 5.4% |
| Range | 22.6% | 4.1% |
| Mean | 4.7% | 2.9% |
| Median | 3.5% | 2.8% |
| Interquartile 25% (IQ1) | 2.4% | 2.5% |
| Interquartile 75% (IQ3) | 5.7% | 3.2% |
| Interquartile Range (IQR) | 3.3% | 0.74% |
| Standard Deviation (Sample) | 3.9% | 0.67% |
| Standard Deviation (Population) | 3.8% | 0.66% |
Similar Demographics by Self-Care Disability
Demographics Similar to Pueblo by Self-Care Disability
In terms of self-care disability, the demographic groups most similar to Pueblo are Armenian (3.4%, a difference of 4.5%), Tohono O'odham (3.1%, a difference of 4.6%), Colville (3.1%, a difference of 4.7%), Dominican (3.1%, a difference of 6.4%), and Immigrants from Cabo Verde (3.1%, a difference of 6.7%).
| Demographics | Rating | Rank | Self-Care Disability |
| Dutch West Indians | 0.0 /100 | #333 | Tragic 3.0% |
| Houma | 0.0 /100 | #334 | Tragic 3.0% |
| Immigrants | Azores | 0.0 /100 | #335 | Tragic 3.0% |
| Immigrants | Yemen | 0.0 /100 | #336 | Tragic 3.0% |
| Choctaw | 0.0 /100 | #337 | Tragic 3.0% |
| Cape Verdeans | 0.0 /100 | #338 | Tragic 3.0% |
| Immigrants | Dominican Republic | 0.0 /100 | #339 | Tragic 3.0% |
| Immigrants | Cabo Verde | 0.0 /100 | #340 | Tragic 3.1% |
| Dominicans | 0.0 /100 | #341 | Tragic 3.1% |
| Colville | 0.0 /100 | #342 | Tragic 3.1% |
| Tohono O'odham | 0.0 /100 | #343 | Tragic 3.1% |
| Pueblo | 0.0 /100 | #344 | Tragic 3.3% |
| Armenians | 0.0 /100 | #345 | Tragic 3.4% |
| Puerto Ricans | 0.0 /100 | #346 | Tragic 3.7% |
| Immigrants | Armenia | 0.0 /100 | #347 | Tragic 4.2% |
Demographics Similar to Immigrants from Caribbean by Self-Care Disability
In terms of self-care disability, the demographic groups most similar to Immigrants from Caribbean are Spanish American (2.8%, a difference of 0.030%), Puget Sound Salish (2.8%, a difference of 0.19%), Creek (2.8%, a difference of 0.25%), British West Indian (2.8%, a difference of 0.26%), and Bangladeshi (2.8%, a difference of 0.36%).
| Demographics | Rating | Rank | Self-Care Disability |
| Immigrants | West Indies | 0.0 /100 | #305 | Tragic 2.8% |
| Aleuts | 0.0 /100 | #306 | Tragic 2.8% |
| Natives/Alaskans | 0.0 /100 | #307 | Tragic 2.8% |
| Immigrants | Grenada | 0.0 /100 | #308 | Tragic 2.8% |
| Bangladeshis | 0.0 /100 | #309 | Tragic 2.8% |
| British West Indians | 0.0 /100 | #310 | Tragic 2.8% |
| Puget Sound Salish | 0.0 /100 | #311 | Tragic 2.8% |
| Immigrants | Caribbean | 0.0 /100 | #312 | Tragic 2.8% |
| Spanish Americans | 0.0 /100 | #313 | Tragic 2.8% |
| Creek | 0.0 /100 | #314 | Tragic 2.8% |
| Immigrants | Cuba | 0.0 /100 | #315 | Tragic 2.8% |
| Menominee | 0.0 /100 | #316 | Tragic 2.8% |
| Immigrants | Dominica | 0.0 /100 | #317 | Tragic 2.8% |
| Assyrians/Chaldeans/Syriacs | 0.0 /100 | #318 | Tragic 2.8% |
| Spanish American Indians | 0.0 /100 | #319 | Tragic 2.9% |