Nonimmigrants vs Pakistani Self-Care Disability
COMPARE
Nonimmigrants
Pakistani
Self-Care Disability
Self-Care Disability Comparison
Nonimmigrants
Pakistanis
2.6%
SELF-CARE DISABILITY
0.3/ 100
METRIC RATING
258th/ 347
METRIC RANK
2.4%
SELF-CARE DISABILITY
71.4/ 100
METRIC RATING
155th/ 347
METRIC RANK
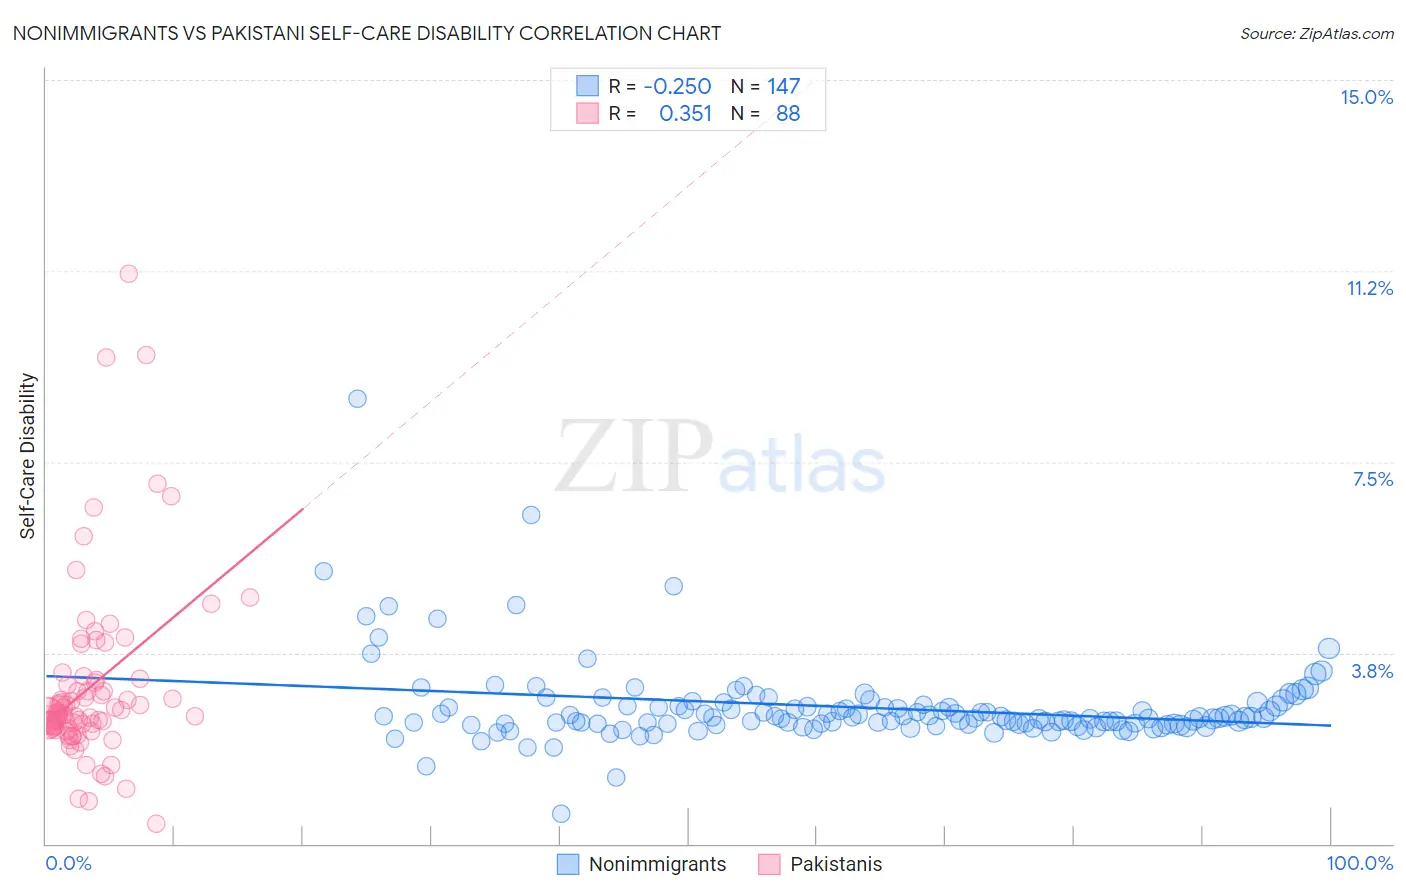
Nonimmigrants vs Pakistani Self-Care Disability Correlation Chart
The statistical analysis conducted on geographies consisting of 581,524,838 people shows a weak negative correlation between the proportion of Nonimmigrants and percentage of population with self-care disability in the United States with a correlation coefficient (R) of -0.250 and weighted average of 2.6%. Similarly, the statistical analysis conducted on geographies consisting of 334,999,901 people shows a mild positive correlation between the proportion of Pakistanis and percentage of population with self-care disability in the United States with a correlation coefficient (R) of 0.351 and weighted average of 2.4%, a difference of 8.3%.
Self-Care Disability Correlation Summary
| Measurement | Nonimmigrants | Pakistani |
| Minimum | 0.58% | 0.40% |
| Maximum | 8.7% | 11.2% |
| Range | 8.1% | 10.8% |
| Mean | 2.7% | 3.1% |
| Median | 2.5% | 2.5% |
| Interquartile 25% (IQ1) | 2.3% | 2.3% |
| Interquartile 75% (IQ3) | 2.7% | 3.2% |
| Interquartile Range (IQR) | 0.36% | 0.89% |
| Standard Deviation (Sample) | 0.84% | 1.8% |
| Standard Deviation (Population) | 0.84% | 1.8% |
Similar Demographics by Self-Care Disability
Demographics Similar to Nonimmigrants by Self-Care Disability
In terms of self-care disability, the demographic groups most similar to Nonimmigrants are Potawatomi (2.6%, a difference of 0.070%), Immigrants from Belarus (2.6%, a difference of 0.070%), Chippewa (2.6%, a difference of 0.11%), Arapaho (2.6%, a difference of 0.13%), and Immigrants from Central America (2.6%, a difference of 0.27%).
| Demographics | Rating | Rank | Self-Care Disability |
| Immigrants | Liberia | 0.4 /100 | #251 | Tragic 2.6% |
| Immigrants | Bangladesh | 0.4 /100 | #252 | Tragic 2.6% |
| Immigrants | Haiti | 0.3 /100 | #253 | Tragic 2.6% |
| Haitians | 0.3 /100 | #254 | Tragic 2.6% |
| Tsimshian | 0.3 /100 | #255 | Tragic 2.6% |
| Immigrants | Central America | 0.3 /100 | #256 | Tragic 2.6% |
| Potawatomi | 0.3 /100 | #257 | Tragic 2.6% |
| Immigrants | Nonimmigrants | 0.3 /100 | #258 | Tragic 2.6% |
| Immigrants | Belarus | 0.2 /100 | #259 | Tragic 2.6% |
| Chippewa | 0.2 /100 | #260 | Tragic 2.6% |
| Arapaho | 0.2 /100 | #261 | Tragic 2.6% |
| Shoshone | 0.2 /100 | #262 | Tragic 2.7% |
| Immigrants | Latin America | 0.2 /100 | #263 | Tragic 2.7% |
| Immigrants | Iran | 0.2 /100 | #264 | Tragic 2.7% |
| Immigrants | Nicaragua | 0.2 /100 | #265 | Tragic 2.7% |
Demographics Similar to Pakistanis by Self-Care Disability
In terms of self-care disability, the demographic groups most similar to Pakistanis are Italian (2.4%, a difference of 0.050%), Nigerian (2.4%, a difference of 0.050%), Immigrants from Europe (2.4%, a difference of 0.11%), Immigrants from England (2.4%, a difference of 0.12%), and Tlingit-Haida (2.4%, a difference of 0.13%).
| Demographics | Rating | Rank | Self-Care Disability |
| Romanians | 75.8 /100 | #148 | Good 2.4% |
| Arabs | 75.7 /100 | #149 | Good 2.4% |
| Immigrants | Costa Rica | 75.1 /100 | #150 | Good 2.4% |
| Basques | 74.0 /100 | #151 | Good 2.4% |
| Tlingit-Haida | 73.5 /100 | #152 | Good 2.4% |
| Immigrants | England | 73.5 /100 | #153 | Good 2.4% |
| Italians | 72.2 /100 | #154 | Good 2.4% |
| Pakistanis | 71.4 /100 | #155 | Good 2.4% |
| Nigerians | 70.6 /100 | #156 | Good 2.4% |
| Immigrants | Europe | 69.6 /100 | #157 | Good 2.4% |
| Immigrants | Western Europe | 68.6 /100 | #158 | Good 2.4% |
| Immigrants | Italy | 68.5 /100 | #159 | Good 2.4% |
| Finns | 67.0 /100 | #160 | Good 2.4% |
| Lebanese | 66.5 /100 | #161 | Good 2.4% |
| Somalis | 63.7 /100 | #162 | Good 2.5% |