Nonimmigrants vs Immigrants from Zaire Self-Care Disability
COMPARE
Nonimmigrants
Immigrants from Zaire
Self-Care Disability
Self-Care Disability Comparison
Nonimmigrants
Immigrants from Zaire
2.6%
SELF-CARE DISABILITY
0.3/ 100
METRIC RATING
258th/ 347
METRIC RANK
2.3%
SELF-CARE DISABILITY
99.2/ 100
METRIC RATING
68th/ 347
METRIC RANK
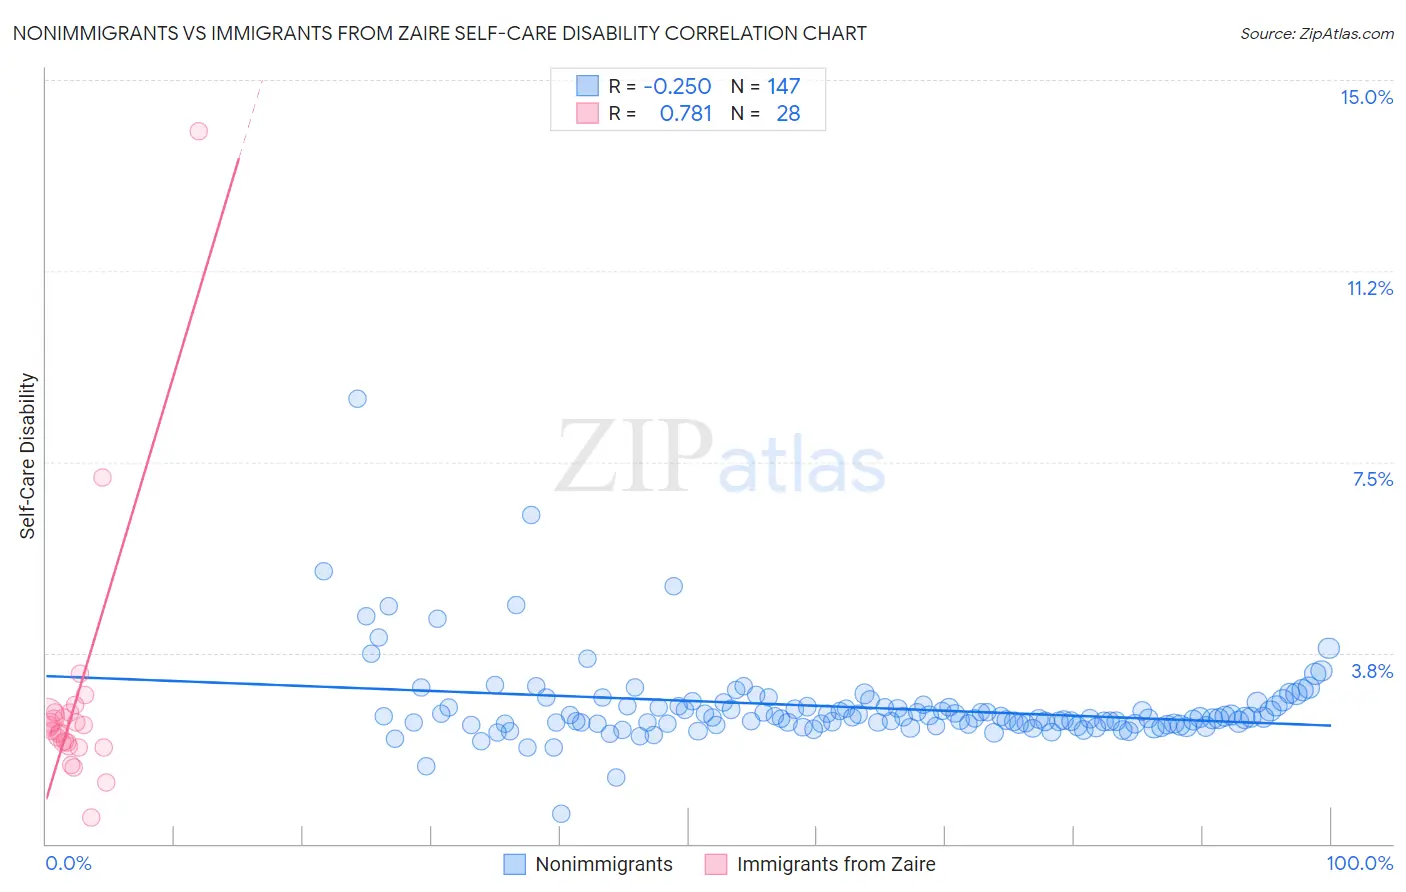
Nonimmigrants vs Immigrants from Zaire Self-Care Disability Correlation Chart
The statistical analysis conducted on geographies consisting of 581,524,838 people shows a weak negative correlation between the proportion of Nonimmigrants and percentage of population with self-care disability in the United States with a correlation coefficient (R) of -0.250 and weighted average of 2.6%. Similarly, the statistical analysis conducted on geographies consisting of 107,230,784 people shows a strong positive correlation between the proportion of Immigrants from Zaire and percentage of population with self-care disability in the United States with a correlation coefficient (R) of 0.781 and weighted average of 2.3%, a difference of 13.7%.
Self-Care Disability Correlation Summary
| Measurement | Nonimmigrants | Immigrants from Zaire |
| Minimum | 0.58% | 0.51% |
| Maximum | 8.7% | 14.0% |
| Range | 8.1% | 13.5% |
| Mean | 2.7% | 2.8% |
| Median | 2.5% | 2.3% |
| Interquartile 25% (IQ1) | 2.3% | 1.9% |
| Interquartile 75% (IQ3) | 2.7% | 2.5% |
| Interquartile Range (IQR) | 0.36% | 0.59% |
| Standard Deviation (Sample) | 0.84% | 2.5% |
| Standard Deviation (Population) | 0.84% | 2.4% |
Similar Demographics by Self-Care Disability
Demographics Similar to Nonimmigrants by Self-Care Disability
In terms of self-care disability, the demographic groups most similar to Nonimmigrants are Potawatomi (2.6%, a difference of 0.070%), Immigrants from Belarus (2.6%, a difference of 0.070%), Chippewa (2.6%, a difference of 0.11%), Arapaho (2.6%, a difference of 0.13%), and Immigrants from Central America (2.6%, a difference of 0.27%).
| Demographics | Rating | Rank | Self-Care Disability |
| Immigrants | Liberia | 0.4 /100 | #251 | Tragic 2.6% |
| Immigrants | Bangladesh | 0.4 /100 | #252 | Tragic 2.6% |
| Immigrants | Haiti | 0.3 /100 | #253 | Tragic 2.6% |
| Haitians | 0.3 /100 | #254 | Tragic 2.6% |
| Tsimshian | 0.3 /100 | #255 | Tragic 2.6% |
| Immigrants | Central America | 0.3 /100 | #256 | Tragic 2.6% |
| Potawatomi | 0.3 /100 | #257 | Tragic 2.6% |
| Immigrants | Nonimmigrants | 0.3 /100 | #258 | Tragic 2.6% |
| Immigrants | Belarus | 0.2 /100 | #259 | Tragic 2.6% |
| Chippewa | 0.2 /100 | #260 | Tragic 2.6% |
| Arapaho | 0.2 /100 | #261 | Tragic 2.6% |
| Shoshone | 0.2 /100 | #262 | Tragic 2.7% |
| Immigrants | Latin America | 0.2 /100 | #263 | Tragic 2.7% |
| Immigrants | Iran | 0.2 /100 | #264 | Tragic 2.7% |
| Immigrants | Nicaragua | 0.2 /100 | #265 | Tragic 2.7% |
Demographics Similar to Immigrants from Zaire by Self-Care Disability
In terms of self-care disability, the demographic groups most similar to Immigrants from Zaire are Immigrants from Norway (2.3%, a difference of 0.0%), Immigrants from Northern Europe (2.3%, a difference of 0.040%), Asian (2.3%, a difference of 0.070%), South African (2.3%, a difference of 0.090%), and Eastern European (2.3%, a difference of 0.10%).
| Demographics | Rating | Rank | Self-Care Disability |
| Palestinians | 99.4 /100 | #61 | Exceptional 2.3% |
| Egyptians | 99.4 /100 | #62 | Exceptional 2.3% |
| Mongolians | 99.3 /100 | #63 | Exceptional 2.3% |
| Swedes | 99.3 /100 | #64 | Exceptional 2.3% |
| Brazilians | 99.3 /100 | #65 | Exceptional 2.3% |
| Immigrants | Argentina | 99.3 /100 | #66 | Exceptional 2.3% |
| South Africans | 99.3 /100 | #67 | Exceptional 2.3% |
| Immigrants | Zaire | 99.2 /100 | #68 | Exceptional 2.3% |
| Immigrants | Norway | 99.2 /100 | #69 | Exceptional 2.3% |
| Immigrants | Northern Europe | 99.2 /100 | #70 | Exceptional 2.3% |
| Asians | 99.2 /100 | #71 | Exceptional 2.3% |
| Eastern Europeans | 99.2 /100 | #72 | Exceptional 2.3% |
| Immigrants | Egypt | 99.1 /100 | #73 | Exceptional 2.3% |
| Immigrants | Switzerland | 99.1 /100 | #74 | Exceptional 2.3% |
| Immigrants | Netherlands | 99.1 /100 | #75 | Exceptional 2.3% |