Barbadian vs Alaskan Athabascan Self-Care Disability
COMPARE
Barbadian
Alaskan Athabascan
Self-Care Disability
Self-Care Disability Comparison
Barbadians
Alaskan Athabascans
2.7%
SELF-CARE DISABILITY
0.0/ 100
METRIC RATING
295th/ 347
METRIC RANK
2.5%
SELF-CARE DISABILITY
10.4/ 100
METRIC RATING
206th/ 347
METRIC RANK
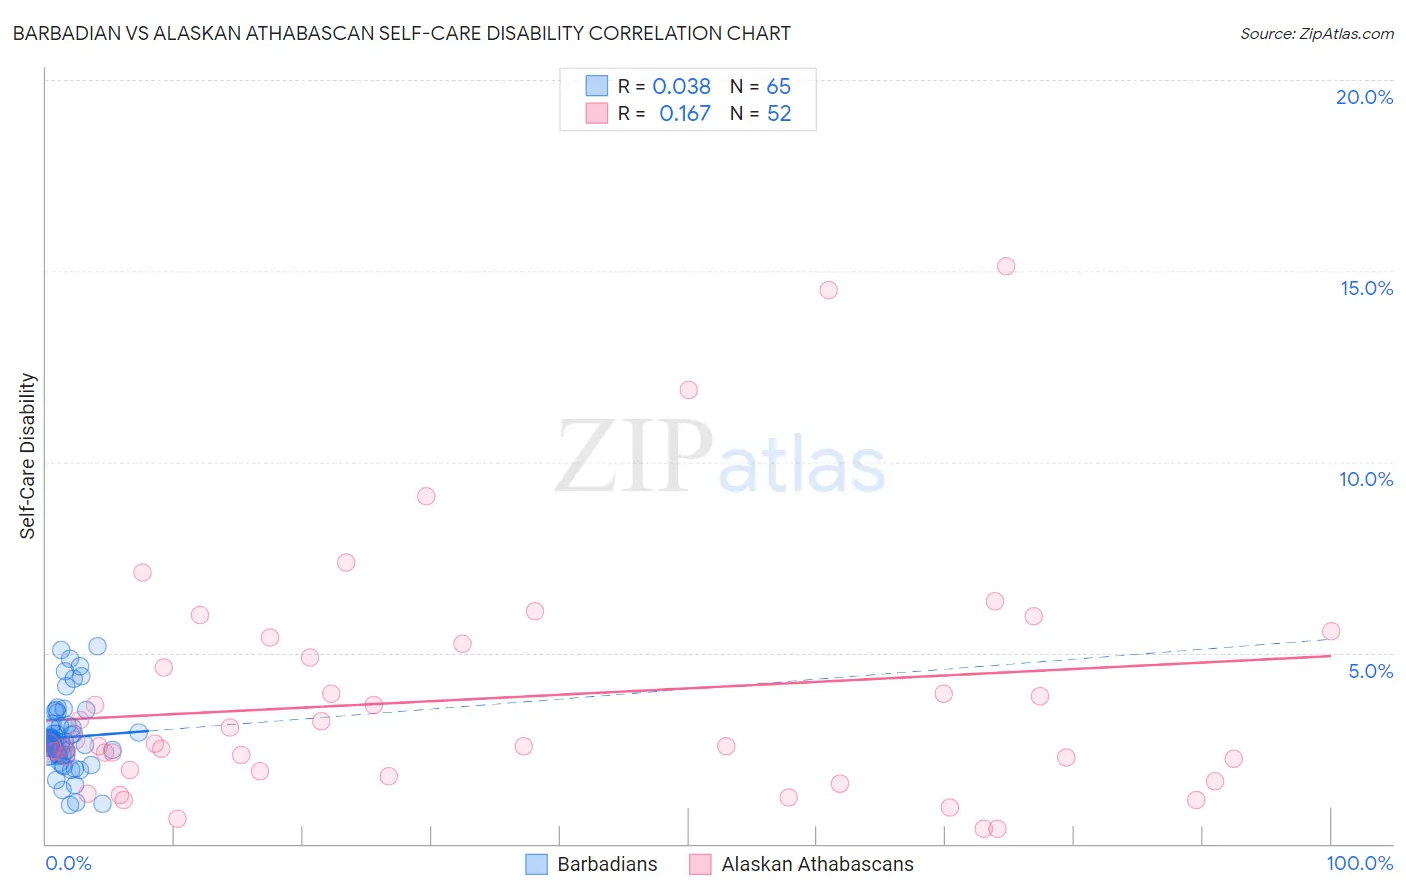
Barbadian vs Alaskan Athabascan Self-Care Disability Correlation Chart
The statistical analysis conducted on geographies consisting of 141,243,740 people shows no correlation between the proportion of Barbadians and percentage of population with self-care disability in the United States with a correlation coefficient (R) of 0.038 and weighted average of 2.7%. Similarly, the statistical analysis conducted on geographies consisting of 45,796,895 people shows a poor positive correlation between the proportion of Alaskan Athabascans and percentage of population with self-care disability in the United States with a correlation coefficient (R) of 0.167 and weighted average of 2.5%, a difference of 8.6%.
Self-Care Disability Correlation Summary
| Measurement | Barbadian | Alaskan Athabascan |
| Minimum | 1.0% | 0.38% |
| Maximum | 5.2% | 15.1% |
| Range | 4.2% | 14.7% |
| Mean | 2.8% | 3.8% |
| Median | 2.7% | 2.6% |
| Interquartile 25% (IQ1) | 2.3% | 1.9% |
| Interquartile 75% (IQ3) | 3.1% | 5.0% |
| Interquartile Range (IQR) | 0.76% | 3.1% |
| Standard Deviation (Sample) | 0.90% | 3.2% |
| Standard Deviation (Population) | 0.90% | 3.1% |
Similar Demographics by Self-Care Disability
Demographics Similar to Barbadians by Self-Care Disability
In terms of self-care disability, the demographic groups most similar to Barbadians are Blackfeet (2.7%, a difference of 0.14%), Central American Indian (2.7%, a difference of 0.15%), Belizean (2.7%, a difference of 0.15%), Guyanese (2.7%, a difference of 0.31%), and Immigrants from Portugal (2.8%, a difference of 0.43%).
| Demographics | Rating | Rank | Self-Care Disability |
| Immigrants | Barbados | 0.0 /100 | #288 | Tragic 2.7% |
| Africans | 0.0 /100 | #289 | Tragic 2.7% |
| Cubans | 0.0 /100 | #290 | Tragic 2.7% |
| Guyanese | 0.0 /100 | #291 | Tragic 2.7% |
| Central American Indians | 0.0 /100 | #292 | Tragic 2.7% |
| Belizeans | 0.0 /100 | #293 | Tragic 2.7% |
| Blackfeet | 0.0 /100 | #294 | Tragic 2.7% |
| Barbadians | 0.0 /100 | #295 | Tragic 2.7% |
| Immigrants | Portugal | 0.0 /100 | #296 | Tragic 2.8% |
| West Indians | 0.0 /100 | #297 | Tragic 2.8% |
| Americans | 0.0 /100 | #298 | Tragic 2.8% |
| Immigrants | Guyana | 0.0 /100 | #299 | Tragic 2.8% |
| Immigrants | Fiji | 0.0 /100 | #300 | Tragic 2.8% |
| Pima | 0.0 /100 | #301 | Tragic 2.8% |
| Immigrants | St. Vincent and the Grenadines | 0.0 /100 | #302 | Tragic 2.8% |
Demographics Similar to Alaskan Athabascans by Self-Care Disability
In terms of self-care disability, the demographic groups most similar to Alaskan Athabascans are French (2.5%, a difference of 0.060%), Immigrants from Russia (2.5%, a difference of 0.080%), Immigrants from Bahamas (2.5%, a difference of 0.18%), Central American (2.5%, a difference of 0.23%), and Immigrants from Lebanon (2.5%, a difference of 0.24%).
| Demographics | Rating | Rank | Self-Care Disability |
| Immigrants | Ghana | 14.7 /100 | #199 | Poor 2.5% |
| Immigrants | Western Africa | 13.3 /100 | #200 | Poor 2.5% |
| Immigrants | South Eastern Asia | 12.9 /100 | #201 | Poor 2.5% |
| Slovaks | 12.6 /100 | #202 | Poor 2.5% |
| Immigrants | Lebanon | 12.4 /100 | #203 | Poor 2.5% |
| Immigrants | Bahamas | 11.9 /100 | #204 | Poor 2.5% |
| Immigrants | Russia | 11.0 /100 | #205 | Poor 2.5% |
| Alaskan Athabascans | 10.4 /100 | #206 | Poor 2.5% |
| French | 9.9 /100 | #207 | Tragic 2.5% |
| Central Americans | 8.7 /100 | #208 | Tragic 2.5% |
| Malaysians | 7.7 /100 | #209 | Tragic 2.5% |
| Panamanians | 6.4 /100 | #210 | Tragic 2.5% |
| Native Hawaiians | 5.1 /100 | #211 | Tragic 2.6% |
| Samoans | 5.1 /100 | #212 | Tragic 2.6% |
| Ecuadorians | 4.7 /100 | #213 | Tragic 2.6% |