Barbadian vs Lumbee Self-Care Disability
COMPARE
Barbadian
Lumbee
Self-Care Disability
Self-Care Disability Comparison
Barbadians
Lumbee
2.7%
SELF-CARE DISABILITY
0.0/ 100
METRIC RATING
295th/ 347
METRIC RANK
3.0%
SELF-CARE DISABILITY
0.0/ 100
METRIC RATING
331st/ 347
METRIC RANK
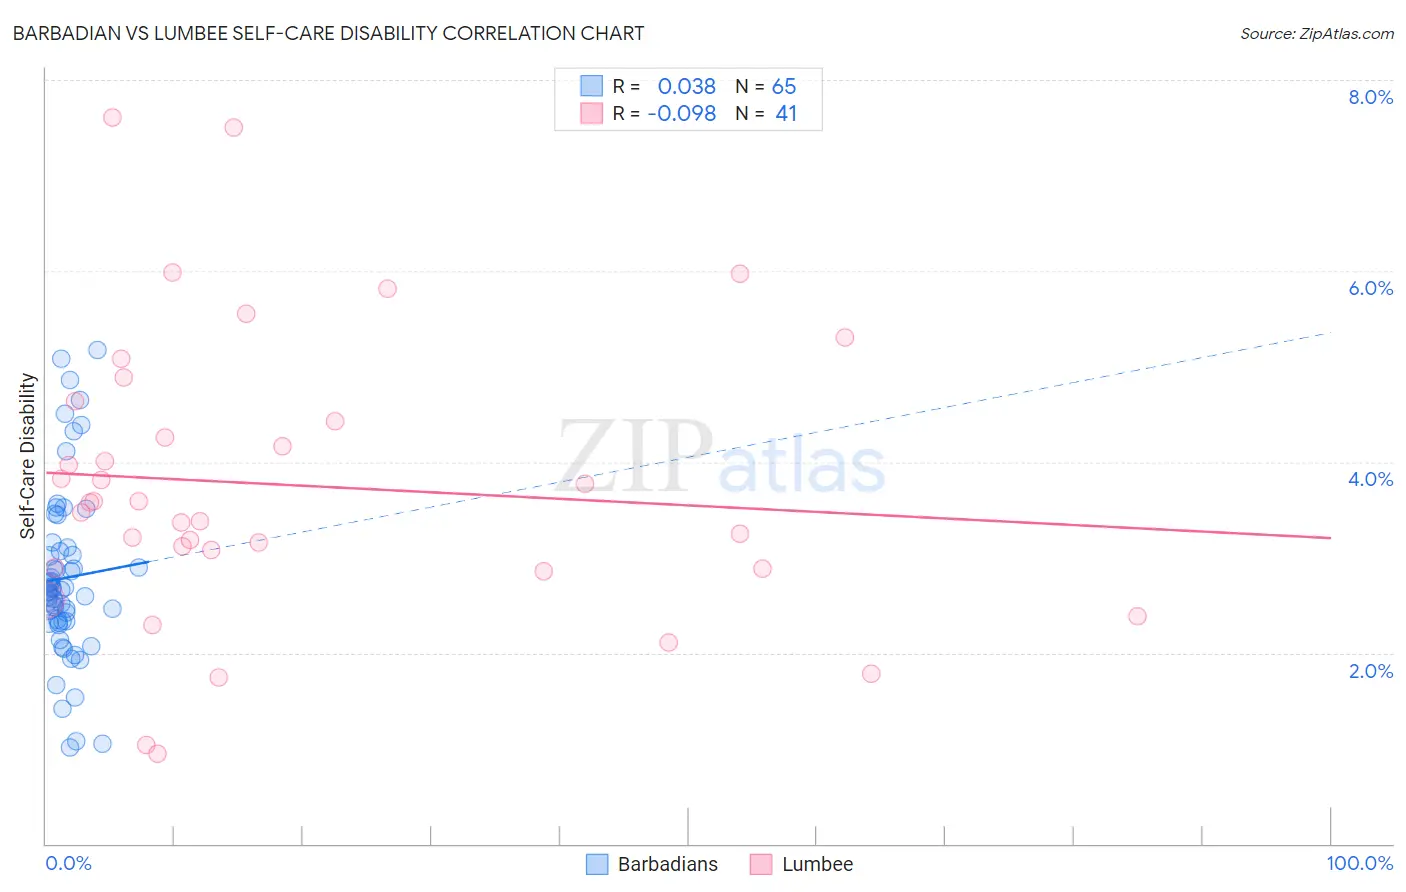
Barbadian vs Lumbee Self-Care Disability Correlation Chart
The statistical analysis conducted on geographies consisting of 141,243,740 people shows no correlation between the proportion of Barbadians and percentage of population with self-care disability in the United States with a correlation coefficient (R) of 0.038 and weighted average of 2.7%. Similarly, the statistical analysis conducted on geographies consisting of 92,217,287 people shows a slight negative correlation between the proportion of Lumbee and percentage of population with self-care disability in the United States with a correlation coefficient (R) of -0.098 and weighted average of 3.0%, a difference of 8.0%.
Self-Care Disability Correlation Summary
| Measurement | Barbadian | Lumbee |
| Minimum | 1.0% | 0.94% |
| Maximum | 5.2% | 7.6% |
| Range | 4.2% | 6.7% |
| Mean | 2.8% | 3.8% |
| Median | 2.7% | 3.6% |
| Interquartile 25% (IQ1) | 2.3% | 2.9% |
| Interquartile 75% (IQ3) | 3.1% | 4.5% |
| Interquartile Range (IQR) | 0.76% | 1.6% |
| Standard Deviation (Sample) | 0.90% | 1.5% |
| Standard Deviation (Population) | 0.90% | 1.5% |
Similar Demographics by Self-Care Disability
Demographics Similar to Barbadians by Self-Care Disability
In terms of self-care disability, the demographic groups most similar to Barbadians are Blackfeet (2.7%, a difference of 0.14%), Central American Indian (2.7%, a difference of 0.15%), Belizean (2.7%, a difference of 0.15%), Guyanese (2.7%, a difference of 0.31%), and Immigrants from Portugal (2.8%, a difference of 0.43%).
| Demographics | Rating | Rank | Self-Care Disability |
| Immigrants | Barbados | 0.0 /100 | #288 | Tragic 2.7% |
| Africans | 0.0 /100 | #289 | Tragic 2.7% |
| Cubans | 0.0 /100 | #290 | Tragic 2.7% |
| Guyanese | 0.0 /100 | #291 | Tragic 2.7% |
| Central American Indians | 0.0 /100 | #292 | Tragic 2.7% |
| Belizeans | 0.0 /100 | #293 | Tragic 2.7% |
| Blackfeet | 0.0 /100 | #294 | Tragic 2.7% |
| Barbadians | 0.0 /100 | #295 | Tragic 2.7% |
| Immigrants | Portugal | 0.0 /100 | #296 | Tragic 2.8% |
| West Indians | 0.0 /100 | #297 | Tragic 2.8% |
| Americans | 0.0 /100 | #298 | Tragic 2.8% |
| Immigrants | Guyana | 0.0 /100 | #299 | Tragic 2.8% |
| Immigrants | Fiji | 0.0 /100 | #300 | Tragic 2.8% |
| Pima | 0.0 /100 | #301 | Tragic 2.8% |
| Immigrants | St. Vincent and the Grenadines | 0.0 /100 | #302 | Tragic 2.8% |
Demographics Similar to Lumbee by Self-Care Disability
In terms of self-care disability, the demographic groups most similar to Lumbee are Nepalese (3.0%, a difference of 0.12%), Kiowa (3.0%, a difference of 0.36%), Dutch West Indian (3.0%, a difference of 0.59%), Houma (3.0%, a difference of 0.66%), and Immigrants from the Azores (3.0%, a difference of 0.71%).
| Demographics | Rating | Rank | Self-Care Disability |
| Cherokee | 0.0 /100 | #324 | Tragic 2.9% |
| Immigrants | Uzbekistan | 0.0 /100 | #325 | Tragic 2.9% |
| Paiute | 0.0 /100 | #326 | Tragic 2.9% |
| Blacks/African Americans | 0.0 /100 | #327 | Tragic 2.9% |
| Hopi | 0.0 /100 | #328 | Tragic 2.9% |
| Cajuns | 0.0 /100 | #329 | Tragic 2.9% |
| Nepalese | 0.0 /100 | #330 | Tragic 3.0% |
| Lumbee | 0.0 /100 | #331 | Tragic 3.0% |
| Kiowa | 0.0 /100 | #332 | Tragic 3.0% |
| Dutch West Indians | 0.0 /100 | #333 | Tragic 3.0% |
| Houma | 0.0 /100 | #334 | Tragic 3.0% |
| Immigrants | Azores | 0.0 /100 | #335 | Tragic 3.0% |
| Immigrants | Yemen | 0.0 /100 | #336 | Tragic 3.0% |
| Choctaw | 0.0 /100 | #337 | Tragic 3.0% |
| Cape Verdeans | 0.0 /100 | #338 | Tragic 3.0% |