Barbadian vs Czechoslovakian Self-Care Disability
COMPARE
Barbadian
Czechoslovakian
Self-Care Disability
Self-Care Disability Comparison
Barbadians
Czechoslovakians
2.7%
SELF-CARE DISABILITY
0.0/ 100
METRIC RATING
295th/ 347
METRIC RANK
2.5%
SELF-CARE DISABILITY
53.5/ 100
METRIC RATING
172nd/ 347
METRIC RANK
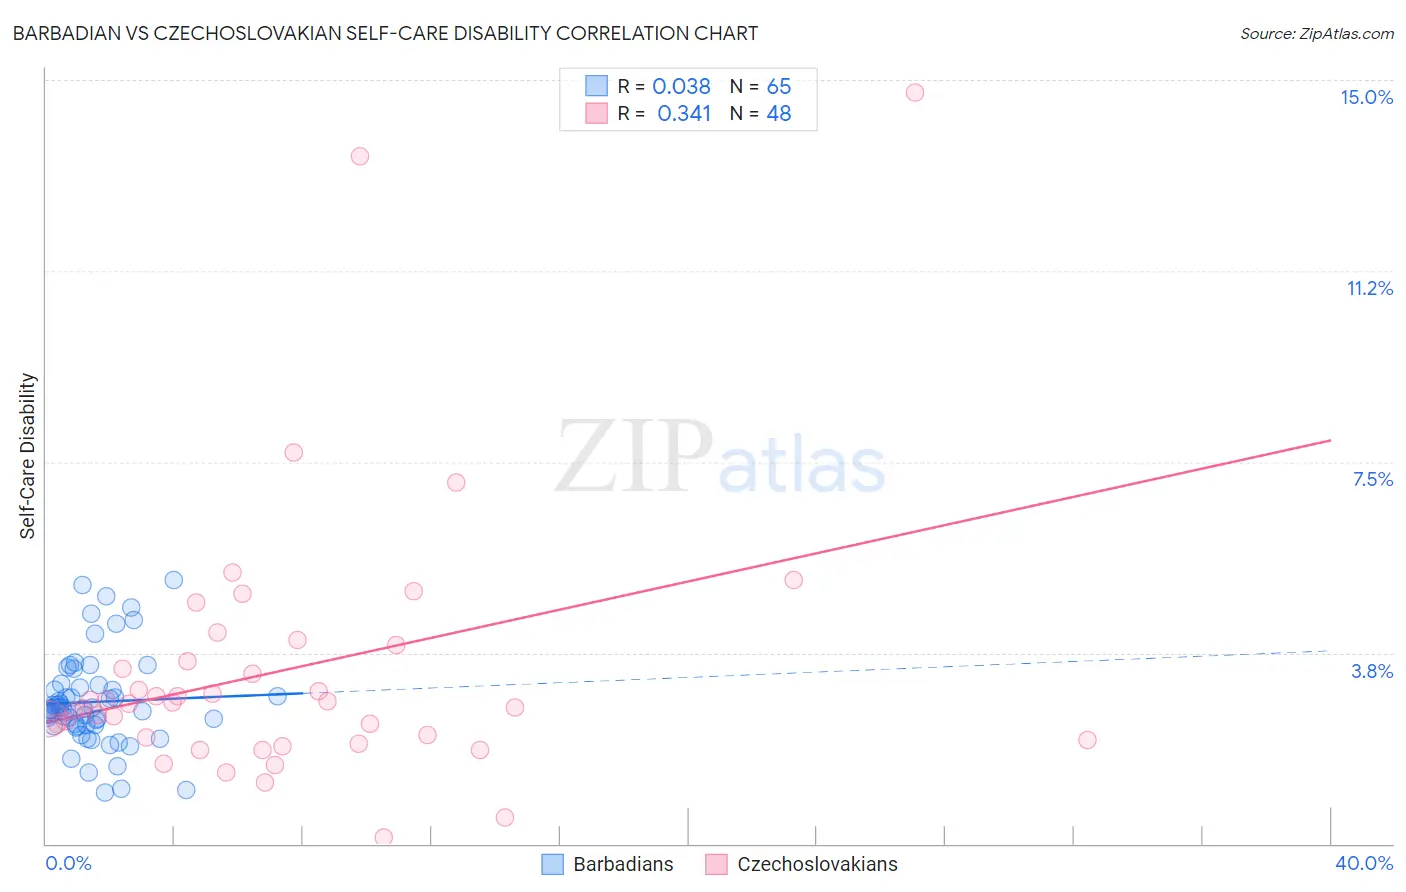
Barbadian vs Czechoslovakian Self-Care Disability Correlation Chart
The statistical analysis conducted on geographies consisting of 141,243,740 people shows no correlation between the proportion of Barbadians and percentage of population with self-care disability in the United States with a correlation coefficient (R) of 0.038 and weighted average of 2.7%. Similarly, the statistical analysis conducted on geographies consisting of 368,314,716 people shows a mild positive correlation between the proportion of Czechoslovakians and percentage of population with self-care disability in the United States with a correlation coefficient (R) of 0.341 and weighted average of 2.5%, a difference of 11.5%.
Self-Care Disability Correlation Summary
| Measurement | Barbadian | Czechoslovakian |
| Minimum | 1.0% | 0.12% |
| Maximum | 5.2% | 14.8% |
| Range | 4.2% | 14.6% |
| Mean | 2.8% | 3.4% |
| Median | 2.7% | 2.8% |
| Interquartile 25% (IQ1) | 2.3% | 2.1% |
| Interquartile 75% (IQ3) | 3.1% | 3.7% |
| Interquartile Range (IQR) | 0.76% | 1.7% |
| Standard Deviation (Sample) | 0.90% | 2.7% |
| Standard Deviation (Population) | 0.90% | 2.7% |
Similar Demographics by Self-Care Disability
Demographics Similar to Barbadians by Self-Care Disability
In terms of self-care disability, the demographic groups most similar to Barbadians are Blackfeet (2.7%, a difference of 0.14%), Central American Indian (2.7%, a difference of 0.15%), Belizean (2.7%, a difference of 0.15%), Guyanese (2.7%, a difference of 0.31%), and Immigrants from Portugal (2.8%, a difference of 0.43%).
| Demographics | Rating | Rank | Self-Care Disability |
| Immigrants | Barbados | 0.0 /100 | #288 | Tragic 2.7% |
| Africans | 0.0 /100 | #289 | Tragic 2.7% |
| Cubans | 0.0 /100 | #290 | Tragic 2.7% |
| Guyanese | 0.0 /100 | #291 | Tragic 2.7% |
| Central American Indians | 0.0 /100 | #292 | Tragic 2.7% |
| Belizeans | 0.0 /100 | #293 | Tragic 2.7% |
| Blackfeet | 0.0 /100 | #294 | Tragic 2.7% |
| Barbadians | 0.0 /100 | #295 | Tragic 2.7% |
| Immigrants | Portugal | 0.0 /100 | #296 | Tragic 2.8% |
| West Indians | 0.0 /100 | #297 | Tragic 2.8% |
| Americans | 0.0 /100 | #298 | Tragic 2.8% |
| Immigrants | Guyana | 0.0 /100 | #299 | Tragic 2.8% |
| Immigrants | Fiji | 0.0 /100 | #300 | Tragic 2.8% |
| Pima | 0.0 /100 | #301 | Tragic 2.8% |
| Immigrants | St. Vincent and the Grenadines | 0.0 /100 | #302 | Tragic 2.8% |
Demographics Similar to Czechoslovakians by Self-Care Disability
In terms of self-care disability, the demographic groups most similar to Czechoslovakians are Pennsylvania German (2.5%, a difference of 0.0%), Immigrants from Burma/Myanmar (2.5%, a difference of 0.030%), Scottish (2.5%, a difference of 0.040%), Immigrants from Somalia (2.5%, a difference of 0.12%), and Welsh (2.5%, a difference of 0.17%).
| Demographics | Rating | Rank | Self-Care Disability |
| Syrians | 59.0 /100 | #165 | Average 2.5% |
| Canadians | 58.8 /100 | #166 | Average 2.5% |
| Immigrants | Greece | 57.3 /100 | #167 | Average 2.5% |
| Ute | 57.1 /100 | #168 | Average 2.5% |
| Immigrants | Somalia | 55.9 /100 | #169 | Average 2.5% |
| Scottish | 54.3 /100 | #170 | Average 2.5% |
| Pennsylvania Germans | 53.5 /100 | #171 | Average 2.5% |
| Czechoslovakians | 53.5 /100 | #172 | Average 2.5% |
| Immigrants | Burma/Myanmar | 52.8 /100 | #173 | Average 2.5% |
| Welsh | 50.0 /100 | #174 | Average 2.5% |
| Immigrants | Bosnia and Herzegovina | 49.6 /100 | #175 | Average 2.5% |
| Immigrants | Afghanistan | 47.6 /100 | #176 | Average 2.5% |
| Immigrants | Kazakhstan | 46.7 /100 | #177 | Average 2.5% |
| English | 46.2 /100 | #178 | Average 2.5% |
| Hungarians | 45.5 /100 | #179 | Average 2.5% |