Zip Codes with the Highest Percentage of Families with Income Above $200,000 in New Hampshire
RELATED REPORTS & OPTIONS
Family Income | $200k+
New Hampshire
Compare Zip Codes
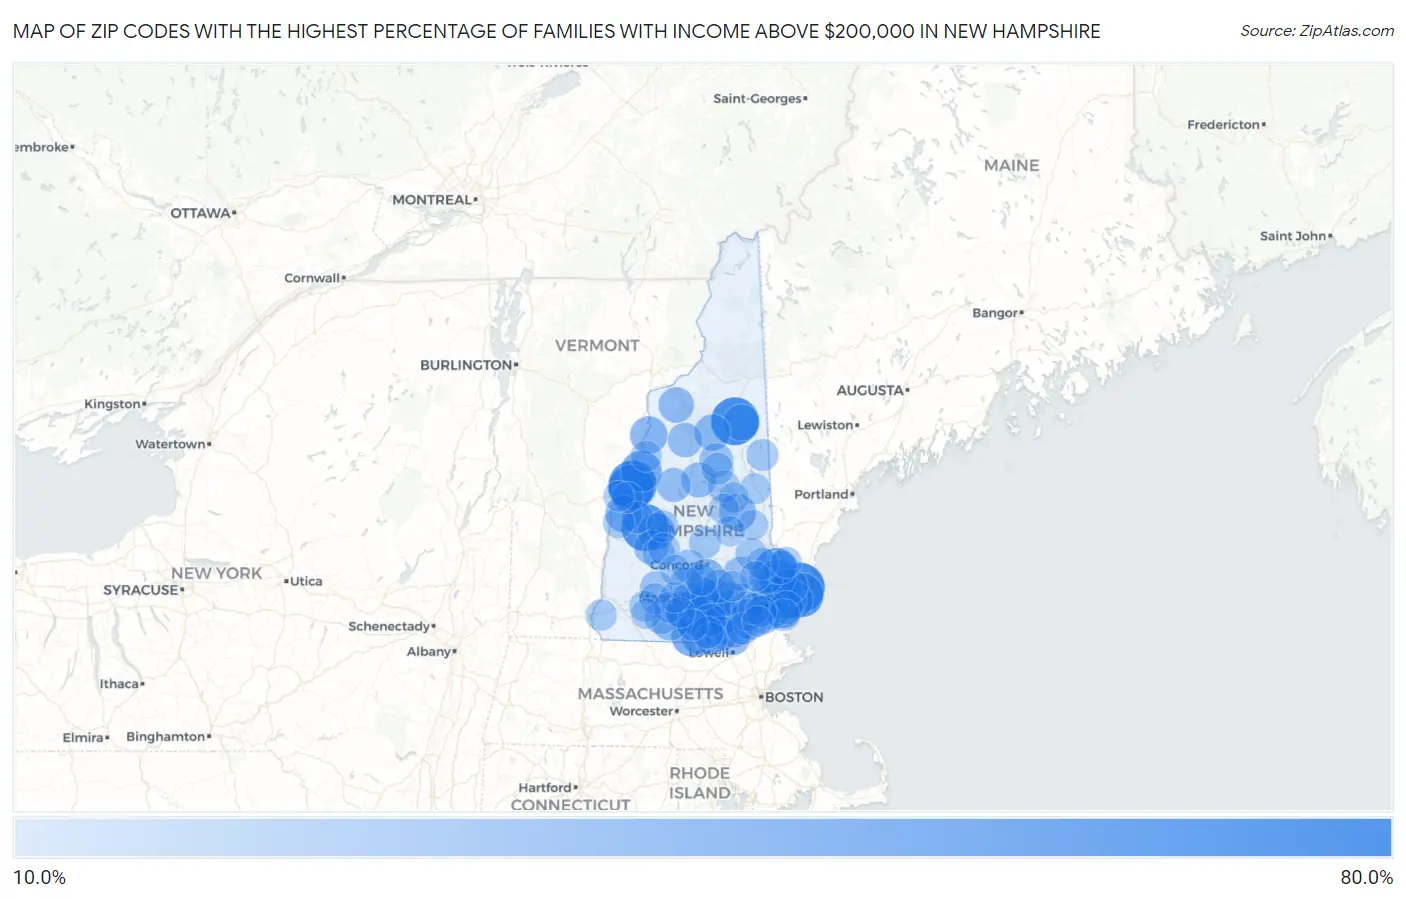
Map of Zip Codes with the Highest Percentage of Families with Income Above $200,000 in New Hampshire
10.0%
80.0%
Zip Codes with the Highest Percentage of Families with Income Above $200,000 in New Hampshire
| Zip Code | Families with Income > $200k | vs State | vs National | |
| 1. | 03854 | 62.0% | 18.4%(+43.6)#1 | 14.8%(+47.2)#243 |
| 2. | 03755 | 59.4% | 18.4%(+41.0)#2 | 14.8%(+44.6)#316 |
| 3. | 03812 | 58.0% | 18.4%(+39.6)#3 | 14.8%(+43.2)#350 |
| 4. | 03751 | 56.4% | 18.4%(+38.0)#4 | 14.8%(+41.6)#404 |
| 5. | 03750 | 52.8% | 18.4%(+34.4)#5 | 14.8%(+38.0)#544 |
| 6. | 03870 | 50.0% | 18.4%(+31.6)#6 | 14.8%(+35.2)#659 |
| 7. | 03823 | 48.8% | 18.4%(+30.4)#7 | 14.8%(+34.0)#723 |
| 8. | 03057 | 44.0% | 18.4%(+25.6)#8 | 14.8%(+29.2)#991 |
| 9. | 03856 | 41.9% | 18.4%(+23.5)#9 | 14.8%(+27.1)#1,151 |
| 10. | 03768 | 41.6% | 18.4%(+23.2)#10 | 14.8%(+26.8)#1,181 |
| 11. | 03110 | 41.5% | 18.4%(+23.1)#11 | 14.8%(+26.7)#1,185 |
| 12. | 03049 | 39.3% | 18.4%(+20.9)#12 | 14.8%(+24.5)#1,386 |
| 13. | 03033 | 38.8% | 18.4%(+20.4)#13 | 14.8%(+24.0)#1,437 |
| 14. | 03087 | 37.5% | 18.4%(+19.1)#14 | 14.8%(+22.7)#1,554 |
| 15. | 03031 | 37.4% | 18.4%(+19.0)#15 | 14.8%(+22.6)#1,568 |
| 16. | 03844 | 36.1% | 18.4%(+17.7)#16 | 14.8%(+21.3)#1,722 |
| 17. | 03871 | 35.3% | 18.4%(+16.9)#17 | 14.8%(+20.5)#1,812 |
| 18. | 03885 | 34.6% | 18.4%(+16.2)#18 | 14.8%(+19.8)#1,893 |
| 19. | 03862 | 34.2% | 18.4%(+15.8)#19 | 14.8%(+19.4)#1,939 |
| 20. | 03101 | 34.0% | 18.4%(+15.6)#20 | 14.8%(+19.2)#1,963 |
| 21. | 03765 | 33.3% | 18.4%(+14.9)#21 | 14.8%(+18.5)#2,065 |
| 22. | 03840 | 32.9% | 18.4%(+14.5)#22 | 14.8%(+18.1)#2,116 |
| 23. | 03304 | 32.7% | 18.4%(+14.3)#23 | 14.8%(+17.9)#2,142 |
| 24. | 03824 | 32.5% | 18.4%(+14.1)#24 | 14.8%(+17.7)#2,169 |
| 25. | 03257 | 32.5% | 18.4%(+14.1)#25 | 14.8%(+17.7)#2,172 |
| 26. | 03810 | 32.5% | 18.4%(+14.1)#26 | 14.8%(+17.7)#2,174 |
| 27. | 03770 | 31.9% | 18.4%(+13.5)#27 | 14.8%(+17.1)#2,248 |
| 28. | 03833 | 31.1% | 18.4%(+12.7)#28 | 14.8%(+16.3)#2,351 |
| 29. | 03827 | 31.1% | 18.4%(+12.7)#29 | 14.8%(+16.3)#2,356 |
| 30. | 03838 | 31.0% | 18.4%(+12.6)#30 | 14.8%(+16.2)#2,377 |
| 31. | 03070 | 30.8% | 18.4%(+12.4)#31 | 14.8%(+16.0)#2,407 |
| 32. | 03215 | 30.6% | 18.4%(+12.2)#32 | 14.8%(+15.8)#2,433 |
| 33. | 03084 | 30.0% | 18.4%(+11.6)#33 | 14.8%(+15.2)#2,518 |
| 34. | 03801 | 29.5% | 18.4%(+11.1)#34 | 14.8%(+14.7)#2,589 |
| 35. | 03052 | 28.9% | 18.4%(+10.5)#35 | 14.8%(+14.1)#2,698 |
| 36. | 03586 | 28.6% | 18.4%(+10.2)#36 | 14.8%(+13.8)#2,762 |
| 37. | 03076 | 28.3% | 18.4%(+9.90)#37 | 14.8%(+13.5)#2,817 |
| 38. | 03053 | 28.2% | 18.4%(+9.80)#38 | 14.8%(+13.4)#2,833 |
| 39. | 03036 | 28.0% | 18.4%(+9.60)#39 | 14.8%(+13.2)#2,869 |
| 40. | 03245 | 27.9% | 18.4%(+9.50)#40 | 14.8%(+13.1)#2,882 |
| 41. | 03051 | 26.8% | 18.4%(+8.40)#41 | 14.8%(+12.0)#3,084 |
| 42. | 03262 | 26.6% | 18.4%(+8.20)#42 | 14.8%(+11.8)#3,136 |
| 43. | 03811 | 26.0% | 18.4%(+7.60)#43 | 14.8%(+11.2)#3,251 |
| 44. | 03032 | 25.8% | 18.4%(+7.40)#44 | 14.8%(+11.0)#3,290 |
| 45. | 03255 | 25.7% | 18.4%(+7.30)#45 | 14.8%(+10.9)#3,309 |
| 46. | 03241 | 25.7% | 18.4%(+7.30)#46 | 14.8%(+10.9)#3,313 |
| 47. | 03259 | 25.0% | 18.4%(+6.60)#47 | 14.8%(+10.2)#3,483 |
| 48. | 03037 | 24.9% | 18.4%(+6.50)#48 | 14.8%(+10.1)#3,507 |
| 49. | 03861 | 24.5% | 18.4%(+6.10)#49 | 14.8%(+9.70)#3,609 |
| 50. | 03820 | 24.4% | 18.4%(+6.00)#50 | 14.8%(+9.60)#3,620 |
| 51. | 03106 | 24.4% | 18.4%(+6.00)#51 | 14.8%(+9.60)#3,627 |
| 52. | 03045 | 24.4% | 18.4%(+6.00)#52 | 14.8%(+9.60)#3,628 |
| 53. | 03458 | 24.2% | 18.4%(+5.80)#53 | 14.8%(+9.40)#3,663 |
| 54. | 03229 | 24.0% | 18.4%(+5.60)#54 | 14.8%(+9.20)#3,708 |
| 55. | 03842 | 23.9% | 18.4%(+5.50)#55 | 14.8%(+9.10)#3,730 |
| 56. | 03281 | 23.9% | 18.4%(+5.50)#56 | 14.8%(+9.10)#3,737 |
| 57. | 03858 | 23.1% | 18.4%(+4.70)#57 | 14.8%(+8.30)#3,923 |
| 58. | 03440 | 22.8% | 18.4%(+4.40)#58 | 14.8%(+8.00)#3,999 |
| 59. | 03054 | 21.8% | 18.4%(+3.40)#59 | 14.8%(+7.00)#4,267 |
| 60. | 03062 | 21.6% | 18.4%(+3.20)#60 | 14.8%(+6.80)#4,327 |
| 61. | 03221 | 21.5% | 18.4%(+3.10)#61 | 14.8%(+6.70)#4,365 |
| 62. | 03063 | 21.4% | 18.4%(+3.00)#62 | 14.8%(+6.60)#4,380 |
| 63. | 03873 | 21.4% | 18.4%(+3.00)#63 | 14.8%(+6.60)#4,384 |
| 64. | 03841 | 21.2% | 18.4%(+2.80)#64 | 14.8%(+6.40)#4,453 |
| 65. | 03079 | 21.1% | 18.4%(+2.70)#65 | 14.8%(+6.30)#4,468 |
| 66. | 03254 | 21.1% | 18.4%(+2.70)#66 | 14.8%(+6.30)#4,479 |
| 67. | 03874 | 20.8% | 18.4%(+2.40)#67 | 14.8%(+6.00)#4,579 |
| 68. | 03224 | 20.8% | 18.4%(+2.40)#68 | 14.8%(+6.00)#4,585 |
| 69. | 03753 | 20.6% | 18.4%(+2.20)#69 | 14.8%(+5.80)#4,636 |
| 70. | 03046 | 20.6% | 18.4%(+2.20)#70 | 14.8%(+5.80)#4,637 |
| 71. | 03287 | 20.6% | 18.4%(+2.20)#71 | 14.8%(+5.80)#4,642 |
| 72. | 03227 | 20.6% | 18.4%(+2.20)#72 | 14.8%(+5.80)#4,643 |
| 73. | 03884 | 20.4% | 18.4%(+2.00)#73 | 14.8%(+5.60)#4,695 |
| 74. | 03832 | 20.2% | 18.4%(+1.80)#74 | 14.8%(+5.40)#4,771 |
| 75. | 03273 | 20.2% | 18.4%(+1.80)#75 | 14.8%(+5.40)#4,772 |
| 76. | 03825 | 20.1% | 18.4%(+1.70)#76 | 14.8%(+5.30)#4,785 |
| 77. | 03055 | 19.5% | 18.4%(+1.10)#77 | 14.8%(+4.70)#4,973 |
| 78. | 03819 | 19.4% | 18.4%(+1.000)#78 | 14.8%(+4.60)#5,018 |
| 79. | 03745 | 19.3% | 18.4%(+0.900)#79 | 14.8%(+4.50)#5,063 |
| 80. | 03766 | 19.0% | 18.4%(+0.600)#80 | 14.8%(+4.20)#5,154 |
| 81. | 03777 | 18.9% | 18.4%(+0.500)#81 | 14.8%(+4.10)#5,216 |
| 82. | 03450 | 18.8% | 18.4%(+0.400)#82 | 14.8%(+4.00)#5,258 |
| 83. | 03449 | 18.7% | 18.4%(+0.300)#83 | 14.8%(+3.90)#5,304 |
| 84. | 03848 | 18.6% | 18.4%(+0.200)#84 | 14.8%(+3.80)#5,330 |
| 85. | 03443 | 18.6% | 18.4%(+0.200)#85 | 14.8%(+3.80)#5,346 |
| 86. | 03869 | 18.5% | 18.4%(+0.100)#86 | 14.8%(+3.70)#5,381 |
| 87. | 03864 | 18.2% | 18.4%(-0.200)#87 | 14.8%(+3.40)#5,501 |
| 88. | 03047 | 18.1% | 18.4%(-0.300)#88 | 14.8%(+3.30)#5,546 |
| 89. | 03784 | 18.0% | 18.4%(-0.400)#89 | 14.8%(+3.20)#5,584 |
| 90. | 03082 | 17.8% | 18.4%(-0.600)#90 | 14.8%(+3.00)#5,659 |
| 91. | 03865 | 17.7% | 18.4%(-0.700)#91 | 14.8%(+2.90)#5,688 |
| 92. | 03043 | 17.7% | 18.4%(-0.700)#92 | 14.8%(+2.90)#5,702 |
| 93. | 03034 | 17.4% | 18.4%(-1.00)#93 | 14.8%(+2.60)#5,828 |
| 94. | 03855 | 17.4% | 18.4%(-1.00)#94 | 14.8%(+2.60)#5,833 |
| 95. | 03242 | 17.1% | 18.4%(-1.30)#95 | 14.8%(+2.30)#5,952 |
| 96. | 03444 | 17.1% | 18.4%(-1.30)#96 | 14.8%(+2.30)#5,965 |
| 97. | 03853 | 17.1% | 18.4%(-1.30)#97 | 14.8%(+2.30)#5,968 |
| 98. | 03290 | 17.0% | 18.4%(-1.40)#98 | 14.8%(+2.20)#6,005 |
| 99. | 03249 | 16.8% | 18.4%(-1.60)#99 | 14.8%(+2.00)#6,084 |
| 100. | 03837 | 16.8% | 18.4%(-1.60)#100 | 14.8%(+2.00)#6,097 |
Common Questions
What are the Top 10 Zip Codes with the Highest Percentage of Families with Income Above $200,000 in New Hampshire?
Top 10 Zip Codes with the Highest Percentage of Families with Income Above $200,000 in New Hampshire are:
What zip code has the Highest Percentage of Families with Income Above $200,000 in New Hampshire?
03854 has the Highest Percentage of Families with Income Above $200,000 in New Hampshire with 62.0%.
What is the Percentage of Families with Income Above $200,000 in the State of New Hampshire?
Percentage of Families with Income Above $200,000 in New Hampshire is 18.4%.
What is the Percentage of Families with Income Above $200,000 in the United States?
Percentage of Families with Income Above $200,000 in the United States is 14.8%.