Zip Codes with the Highest Percentage of Families with Income Above $200,000 in South Dakota
RELATED REPORTS & OPTIONS
Family Income | $200k+
South Dakota
Compare Zip Codes
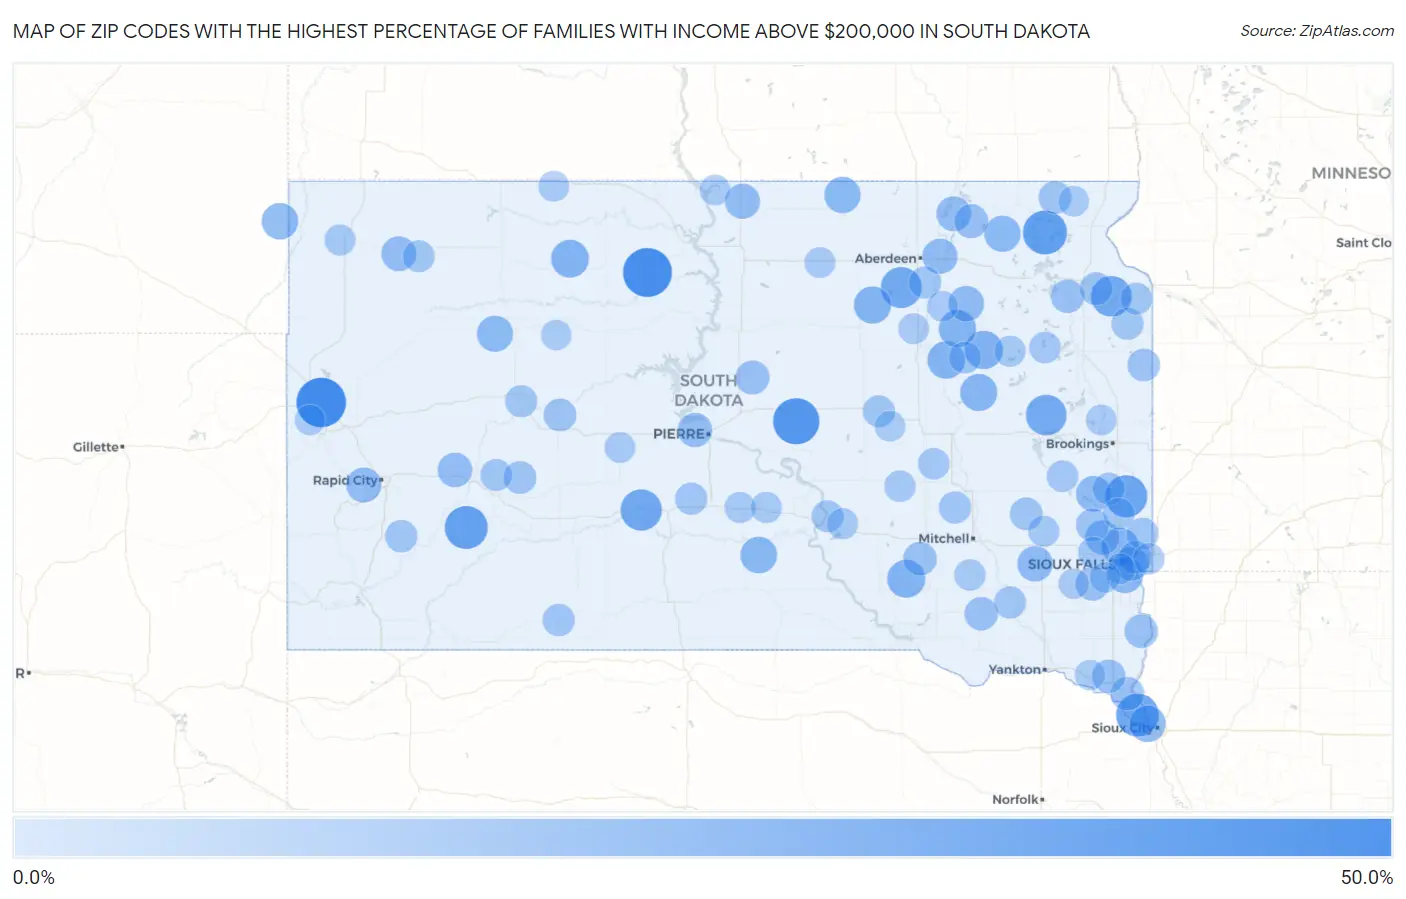
Map of Zip Codes with the Highest Percentage of Families with Income Above $200,000 in South Dakota
0.0%
50.0%
Zip Codes with the Highest Percentage of Families with Income Above $200,000 in South Dakota
| Zip Code | Families with Income > $200k | vs State | vs National | |
| 1. | 57779 | 45.7% | 9.1%(+36.6)#1 | 14.8%(+30.9)#894 |
| 2. | 57630 | 44.4% | 9.1%(+35.3)#2 | 14.8%(+29.6)#972 |
| 3. | 57540 | 39.5% | 9.1%(+30.4)#3 | 14.8%(+24.7)#1,365 |
| 4. | 57232 | 35.1% | 9.1%(+26.0)#4 | 14.8%(+20.3)#1,836 |
| 5. | 57780 | 33.3% | 9.1%(+24.2)#5 | 14.8%(+18.5)#2,074 |
| 6. | 57038 | 32.6% | 9.1%(+23.5)#6 | 14.8%(+17.8)#2,156 |
| 7. | 57024 | 31.6% | 9.1%(+22.5)#7 | 14.8%(+16.8)#2,292 |
| 8. | 57562 | 30.0% | 9.1%(+20.9)#8 | 14.8%(+15.2)#2,520 |
| 9. | 57460 | 29.4% | 9.1%(+20.3)#9 | 14.8%(+14.6)#2,613 |
| 10. | 57269 | 29.0% | 9.1%(+19.9)#10 | 14.8%(+14.2)#2,682 |
| 11. | 57233 | 28.9% | 9.1%(+19.8)#11 | 14.8%(+14.1)#2,703 |
| 12. | 57258 | 24.6% | 9.1%(+15.5)#12 | 14.8%(+9.80)#3,585 |
| 13. | 57344 | 23.9% | 9.1%(+14.8)#13 | 14.8%(+9.10)#3,749 |
| 14. | 57633 | 23.5% | 9.1%(+14.4)#14 | 14.8%(+8.70)#3,842 |
| 15. | 57440 | 23.2% | 9.1%(+14.1)#15 | 14.8%(+8.40)#3,908 |
| 16. | 57477 | 22.9% | 9.1%(+13.8)#16 | 14.8%(+8.10)#3,987 |
| 17. | 57435 | 22.5% | 9.1%(+13.4)#17 | 14.8%(+7.70)#4,099 |
| 18. | 57055 | 22.3% | 9.1%(+13.2)#18 | 14.8%(+7.50)#4,143 |
| 19. | 57322 | 22.2% | 9.1%(+13.1)#19 | 14.8%(+7.40)#4,170 |
| 20. | 57541 | 21.3% | 9.1%(+12.2)#20 | 14.8%(+6.50)#4,426 |
| 21. | 57724 | 21.2% | 9.1%(+12.1)#21 | 14.8%(+6.40)#4,464 |
| 22. | 57049 | 21.0% | 9.1%(+11.9)#22 | 14.8%(+6.20)#4,509 |
| 23. | 57108 | 20.8% | 9.1%(+11.7)#23 | 14.8%(+6.00)#4,561 |
| 24. | 57457 | 20.8% | 9.1%(+11.7)#24 | 14.8%(+6.00)#4,595 |
| 25. | 57454 | 20.6% | 9.1%(+11.5)#25 | 14.8%(+5.80)#4,649 |
| 26. | 57626 | 20.4% | 9.1%(+11.3)#26 | 14.8%(+5.60)#4,706 |
| 27. | 57075 | 19.5% | 9.1%(+10.4)#27 | 14.8%(+4.70)#4,986 |
| 28. | 57434 | 19.4% | 9.1%(+10.3)#28 | 14.8%(+4.60)#5,035 |
| 29. | 57319 | 19.0% | 9.1%(+9.90)#29 | 14.8%(+4.20)#5,163 |
| 30. | 57427 | 18.6% | 9.1%(+9.50)#30 | 14.8%(+3.80)#5,344 |
| 31. | 57632 | 18.5% | 9.1%(+9.40)#31 | 14.8%(+3.70)#5,386 |
| 32. | 57702 | 18.3% | 9.1%(+9.20)#32 | 14.8%(+3.50)#5,445 |
| 33. | 57651 | 18.2% | 9.1%(+9.10)#33 | 14.8%(+3.40)#5,512 |
| 34. | 57449 | 18.1% | 9.1%(+9.00)#34 | 14.8%(+3.30)#5,554 |
| 35. | 57767 | 17.5% | 9.1%(+8.40)#35 | 14.8%(+2.70)#5,797 |
| 36. | 57532 | 17.2% | 9.1%(+8.10)#36 | 14.8%(+2.40)#5,909 |
| 37. | 57110 | 17.0% | 9.1%(+7.90)#37 | 14.8%(+2.20)#5,989 |
| 38. | 57041 | 17.0% | 9.1%(+7.90)#38 | 14.8%(+2.20)#6,025 |
| 39. | 57564 | 16.7% | 9.1%(+7.60)#39 | 14.8%(+1.90)#6,139 |
| 40. | 57015 | 16.5% | 9.1%(+7.40)#40 | 14.8%(+1.70)#6,237 |
| 41. | 57432 | 16.4% | 9.1%(+7.30)#41 | 14.8%(+1.60)#6,280 |
| 42. | 57375 | 15.9% | 9.1%(+6.80)#42 | 14.8%(+1.10)#6,520 |
| 43. | 57034 | 15.7% | 9.1%(+6.60)#43 | 14.8%(+0.900)#6,614 |
| 44. | 57025 | 15.6% | 9.1%(+6.50)#44 | 14.8%(+0.800)#6,660 |
| 45. | 57256 | 15.6% | 9.1%(+6.50)#45 | 14.8%(+0.800)#6,673 |
| 46. | 57376 | 15.5% | 9.1%(+6.40)#46 | 14.8%(+0.700)#6,718 |
| 47. | 57010 | 15.5% | 9.1%(+6.40)#47 | 14.8%(+0.700)#6,720 |
| 48. | 57018 | 14.8% | 9.1%(+5.70)#48 | 14.8%(=0.000)#7,123 |
| 49. | 57270 | 14.5% | 9.1%(+5.40)#49 | 14.8%(-0.300)#7,291 |
| 50. | 57775 | 14.3% | 9.1%(+5.20)#50 | 14.8%(-0.500)#7,410 |
| 51. | 57251 | 14.3% | 9.1%(+5.20)#51 | 14.8%(-0.500)#7,411 |
| 52. | 57237 | 14.1% | 9.1%(+5.00)#52 | 14.8%(-0.700)#7,507 |
| 53. | 57321 | 14.1% | 9.1%(+5.00)#53 | 14.8%(-0.700)#7,516 |
| 54. | 57553 | 14.1% | 9.1%(+5.00)#54 | 14.8%(-0.700)#7,521 |
| 55. | 57005 | 14.0% | 9.1%(+4.90)#55 | 14.8%(-0.800)#7,545 |
| 56. | 57744 | 13.8% | 9.1%(+4.70)#56 | 14.8%(-1.00)#7,698 |
| 57. | 57551 | 13.4% | 9.1%(+4.30)#57 | 14.8%(-1.40)#7,957 |
| 58. | 57359 | 13.3% | 9.1%(+4.20)#58 | 14.8%(-1.50)#8,041 |
| 59. | 57531 | 13.3% | 9.1%(+4.20)#59 | 14.8%(-1.50)#8,058 |
| 60. | 57479 | 13.2% | 9.1%(+4.10)#60 | 14.8%(-1.60)#8,115 |
| 61. | 57246 | 13.2% | 9.1%(+4.10)#61 | 14.8%(-1.60)#8,124 |
| 62. | 57052 | 13.1% | 9.1%(+4.00)#62 | 14.8%(-1.70)#8,188 |
| 63. | 57748 | 13.1% | 9.1%(+4.00)#63 | 14.8%(-1.70)#8,191 |
| 64. | 57030 | 12.9% | 9.1%(+3.80)#64 | 14.8%(-1.90)#8,332 |
| 65. | 57017 | 12.9% | 9.1%(+3.80)#65 | 14.8%(-1.90)#8,339 |
| 66. | 57373 | 12.9% | 9.1%(+3.80)#66 | 14.8%(-1.90)#8,347 |
| 67. | 57790 | 12.8% | 9.1%(+3.70)#67 | 14.8%(-2.00)#8,403 |
| 68. | 57436 | 12.7% | 9.1%(+3.60)#68 | 14.8%(-2.10)#8,471 |
| 69. | 57649 | 12.7% | 9.1%(+3.60)#69 | 14.8%(-2.10)#8,473 |
| 70. | 57252 | 12.6% | 9.1%(+3.50)#70 | 14.8%(-2.20)#8,520 |
| 71. | 57325 | 12.5% | 9.1%(+3.40)#71 | 14.8%(-2.30)#8,593 |
| 72. | 57022 | 12.3% | 9.1%(+3.20)#72 | 14.8%(-2.50)#8,755 |
| 73. | 57054 | 12.2% | 9.1%(+3.10)#73 | 14.8%(-2.60)#8,863 |
| 74. | 57312 | 12.1% | 9.1%(+3.00)#74 | 14.8%(-2.70)#8,946 |
| 75. | 57243 | 12.1% | 9.1%(+3.00)#75 | 14.8%(-2.70)#8,948 |
| 76. | 57033 | 11.7% | 9.1%(+2.60)#76 | 14.8%(-3.10)#9,204 |
| 77. | 57068 | 11.7% | 9.1%(+2.60)#77 | 14.8%(-3.10)#9,224 |
| 78. | 57382 | 11.7% | 9.1%(+2.60)#78 | 14.8%(-3.10)#9,236 |
| 79. | 57331 | 11.7% | 9.1%(+2.60)#79 | 14.8%(-3.10)#9,251 |
| 80. | 57370 | 11.4% | 9.1%(+2.30)#80 | 14.8%(-3.40)#9,501 |
| 81. | 57058 | 11.3% | 9.1%(+2.20)#81 | 14.8%(-3.50)#9,578 |
| 82. | 57225 | 11.2% | 9.1%(+2.10)#82 | 14.8%(-3.60)#9,671 |
| 83. | 57568 | 11.2% | 9.1%(+2.10)#83 | 14.8%(-3.60)#9,688 |
| 84. | 57720 | 11.1% | 9.1%(+2.00)#84 | 14.8%(-3.70)#9,779 |
| 85. | 57544 | 11.1% | 9.1%(+2.00)#85 | 14.8%(-3.70)#9,787 |
| 86. | 57552 | 10.8% | 9.1%(+1.70)#86 | 14.8%(-4.00)#10,077 |
| 87. | 57471 | 10.8% | 9.1%(+1.70)#87 | 14.8%(-4.00)#10,078 |
| 88. | 57424 | 10.7% | 9.1%(+1.60)#88 | 14.8%(-4.10)#10,181 |
| 89. | 57220 | 10.6% | 9.1%(+1.50)#89 | 14.8%(-4.20)#10,258 |
| 90. | 57105 | 10.5% | 9.1%(+1.40)#90 | 14.8%(-4.30)#10,294 |
| 91. | 57645 | 10.5% | 9.1%(+1.40)#91 | 14.8%(-4.30)#10,362 |
| 92. | 57429 | 10.5% | 9.1%(+1.40)#92 | 14.8%(-4.30)#10,364 |
| 93. | 57623 | 10.4% | 9.1%(+1.30)#93 | 14.8%(-4.40)#10,451 |
| 94. | 57224 | 10.4% | 9.1%(+1.30)#94 | 14.8%(-4.40)#10,465 |
| 95. | 57783 | 10.3% | 9.1%(+1.20)#95 | 14.8%(-4.50)#10,500 |
| 96. | 57381 | 10.3% | 9.1%(+1.20)#96 | 14.8%(-4.50)#10,560 |
| 97. | 57648 | 10.3% | 9.1%(+1.20)#97 | 14.8%(-4.50)#10,561 |
| 98. | 57064 | 10.1% | 9.1%(+1.000)#98 | 14.8%(-4.70)#10,718 |
| 99. | 57069 | 10.0% | 9.1%(+0.900)#99 | 14.8%(-4.80)#10,799 |
| 100. | 57053 | 10.0% | 9.1%(+0.900)#100 | 14.8%(-4.80)#10,833 |
Common Questions
What are the Top 10 Zip Codes with the Highest Percentage of Families with Income Above $200,000 in South Dakota?
Top 10 Zip Codes with the Highest Percentage of Families with Income Above $200,000 in South Dakota are:
What zip code has the Highest Percentage of Families with Income Above $200,000 in South Dakota?
57779 has the Highest Percentage of Families with Income Above $200,000 in South Dakota with 45.7%.
What is the Percentage of Families with Income Above $200,000 in the State of South Dakota?
Percentage of Families with Income Above $200,000 in South Dakota is 9.1%.
What is the Percentage of Families with Income Above $200,000 in the United States?
Percentage of Families with Income Above $200,000 in the United States is 14.8%.