Zip Codes with the Highest Percentage of Families with Income Above $200,000 in Oregon
RELATED REPORTS & OPTIONS
Family Income | $200k+
Oregon
Compare Zip Codes
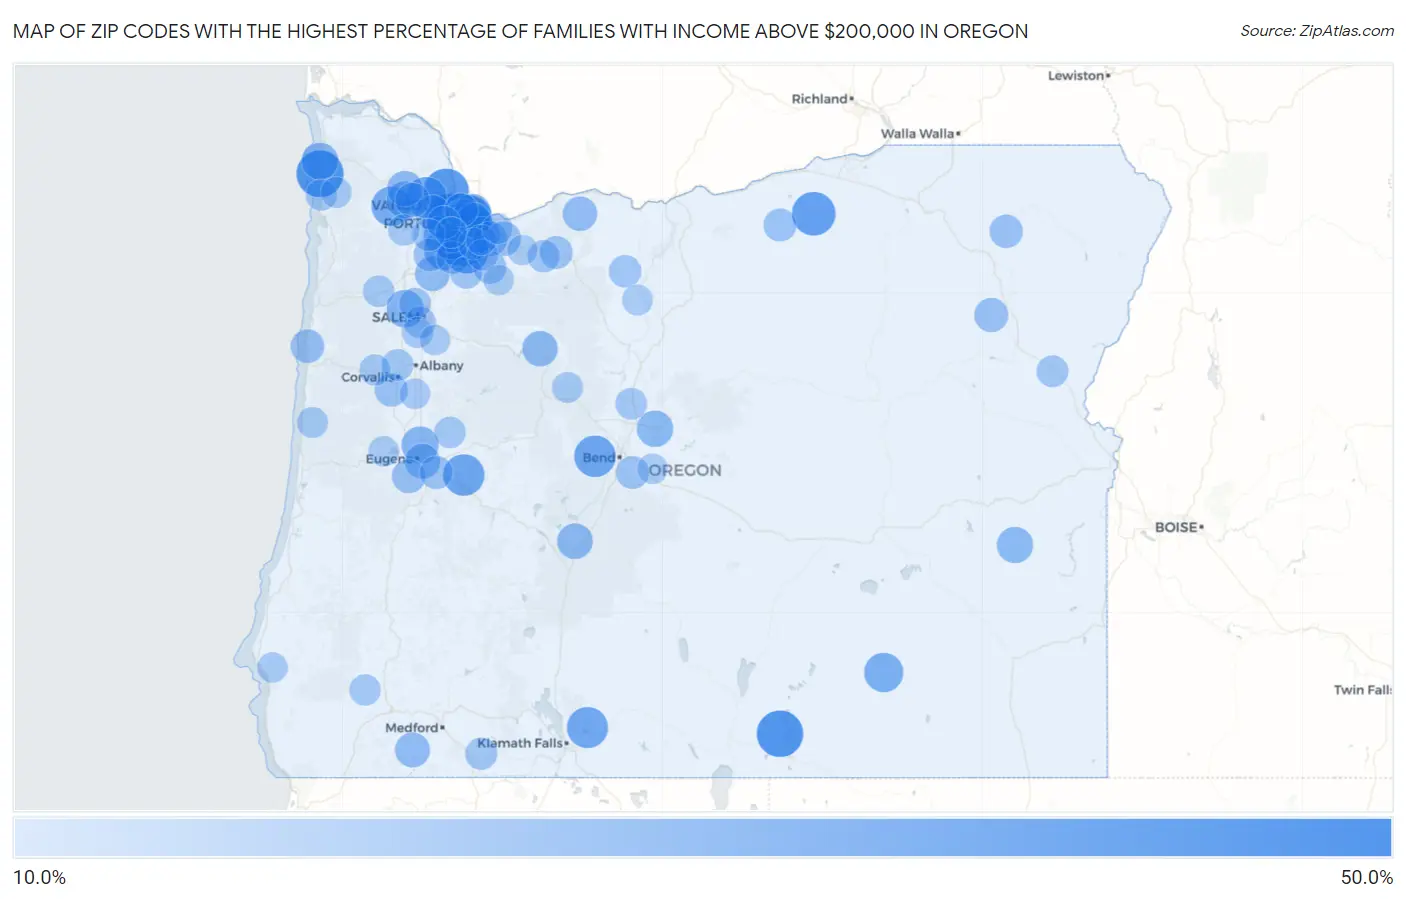
Map of Zip Codes with the Highest Percentage of Families with Income Above $200,000 in Oregon
10.0%
50.0%
Zip Codes with the Highest Percentage of Families with Income Above $200,000 in Oregon
| Zip Code | Families with Income > $200k | vs State | vs National | |
| 1. | 97221 | 47.2% | 14.0%(+33.2)#1 | 14.8%(+32.4)#803 |
| 2. | 97034 | 46.5% | 14.0%(+32.5)#2 | 14.8%(+31.7)#841 |
| 3. | 97210 | 45.4% | 14.0%(+31.4)#3 | 14.8%(+30.6)#917 |
| 4. | 97229 | 43.2% | 14.0%(+29.2)#4 | 14.8%(+28.4)#1,036 |
| 5. | 97102 | 42.7% | 14.0%(+28.7)#5 | 14.8%(+27.9)#1,077 |
| 6. | 97212 | 42.5% | 14.0%(+28.5)#6 | 14.8%(+27.7)#1,091 |
| 7. | 97620 | 41.7% | 14.0%(+27.7)#7 | 14.8%(+26.9)#1,175 |
| 8. | 97201 | 40.1% | 14.0%(+26.1)#8 | 14.8%(+25.3)#1,306 |
| 9. | 97231 | 39.5% | 14.0%(+25.5)#9 | 14.8%(+24.7)#1,362 |
| 10. | 97068 | 37.8% | 14.0%(+23.8)#10 | 14.8%(+23.0)#1,516 |
| 11. | 97839 | 36.6% | 14.0%(+22.6)#11 | 14.8%(+21.8)#1,665 |
| 12. | 97239 | 36.4% | 14.0%(+22.4)#12 | 14.8%(+21.6)#1,686 |
| 13. | 97035 | 35.6% | 14.0%(+21.6)#13 | 14.8%(+20.8)#1,771 |
| 14. | 97209 | 35.3% | 14.0%(+21.3)#14 | 14.8%(+20.5)#1,801 |
| 15. | 97225 | 35.1% | 14.0%(+21.1)#15 | 14.8%(+20.3)#1,829 |
| 16. | 97205 | 34.8% | 14.0%(+20.8)#16 | 14.8%(+20.0)#1,864 |
| 17. | 97219 | 33.9% | 14.0%(+19.9)#17 | 14.8%(+19.1)#1,970 |
| 18. | 97703 | 32.8% | 14.0%(+18.8)#18 | 14.8%(+18.0)#2,123 |
| 19. | 97438 | 32.7% | 14.0%(+18.7)#19 | 14.8%(+17.9)#2,148 |
| 20. | 97133 | 32.2% | 14.0%(+18.2)#20 | 14.8%(+17.4)#2,205 |
| 21. | 97625 | 32.0% | 14.0%(+18.0)#21 | 14.8%(+17.2)#2,227 |
| 22. | 97202 | 30.7% | 14.0%(+16.7)#22 | 14.8%(+15.9)#2,415 |
| 23. | 97214 | 30.2% | 14.0%(+16.2)#23 | 14.8%(+15.4)#2,492 |
| 24. | 97140 | 29.5% | 14.0%(+15.5)#24 | 14.8%(+14.7)#2,586 |
| 25. | 97117 | 29.4% | 14.0%(+15.4)#25 | 14.8%(+14.6)#2,611 |
| 26. | 97232 | 29.2% | 14.0%(+15.2)#26 | 14.8%(+14.4)#2,634 |
| 27. | 97736 | 28.6% | 14.0%(+14.6)#27 | 14.8%(+13.8)#2,766 |
| 28. | 97227 | 27.4% | 14.0%(+13.4)#28 | 14.8%(+12.6)#2,981 |
| 29. | 97215 | 26.3% | 14.0%(+12.3)#29 | 14.8%(+11.5)#3,183 |
| 30. | 97007 | 26.2% | 14.0%(+12.2)#30 | 14.8%(+11.4)#3,192 |
| 31. | 97371 | 25.8% | 14.0%(+11.8)#31 | 14.8%(+11.0)#3,296 |
| 32. | 97408 | 25.1% | 14.0%(+11.1)#32 | 14.8%(+10.3)#3,433 |
| 33. | 97211 | 25.0% | 14.0%(+11.0)#33 | 14.8%(+10.2)#3,453 |
| 34. | 97125 | 25.0% | 14.0%(+11.0)#34 | 14.8%(+10.2)#3,489 |
| 35. | 97110 | 24.7% | 14.0%(+10.7)#35 | 14.8%(+9.90)#3,556 |
| 36. | 97086 | 23.9% | 14.0%(+9.90)#36 | 14.8%(+9.10)#3,723 |
| 37. | 97224 | 23.8% | 14.0%(+9.80)#37 | 14.8%(+9.00)#3,757 |
| 38. | 97753 | 23.8% | 14.0%(+9.80)#38 | 14.8%(+9.00)#3,772 |
| 39. | 97906 | 23.4% | 14.0%(+9.40)#39 | 14.8%(+8.60)#3,865 |
| 40. | 97737 | 22.6% | 14.0%(+8.60)#40 | 14.8%(+7.80)#4,067 |
| 41. | 97109 | 22.3% | 14.0%(+8.30)#41 | 14.8%(+7.50)#4,148 |
| 42. | 97342 | 22.2% | 14.0%(+8.20)#42 | 14.8%(+7.40)#4,173 |
| 43. | 97062 | 22.0% | 14.0%(+8.00)#43 | 14.8%(+7.20)#4,204 |
| 44. | 97403 | 21.7% | 14.0%(+7.70)#44 | 14.8%(+6.90)#4,301 |
| 45. | 97223 | 21.6% | 14.0%(+7.60)#45 | 14.8%(+6.80)#4,322 |
| 46. | 97124 | 21.2% | 14.0%(+7.20)#46 | 14.8%(+6.40)#4,429 |
| 47. | 97530 | 21.2% | 14.0%(+7.20)#47 | 14.8%(+6.40)#4,452 |
| 48. | 97137 | 21.1% | 14.0%(+7.10)#48 | 14.8%(+6.30)#4,485 |
| 49. | 97213 | 20.6% | 14.0%(+6.60)#49 | 14.8%(+5.80)#4,626 |
| 50. | 97031 | 20.5% | 14.0%(+6.50)#50 | 14.8%(+5.70)#4,658 |
| 51. | 97089 | 20.4% | 14.0%(+6.40)#51 | 14.8%(+5.60)#4,685 |
| 52. | 97106 | 20.4% | 14.0%(+6.40)#52 | 14.8%(+5.60)#4,693 |
| 53. | 97009 | 20.3% | 14.0%(+6.30)#53 | 14.8%(+5.50)#4,729 |
| 54. | 97833 | 19.6% | 14.0%(+5.60)#54 | 14.8%(+4.80)#4,960 |
| 55. | 97405 | 19.4% | 14.0%(+5.40)#55 | 14.8%(+4.60)#4,997 |
| 56. | 97369 | 19.1% | 14.0%(+5.10)#56 | 14.8%(+4.30)#5,135 |
| 57. | 97217 | 18.7% | 14.0%(+4.70)#57 | 14.8%(+3.90)#5,279 |
| 58. | 97006 | 18.4% | 14.0%(+4.40)#58 | 14.8%(+3.60)#5,403 |
| 59. | 97333 | 18.4% | 14.0%(+4.40)#59 | 14.8%(+3.60)#5,413 |
| 60. | 97841 | 18.4% | 14.0%(+4.40)#60 | 14.8%(+3.60)#5,439 |
| 61. | 97455 | 18.1% | 14.0%(+4.10)#61 | 14.8%(+3.30)#5,544 |
| 62. | 97843 | 17.8% | 14.0%(+3.80)#62 | 14.8%(+3.00)#5,662 |
| 63. | 97004 | 17.7% | 14.0%(+3.70)#63 | 14.8%(+2.90)#5,691 |
| 64. | 97049 | 17.6% | 14.0%(+3.60)#64 | 14.8%(+2.80)#5,746 |
| 65. | 97132 | 17.5% | 14.0%(+3.50)#65 | 14.8%(+2.70)#5,763 |
| 66. | 97702 | 17.4% | 14.0%(+3.40)#66 | 14.8%(+2.60)#5,799 |
| 67. | 97070 | 17.4% | 14.0%(+3.40)#67 | 14.8%(+2.60)#5,810 |
| 68. | 97063 | 16.8% | 14.0%(+2.80)#68 | 14.8%(+2.00)#6,098 |
| 69. | 97123 | 16.6% | 14.0%(+2.60)#69 | 14.8%(+1.80)#6,155 |
| 70. | 97013 | 16.6% | 14.0%(+2.60)#70 | 14.8%(+1.80)#6,169 |
| 71. | 97067 | 16.5% | 14.0%(+2.50)#71 | 14.8%(+1.70)#6,229 |
| 72. | 97520 | 16.1% | 14.0%(+2.10)#72 | 14.8%(+1.30)#6,400 |
| 73. | 97330 | 15.7% | 14.0%(+1.70)#73 | 14.8%(+0.900)#6,579 |
| 74. | 97302 | 15.7% | 14.0%(+1.70)#74 | 14.8%(+0.900)#6,580 |
| 75. | 97304 | 15.7% | 14.0%(+1.70)#75 | 14.8%(+0.900)#6,583 |
| 76. | 97905 | 15.7% | 14.0%(+1.70)#76 | 14.8%(+0.900)#6,623 |
| 77. | 97378 | 15.5% | 14.0%(+1.50)#77 | 14.8%(+0.700)#6,701 |
| 78. | 97760 | 15.5% | 14.0%(+1.50)#78 | 14.8%(+0.700)#6,705 |
| 79. | 97454 | 15.3% | 14.0%(+1.30)#79 | 14.8%(+0.500)#6,823 |
| 80. | 97027 | 15.1% | 14.0%(+1.10)#80 | 14.8%(+0.300)#6,931 |
| 81. | 97045 | 14.9% | 14.0%(+0.900)#81 | 14.8%(+0.100)#7,025 |
| 82. | 97130 | 14.9% | 14.0%(+0.900)#82 | 14.8%(+0.100)#7,067 |
| 83. | 97119 | 14.8% | 14.0%(+0.800)#83 | 14.8%(=0.000)#7,103 |
| 84. | 97532 | 14.8% | 14.0%(+0.800)#84 | 14.8%(=0.000)#7,115 |
| 85. | 97008 | 14.7% | 14.0%(+0.700)#85 | 14.8%(-0.100)#7,157 |
| 86. | 97370 | 14.6% | 14.0%(+0.600)#86 | 14.8%(-0.200)#7,225 |
| 87. | 97759 | 14.4% | 14.0%(+0.400)#87 | 14.8%(-0.400)#7,329 |
| 88. | 97498 | 14.4% | 14.0%(+0.400)#88 | 14.8%(-0.400)#7,345 |
| 89. | 97306 | 14.3% | 14.0%(+0.300)#89 | 14.8%(-0.500)#7,370 |
| 90. | 97131 | 14.1% | 14.0%(+0.100)#90 | 14.8%(-0.700)#7,499 |
| 91. | 97037 | 13.9% | 14.0%(-0.100)#91 | 14.8%(-0.900)#7,635 |
| 92. | 97377 | 13.8% | 14.0%(-0.200)#92 | 14.8%(-1.00)#7,711 |
| 93. | 97015 | 13.6% | 14.0%(-0.400)#93 | 14.8%(-1.20)#7,807 |
| 94. | 97392 | 13.6% | 14.0%(-0.400)#94 | 14.8%(-1.20)#7,822 |
| 95. | 97017 | 13.6% | 14.0%(-0.400)#95 | 14.8%(-1.20)#7,825 |
| 96. | 97437 | 13.6% | 14.0%(-0.400)#96 | 14.8%(-1.20)#7,831 |
| 97. | 97701 | 13.4% | 14.0%(-0.600)#97 | 14.8%(-1.40)#7,920 |
| 98. | 97055 | 13.4% | 14.0%(-0.600)#98 | 14.8%(-1.40)#7,926 |
| 99. | 97465 | 13.4% | 14.0%(-0.600)#99 | 14.8%(-1.40)#7,960 |
| 100. | 97080 | 13.3% | 14.0%(-0.700)#100 | 14.8%(-1.50)#7,980 |
Common Questions
What are the Top 10 Zip Codes with the Highest Percentage of Families with Income Above $200,000 in Oregon?
Top 10 Zip Codes with the Highest Percentage of Families with Income Above $200,000 in Oregon are:
What zip code has the Highest Percentage of Families with Income Above $200,000 in Oregon?
97221 has the Highest Percentage of Families with Income Above $200,000 in Oregon with 47.2%.
What is the Percentage of Families with Income Above $200,000 in the State of Oregon?
Percentage of Families with Income Above $200,000 in Oregon is 14.0%.
What is the Percentage of Families with Income Above $200,000 in the United States?
Percentage of Families with Income Above $200,000 in the United States is 14.8%.