Zip Codes with the Highest Percentage of Families with Income Above $200,000 in Rhode Island

RELATED REPORTS & OPTIONS

Family Income | $200k+
Population
Families and Households
Female Fertility
Female Fertility (Unmarried)
Race (Community Size)
Race (Percentage)
Ancestry (Community Size)
AfghanAfricanAlaska NativeAlaskan AthabascanAlbanianAleutAlsatianAmericanApacheArabArapahoArgentineanArmenianAssyrian / Chaldean / SyriacAustralianAustrianBahamianBangladeshiBarbadianBasqueBelgianBelizeanBermudanBhutaneseBlackfeetBolivianBrazilianBritishBritish West IndianBulgarianBurmeseCajunCambodianCanadianCape VerdeanCarpatho RusynCelticCentral AmericanCentral American IndianCherokeeCheyenneChickasawChileanChineseChippewaChoctawColombianColvilleComancheCosta RicanCreeCreekCroatianCrowCubanCypriotCzechCzechoslovakianDanishDelawareDominicanDutchDutch West IndianEastern EuropeanEcuadorianEgyptianEnglishEstonianEthiopianEuropeanFijianFilipinoFinnishFrenchFrench American IndianFrench CanadianGermanGerman RussianGhanaianGreekGuamanian / ChamorroGuatemalanGuyaneseHaitianHmongHonduranHopiHoumaHungarianIcelanderIndian (Asian)IndonesianInupiatIranianIraqiIrishIroquoisIsraeliItalianJamaicanJapaneseJordanianKenyanKiowaKoreanLaotianLatvianLebaneseLiberianLithuanianLumbeeLuxembourgerMacedonianMalaysianMalteseMarshalleseMenomineeMexicanMexican American IndianMongolianMoroccanNative HawaiianNavajoNepaleseNew ZealanderNicaraguanNigerianNorthern EuropeanNorwegianOkinawanOsageOttawaPaiutePakistaniPalestinianPanamanianParaguayanPennsylvania GermanPeruvianPimaPolishPortuguesePotawatomiPuebloPuerto RicanPuget Sound SalishRomanianRussianSalvadoranSamoanScandinavianScotch-IrishScottishSeminoleSenegaleseSerbianShoshoneSierra LeoneanSiouxSlavicSlovakSloveneSomaliSouth AfricanSouth AmericanSouth American IndianSoviet UnionSpaniardSpanishSpanish AmericanSpanish American IndianSri LankanSubsaharan AfricanSudaneseSwedishSwissSyrianTaiwaneseThaiTlingit-HaidaTohono O'OdhamTonganTrinidadian and TobagonianTsimshianTurkishU.S. Virgin IslanderUgandanUkrainianUruguayanUteVenezuelanVietnameseWelshWest IndianYakamaYaquiYugoslavianYumanYup'ikZimbabwean
Ancestry (Percentage)
AfghanAfricanAlaska NativeAlaskan AthabascanAlbanianAleutAlsatianAmericanApacheArabArapahoArgentineanArmenianAssyrian / Chaldean / SyriacAustralianAustrianBahamianBangladeshiBarbadianBasqueBelgianBelizeanBermudanBhutaneseBlackfeetBolivianBrazilianBritishBritish West IndianBulgarianBurmeseCajunCambodianCanadianCape VerdeanCarpatho RusynCelticCentral AmericanCentral American IndianCherokeeCheyenneChickasawChileanChineseChippewaChoctawColombianColvilleComancheCosta RicanCreeCreekCroatianCrowCubanCypriotCzechCzechoslovakianDanishDelawareDominicanDutchDutch West IndianEastern EuropeanEcuadorianEgyptianEnglishEstonianEthiopianEuropeanFijianFilipinoFinnishFrenchFrench American IndianFrench CanadianGermanGerman RussianGhanaianGreekGuamanian / ChamorroGuatemalanGuyaneseHaitianHmongHonduranHopiHoumaHungarianIcelanderIndian (Asian)IndonesianInupiatIranianIraqiIrishIroquoisIsraeliItalianJamaicanJapaneseJordanianKenyanKiowaKoreanLaotianLatvianLebaneseLiberianLithuanianLumbeeLuxembourgerMacedonianMalaysianMalteseMarshalleseMenomineeMexicanMexican American IndianMongolianMoroccanNative HawaiianNavajoNepaleseNew ZealanderNicaraguanNigerianNorthern EuropeanNorwegianOkinawanOsageOttawaPaiutePakistaniPalestinianPanamanianParaguayanPennsylvania GermanPeruvianPimaPolishPortuguesePotawatomiPuebloPuerto RicanPuget Sound SalishRomanianRussianSalvadoranSamoanScandinavianScotch-IrishScottishSeminoleSenegaleseSerbianShoshoneSierra LeoneanSiouxSlavicSlovakSloveneSomaliSouth AfricanSouth AmericanSouth American IndianSoviet UnionSpaniardSpanishSpanish AmericanSpanish American IndianSri LankanSubsaharan AfricanSudaneseSwedishSwissSyrianTaiwaneseThaiTlingit-HaidaTohono O'OdhamTonganTrinidadian and TobagonianTsimshianTurkishU.S. Virgin IslanderUgandanUkrainianUruguayanUteVenezuelanVietnameseWelshWest IndianYakamaYaquiYugoslavianYumanYup'ikZimbabwean
Immigrant Origin (Total)
AfghanistanAfricaAlbaniaArgentinaArmeniaAsiaAustraliaAustriaAzoresBahamasBangladeshBarbadosBelarusBelgiumBelizeBoliviaBosnia and HerzegovinaBrazilBulgariaBurma / MyanmarCabo VerdeCambodiaCameroonCanadaCaribbeanCentral AmericaChileChinaColombiaCongoCosta RicaCroatiaCubaCzechoslovakiaDenmarkDominicaDominican RepublicEastern AfricaEastern AsiaEastern EuropeEcuadorEgyptEl SalvadorEnglandEritreaEthiopiaEuropeFijiFranceGermanyGhanaGreeceGrenadaGuatemalaGuyanaHaitiHondurasHong KongHungaryIndiaIndonesiaIranIraqIrelandIsraelItalyJamaicaJapanJordanKazakhstanKenyaKoreaKuwaitLaosLatin AmericaLatviaLebanonLiberiaLithuaniaMalaysiaMexicoMicronesiaMiddle AfricaMoldovaMoroccoNepalNetherlandsNicaraguaNigeriaNorth MacedoniaNorthern AfricaNorthern EuropeNorwayOceaniaPakistanPanamaPeruPhilippinesPolandPortugalRomaniaRussiaSaudi ArabiaScotlandSenegalSerbiaSierra LeoneSingaporeSomaliaSouth AfricaSouth AmericaSouth Central AsiaSouth Eastern AsiaSouthern EuropeSpainSri LankaSt. Vincent and the GrenadinesSudanSwedenSwitzerlandSyriaTaiwanThailandTrinidad and TobagoTurkeyUgandaUkraineUruguayUzbekistanVenezuelaVietnamWest IndiesWestern AfricaWestern AsiaWestern EuropeYemenZaireZimbabwe
Immigrant Origin (Percentage)
AfghanistanAfricaAlbaniaArgentinaArmeniaAsiaAustraliaAustriaAzoresBahamasBangladeshBarbadosBelarusBelgiumBelizeBoliviaBosnia and HerzegovinaBrazilBulgariaBurma / MyanmarCabo VerdeCambodiaCameroonCanadaCaribbeanCentral AmericaChileChinaColombiaCongoCosta RicaCroatiaCubaCzechoslovakiaDenmarkDominicaDominican RepublicEastern AfricaEastern AsiaEastern EuropeEcuadorEgyptEl SalvadorEnglandEritreaEthiopiaEuropeFijiFranceGermanyGhanaGreeceGrenadaGuatemalaGuyanaHaitiHondurasHong KongHungaryIndiaIndonesiaIranIraqIrelandIsraelItalyJamaicaJapanJordanKazakhstanKenyaKoreaKuwaitLaosLatin AmericaLatviaLebanonLiberiaLithuaniaMalaysiaMexicoMicronesiaMiddle AfricaMoldovaMoroccoNepalNetherlandsNicaraguaNigeriaNorth MacedoniaNorthern AfricaNorthern EuropeNorwayOceaniaPakistanPanamaPeruPhilippinesPolandPortugalRomaniaRussiaSaudi ArabiaScotlandSenegalSerbiaSierra LeoneSingaporeSomaliaSouth AfricaSouth AmericaSouth Central AsiaSouth Eastern AsiaSouthern EuropeSpainSri LankaSt. Vincent and the GrenadinesSudanSwedenSwitzerlandSyriaTaiwanThailandTrinidad and TobagoTurkeyUgandaUkraineUruguayUzbekistanVenezuelaVietnamWest IndiesWestern AfricaWestern AsiaWestern EuropeYemenZaireZimbabwe
Income
Income (Families)
Income (Households)
Poverty
Poverty (Families)
Unemployment
Employment Occupations
Employment Industries
Employer Class
Commute Time
Commute Means
School Enrollment
Education by Degree Field
Occupancy
Finances
Physical Characteristics
Rhode Island
Compare Zip Codes
Comparison Subject

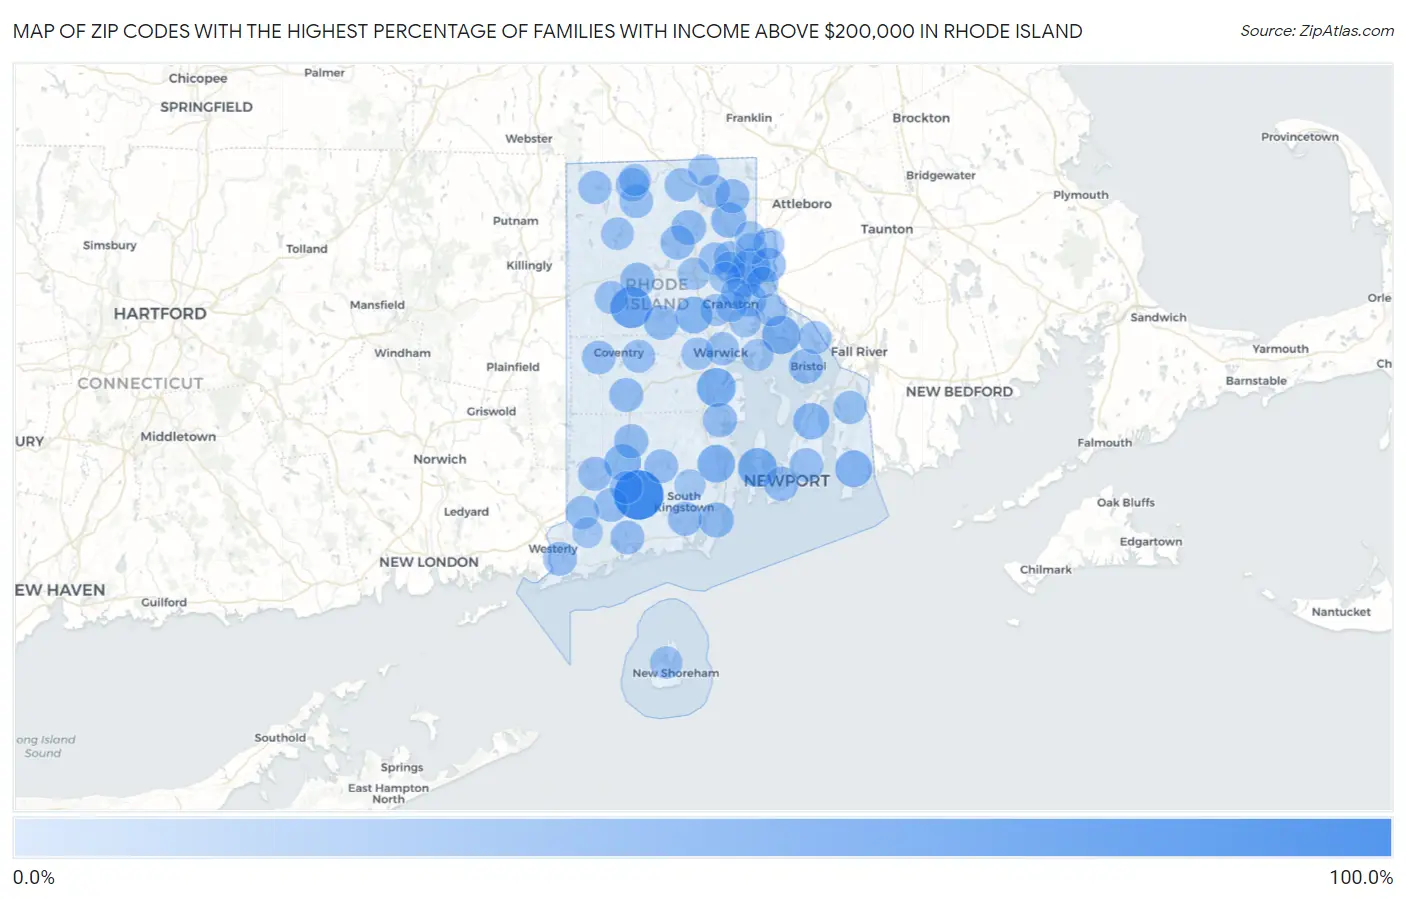
Map of Zip Codes with the Highest Percentage of Families with Income Above $200,000 in Rhode Island

0.0%
100.0%
Zip Codes with the Highest Percentage of Families with Income Above $200,000 in Rhode Island Map

Zip Codes with the Highest Percentage of Families with Income Above $200,000 in Rhode Island

Zip Code Families with Income > $200k vs State vs National
1.02875100.0%15.7%(+84.3)#114.8%(+85.2)#13
2.0281556.7%15.7%(+41.0)#214.8%(+41.9)#395
3.0281844.1%15.7%(+28.4)#314.8%(+29.3)#986
4.0283543.7%15.7%(+28.0)#414.8%(+28.9)#1,009
5.0280640.5%15.7%(+24.8)#514.8%(+25.7)#1,272
6.0290640.0%15.7%(+24.3)#614.8%(+25.2)#1,312
7.0287437.4%15.7%(+21.7)#714.8%(+22.6)#1,569
8.0283733.3%15.7%(+17.6)#814.8%(+18.5)#2,061
9.0292133.2%15.7%(+17.5)#914.8%(+18.4)#2,087
10.0289831.3%15.7%(+15.6)#1014.8%(+16.5)#2,331
11.0287130.8%15.7%(+15.1)#1114.8%(+16.0)#2,400
12.0286526.1%15.7%(+10.4)#1214.8%(+11.3)#3,219
13.0288224.5%15.7%(+8.80)#1314.8%(+9.70)#3,602
14.0283123.1%15.7%(+7.40)#1414.8%(+8.30)#3,924
15.0291722.9%15.7%(+7.20)#1514.8%(+8.10)#3,970
16.0280922.6%15.7%(+6.90)#1614.8%(+7.80)#4,045
17.0285722.3%15.7%(+6.60)#1714.8%(+7.50)#4,136
18.0290321.8%15.7%(+6.10)#1814.8%(+7.00)#4,275
19.0284020.9%15.7%(+5.20)#1914.8%(+6.10)#4,535
20.0285220.8%15.7%(+5.10)#2014.8%(+6.00)#4,568
21.0291620.7%15.7%(+5.00)#2114.8%(+5.90)#4,608
22.0282220.2%15.7%(+4.50)#2214.8%(+5.40)#4,756
23.0286419.8%15.7%(+4.10)#2314.8%(+5.00)#4,884
24.0282819.7%15.7%(+4.00)#2414.8%(+4.90)#4,913
25.0287919.6%15.7%(+3.90)#2514.8%(+4.80)#4,944
26.0281719.5%15.7%(+3.80)#2614.8%(+4.70)#4,980
27.0289118.6%15.7%(+2.90)#2714.8%(+3.80)#5,324
28.0281318.4%15.7%(+2.70)#2814.8%(+3.60)#5,425
29.0289218.3%15.7%(+2.60)#2914.8%(+3.50)#5,464
30.0283218.3%15.7%(+2.60)#3014.8%(+3.50)#5,465
31.0284217.8%15.7%(+2.10)#3114.8%(+3.00)#5,644
32.0289417.8%15.7%(+2.10)#3214.8%(+3.00)#5,665
33.0282717.5%15.7%(+1.80)#3314.8%(+2.70)#5,789
34.0283917.3%15.7%(+1.60)#3414.8%(+2.50)#5,877
35.0285916.4%15.7%(+0.700)#3514.8%(+1.60)#6,260
36.0289616.3%15.7%(+0.600)#3614.8%(+1.50)#6,305
37.0280416.3%15.7%(+0.600)#3714.8%(+1.50)#6,318
38.0283016.1%15.7%(+0.400)#3814.8%(+1.30)#6,412
39.0287815.5%15.7%(-0.200)#3914.8%(+0.700)#6,697
40.0288615.2%15.7%(-0.500)#4014.8%(+0.400)#6,844
41.0290515.2%15.7%(-0.500)#4114.8%(+0.400)#6,848
42.0281614.5%15.7%(-1.20)#4214.8%(-0.300)#7,261
43.0288514.2%15.7%(-1.50)#4314.8%(-0.600)#7,447
44.0282514.1%15.7%(-1.60)#4414.8%(-0.700)#7,492
45.0281213.7%15.7%(-2.00)#4514.8%(-1.10)#7,785
46.0283813.3%15.7%(-2.40)#4614.8%(-1.50)#8,020
47.0281412.6%15.7%(-3.10)#4714.8%(-2.20)#8,512
48.0291112.5%15.7%(-3.20)#4814.8%(-2.30)#8,579
49.0290412.2%15.7%(-3.50)#4914.8%(-2.60)#8,798
50.0280711.1%15.7%(-4.60)#5014.8%(-3.70)#9,771
51.0291510.8%15.7%(-4.90)#5114.8%(-4.00)#10,013
52.0289310.6%15.7%(-5.10)#5214.8%(-4.20)#10,206
53.0291910.3%15.7%(-5.40)#5314.8%(-4.50)#10,477
54.0292010.1%15.7%(-5.60)#5414.8%(-4.70)#10,685
55.028269.5%15.7%(-6.20)#5514.8%(-5.30)#11,392
56.028899.1%15.7%(-6.60)#5614.8%(-5.70)#11,774
57.028888.9%15.7%(-6.80)#5714.8%(-5.90)#12,029
58.029088.3%15.7%(-7.40)#5814.8%(-6.50)#12,766
59.029147.5%15.7%(-8.20)#5914.8%(-7.30)#13,875
60.029106.9%15.7%(-8.80)#6014.8%(-7.90)#14,871
61.028606.6%15.7%(-9.10)#6114.8%(-8.20)#15,357
62.028956.5%15.7%(-9.20)#6214.8%(-8.30)#15,503
63.028615.6%15.7%(-10.1)#6314.8%(-9.20)#17,165
64.029095.1%15.7%(-10.6)#6414.8%(-9.70)#18,167
65.028814.7%15.7%(-11.0)#6514.8%(-10.1)#19,044
66.029072.5%15.7%(-13.2)#6614.8%(-12.3)#23,491
67.028081.8%15.7%(-13.9)#6714.8%(-13.0)#24,866
68.028630.40%15.7%(-15.3)#6814.8%(-14.4)#26,801

Common Questions

What are the Top 10 Zip Codes with the Highest Percentage of Families with Income Above $200,000 in Rhode Island?
Top 10 Zip Codes with the Highest Percentage of Families with Income Above $200,000 in Rhode Island are:
#1
100.0%
#2
56.7%
#3
44.1%
#4
43.7%
#5
40.5%
#6
40.0%
#7
37.4%
#8
33.3%
#9
33.2%
#10
31.3%
What zip code has the Highest Percentage of Families with Income Above $200,000 in Rhode Island?
02875 has the Highest Percentage of Families with Income Above $200,000 in Rhode Island with 100.0%.
What is the Percentage of Families with Income Above $200,000 in the State of Rhode Island?
Percentage of Families with Income Above $200,000 in Rhode Island is 15.7%.
What is the Percentage of Families with Income Above $200,000 in the United States?
Percentage of Families with Income Above $200,000 in the United States is 14.8%.