Zip Codes with the Highest Percentage of Families with Income Above $200,000 in Florida
RELATED REPORTS & OPTIONS
Family Income | $200k+
Florida
Compare Zip Codes
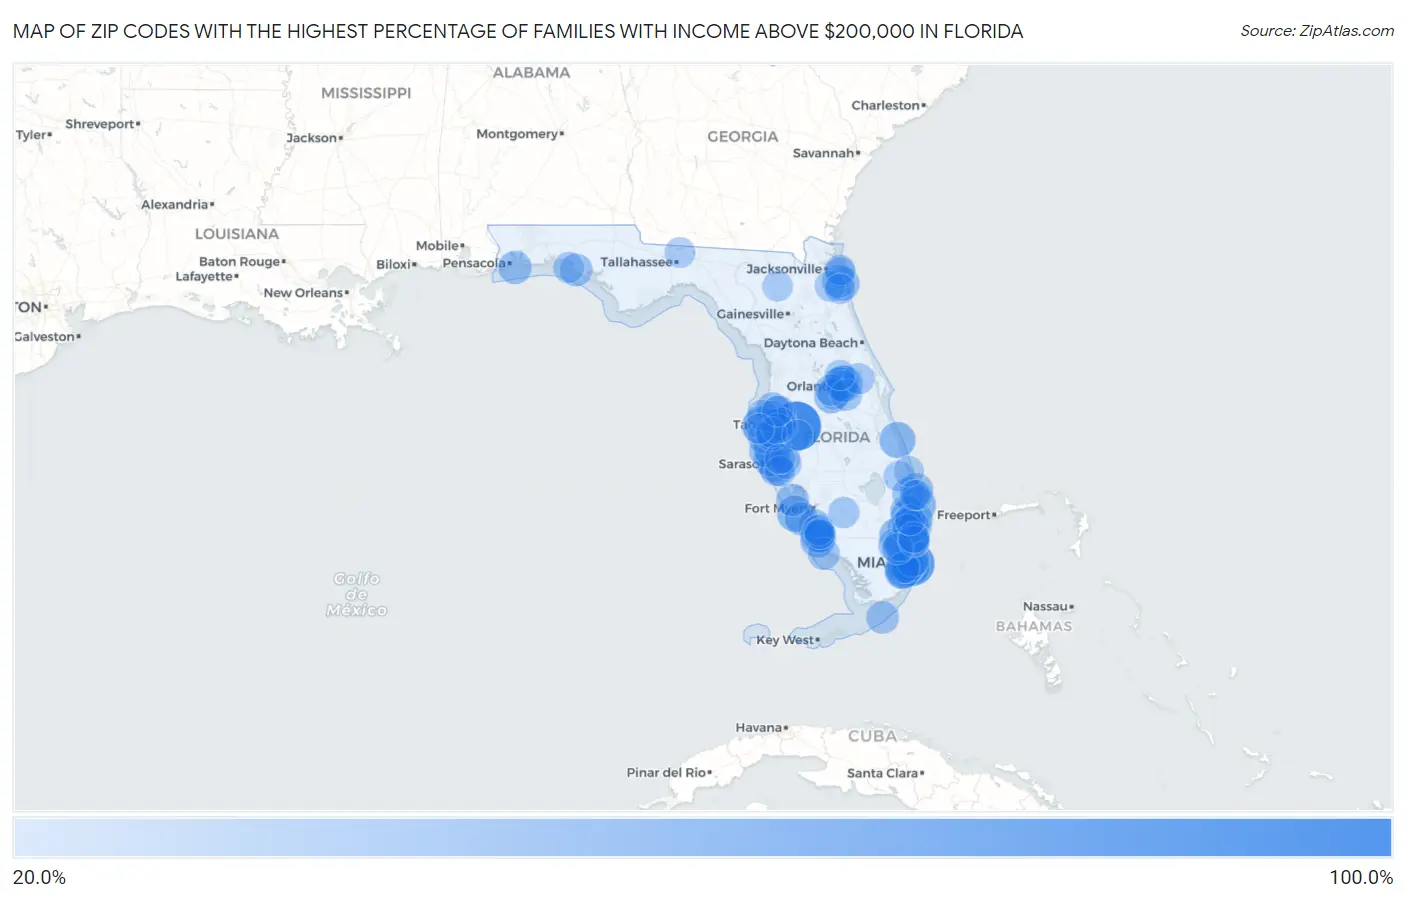
Map of Zip Codes with the Highest Percentage of Families with Income Above $200,000 in Florida
20.0%
100.0%
Zip Codes with the Highest Percentage of Families with Income Above $200,000 in Florida
| Zip Code | Families with Income > $200k | vs State | vs National | |
| 1. | 33530 | 100.0% | 11.5%(+88.5)#1 | 14.8%(+85.2)#46 |
| 2. | 33109 | 78.8% | 11.5%(+67.3)#2 | 14.8%(+64.0)#69 |
| 3. | 33146 | 58.7% | 11.5%(+47.2)#3 | 14.8%(+43.9)#336 |
| 4. | 33149 | 53.6% | 11.5%(+42.1)#4 | 14.8%(+38.8)#512 |
| 5. | 33480 | 50.0% | 11.5%(+38.5)#5 | 14.8%(+35.2)#657 |
| 6. | 34250 | 50.0% | 11.5%(+38.5)#6 | 14.8%(+35.2)#664 |
| 7. | 33629 | 48.7% | 11.5%(+37.2)#7 | 14.8%(+33.9)#725 |
| 8. | 32963 | 47.1% | 11.5%(+35.6)#8 | 14.8%(+32.3)#809 |
| 9. | 33156 | 46.8% | 11.5%(+35.3)#9 | 14.8%(+32.0)#824 |
| 10. | 33924 | 46.7% | 11.5%(+35.2)#10 | 14.8%(+31.9)#833 |
| 11. | 33158 | 45.4% | 11.5%(+33.9)#11 | 14.8%(+30.6)#919 |
| 12. | 32814 | 45.3% | 11.5%(+33.8)#12 | 14.8%(+30.5)#922 |
| 13. | 33606 | 45.0% | 11.5%(+33.5)#13 | 14.8%(+30.2)#936 |
| 14. | 33473 | 44.3% | 11.5%(+32.8)#14 | 14.8%(+29.5)#977 |
| 15. | 34102 | 42.7% | 11.5%(+31.2)#15 | 14.8%(+27.9)#1,071 |
| 16. | 33076 | 41.7% | 11.5%(+30.2)#16 | 14.8%(+26.9)#1,166 |
| 17. | 33704 | 41.7% | 11.5%(+30.2)#17 | 14.8%(+26.9)#1,171 |
| 18. | 33301 | 40.8% | 11.5%(+29.3)#18 | 14.8%(+26.0)#1,243 |
| 19. | 32789 | 40.6% | 11.5%(+29.1)#19 | 14.8%(+25.8)#1,261 |
| 20. | 33131 | 40.6% | 11.5%(+29.1)#20 | 14.8%(+25.8)#1,264 |
| 21. | 32830 | 40.0% | 11.5%(+28.5)#21 | 14.8%(+25.2)#1,319 |
| 22. | 32082 | 39.9% | 11.5%(+28.4)#22 | 14.8%(+25.1)#1,324 |
| 23. | 33327 | 39.7% | 11.5%(+28.2)#23 | 14.8%(+24.9)#1,337 |
| 24. | 34236 | 39.4% | 11.5%(+27.9)#24 | 14.8%(+24.6)#1,374 |
| 25. | 33477 | 39.4% | 11.5%(+27.9)#25 | 14.8%(+24.6)#1,375 |
| 26. | 33548 | 39.4% | 11.5%(+27.9)#26 | 14.8%(+24.6)#1,379 |
| 27. | 33786 | 39.3% | 11.5%(+27.8)#27 | 14.8%(+24.5)#1,388 |
| 28. | 34242 | 39.0% | 11.5%(+27.5)#28 | 14.8%(+24.2)#1,412 |
| 29. | 33432 | 37.7% | 11.5%(+26.2)#29 | 14.8%(+22.9)#1,526 |
| 30. | 34134 | 37.7% | 11.5%(+26.2)#30 | 14.8%(+22.9)#1,529 |
| 31. | 33133 | 37.4% | 11.5%(+25.9)#31 | 14.8%(+22.6)#1,565 |
| 32. | 33140 | 37.3% | 11.5%(+25.8)#32 | 14.8%(+22.5)#1,574 |
| 33. | 32561 | 37.1% | 11.5%(+25.6)#33 | 14.8%(+22.3)#1,595 |
| 34. | 34108 | 37.0% | 11.5%(+25.5)#34 | 14.8%(+22.2)#1,606 |
| 35. | 33332 | 36.8% | 11.5%(+25.3)#35 | 14.8%(+22.0)#1,624 |
| 36. | 33957 | 36.6% | 11.5%(+25.1)#36 | 14.8%(+21.8)#1,661 |
| 37. | 32804 | 36.4% | 11.5%(+24.9)#37 | 14.8%(+21.6)#1,683 |
| 38. | 34103 | 36.4% | 11.5%(+24.9)#38 | 14.8%(+21.6)#1,688 |
| 39. | 33418 | 36.1% | 11.5%(+24.6)#39 | 14.8%(+21.3)#1,716 |
| 40. | 33496 | 36.1% | 11.5%(+24.6)#40 | 14.8%(+21.3)#1,718 |
| 41. | 33483 | 36.1% | 11.5%(+24.6)#41 | 14.8%(+21.3)#1,719 |
| 42. | 32081 | 36.0% | 11.5%(+24.5)#42 | 14.8%(+21.2)#1,728 |
| 43. | 33556 | 35.4% | 11.5%(+23.9)#43 | 14.8%(+20.6)#1,786 |
| 44. | 34228 | 35.4% | 11.5%(+23.9)#44 | 14.8%(+20.6)#1,792 |
| 45. | 32461 | 34.8% | 11.5%(+23.3)#45 | 14.8%(+20.0)#1,868 |
| 46. | 33036 | 34.3% | 11.5%(+22.8)#46 | 14.8%(+19.5)#1,927 |
| 47. | 33921 | 34.3% | 11.5%(+22.8)#47 | 14.8%(+19.5)#1,930 |
| 48. | 33330 | 34.1% | 11.5%(+22.6)#48 | 14.8%(+19.3)#1,950 |
| 49. | 34105 | 34.0% | 11.5%(+22.5)#49 | 14.8%(+19.2)#1,961 |
| 50. | 33602 | 32.7% | 11.5%(+21.2)#50 | 14.8%(+17.9)#2,139 |
| 51. | 33449 | 32.7% | 11.5%(+21.2)#51 | 14.8%(+17.9)#2,141 |
| 52. | 33767 | 32.7% | 11.5%(+21.2)#52 | 14.8%(+17.9)#2,143 |
| 53. | 33706 | 32.6% | 11.5%(+21.1)#53 | 14.8%(+17.8)#2,154 |
| 54. | 32836 | 32.4% | 11.5%(+20.9)#54 | 14.8%(+17.6)#2,179 |
| 55. | 33304 | 32.3% | 11.5%(+20.8)#55 | 14.8%(+17.5)#2,190 |
| 56. | 33609 | 32.1% | 11.5%(+20.6)#56 | 14.8%(+17.3)#2,212 |
| 57. | 34145 | 31.9% | 11.5%(+20.4)#57 | 14.8%(+17.1)#2,241 |
| 58. | 34786 | 31.7% | 11.5%(+20.2)#58 | 14.8%(+16.9)#2,265 |
| 59. | 33306 | 31.7% | 11.5%(+20.2)#59 | 14.8%(+16.9)#2,272 |
| 60. | 34216 | 31.0% | 11.5%(+19.5)#60 | 14.8%(+16.2)#2,378 |
| 61. | 33331 | 30.9% | 11.5%(+19.4)#61 | 14.8%(+16.1)#2,385 |
| 62. | 33305 | 30.7% | 11.5%(+19.2)#62 | 14.8%(+15.9)#2,419 |
| 63. | 33143 | 30.4% | 11.5%(+18.9)#63 | 14.8%(+15.6)#2,454 |
| 64. | 32801 | 30.3% | 11.5%(+18.8)#64 | 14.8%(+15.5)#2,480 |
| 65. | 32827 | 29.6% | 11.5%(+18.1)#65 | 14.8%(+14.8)#2,574 |
| 66. | 34110 | 29.5% | 11.5%(+18.0)#66 | 14.8%(+14.7)#2,588 |
| 67. | 33486 | 29.5% | 11.5%(+18.0)#67 | 14.8%(+14.7)#2,590 |
| 68. | 33498 | 28.9% | 11.5%(+17.4)#68 | 14.8%(+14.1)#2,695 |
| 69. | 32459 | 28.8% | 11.5%(+17.3)#69 | 14.8%(+14.0)#2,709 |
| 70. | 33930 | 28.8% | 11.5%(+17.3)#70 | 14.8%(+14.0)#2,721 |
| 71. | 33626 | 28.6% | 11.5%(+17.1)#71 | 14.8%(+13.8)#2,746 |
| 72. | 32766 | 28.6% | 11.5%(+17.1)#72 | 14.8%(+13.8)#2,754 |
| 73. | 33067 | 28.5% | 11.5%(+17.0)#73 | 14.8%(+13.7)#2,778 |
| 74. | 33316 | 28.5% | 11.5%(+17.0)#74 | 14.8%(+13.7)#2,785 |
| 75. | 33029 | 28.3% | 11.5%(+16.8)#75 | 14.8%(+13.5)#2,809 |
| 76. | 32250 | 27.7% | 11.5%(+16.2)#76 | 14.8%(+12.9)#2,910 |
| 77. | 33701 | 27.6% | 11.5%(+16.1)#77 | 14.8%(+12.8)#2,932 |
| 78. | 34681 | 27.6% | 11.5%(+16.1)#78 | 14.8%(+12.8)#2,940 |
| 79. | 33611 | 27.3% | 11.5%(+15.8)#79 | 14.8%(+12.5)#2,992 |
| 80. | 33703 | 27.2% | 11.5%(+15.7)#80 | 14.8%(+12.4)#3,021 |
| 81. | 32259 | 26.8% | 11.5%(+15.3)#81 | 14.8%(+12.0)#3,079 |
| 82. | 33558 | 26.8% | 11.5%(+15.3)#82 | 14.8%(+12.0)#3,082 |
| 83. | 32312 | 26.6% | 11.5%(+15.1)#83 | 14.8%(+11.8)#3,125 |
| 84. | 34990 | 26.6% | 11.5%(+15.1)#84 | 14.8%(+11.8)#3,127 |
| 85. | 33308 | 26.6% | 11.5%(+15.1)#85 | 14.8%(+11.8)#3,128 |
| 86. | 33446 | 26.6% | 11.5%(+15.1)#86 | 14.8%(+11.8)#3,129 |
| 87. | 34109 | 26.5% | 11.5%(+15.0)#87 | 14.8%(+11.7)#3,145 |
| 88. | 33408 | 26.5% | 11.5%(+15.0)#88 | 14.8%(+11.7)#3,148 |
| 89. | 34240 | 26.5% | 11.5%(+15.0)#89 | 14.8%(+11.7)#3,150 |
| 90. | 34202 | 26.4% | 11.5%(+14.9)#90 | 14.8%(+11.6)#3,161 |
| 91. | 34238 | 26.3% | 11.5%(+14.8)#91 | 14.8%(+11.5)#3,181 |
| 92. | 32061 | 26.3% | 11.5%(+14.8)#92 | 14.8%(+11.5)#3,191 |
| 93. | 34201 | 26.2% | 11.5%(+14.7)#93 | 14.8%(+11.4)#3,201 |
| 94. | 33547 | 26.1% | 11.5%(+14.6)#94 | 14.8%(+11.3)#3,214 |
| 95. | 32779 | 25.9% | 11.5%(+14.4)#95 | 14.8%(+11.1)#3,265 |
| 96. | 32266 | 25.9% | 11.5%(+14.4)#96 | 14.8%(+11.1)#3,274 |
| 97. | 32095 | 25.8% | 11.5%(+14.3)#97 | 14.8%(+11.0)#3,286 |
| 98. | 34996 | 25.7% | 11.5%(+14.2)#98 | 14.8%(+10.9)#3,304 |
| 99. | 33785 | 25.7% | 11.5%(+14.2)#99 | 14.8%(+10.9)#3,306 |
| 100. | 33410 | 25.4% | 11.5%(+13.9)#100 | 14.8%(+10.6)#3,361 |
Common Questions
What are the Top 10 Zip Codes with the Highest Percentage of Families with Income Above $200,000 in Florida?
Top 10 Zip Codes with the Highest Percentage of Families with Income Above $200,000 in Florida are:
What zip code has the Highest Percentage of Families with Income Above $200,000 in Florida?
33530 has the Highest Percentage of Families with Income Above $200,000 in Florida with 100.0%.
What is the Percentage of Families with Income Above $200,000 in the State of Florida?
Percentage of Families with Income Above $200,000 in Florida is 11.5%.
What is the Percentage of Families with Income Above $200,000 in the United States?
Percentage of Families with Income Above $200,000 in the United States is 14.8%.