Zip Codes with the Highest Percentage of Families with Income Above $200,000 in Texas
RELATED REPORTS & OPTIONS
Family Income | $200k+
Texas
Compare Zip Codes
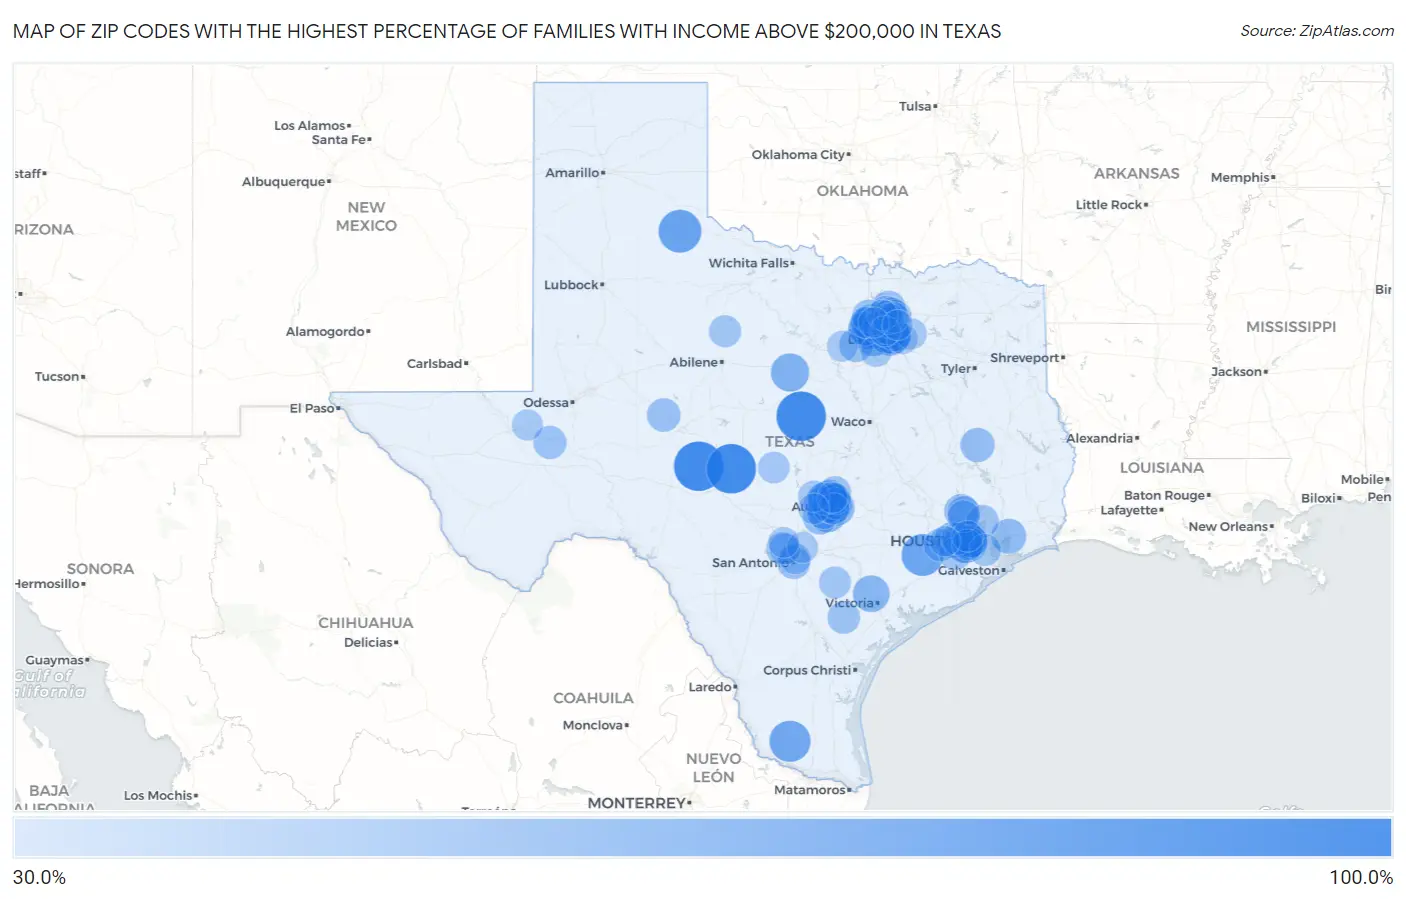
Map of Zip Codes with the Highest Percentage of Families with Income Above $200,000 in Texas
30.0%
100.0%
Zip Codes with the Highest Percentage of Families with Income Above $200,000 in Texas
| Zip Code | Families with Income > $200k | vs State | vs National | |
| 1. | 76841 | 100.0% | 13.5%(+86.5)#1 | 14.8%(+85.2)#10 |
| 2. | 76848 | 100.0% | 13.5%(+86.5)#2 | 14.8%(+85.2)#29 |
| 3. | 76565 | 100.0% | 13.5%(+86.5)#3 | 14.8%(+85.2)#37 |
| 4. | 79259 | 76.2% | 13.5%(+62.7)#4 | 14.8%(+61.4)#77 |
| 5. | 77454 | 72.7% | 13.5%(+59.2)#5 | 14.8%(+57.9)#94 |
| 6. | 78591 | 69.8% | 13.5%(+56.3)#6 | 14.8%(+55.0)#125 |
| 7. | 76092 | 66.6% | 13.5%(+53.1)#7 | 14.8%(+51.8)#166 |
| 8. | 77005 | 63.9% | 13.5%(+50.4)#8 | 14.8%(+49.1)#207 |
| 9. | 75205 | 62.1% | 13.5%(+48.6)#9 | 14.8%(+47.3)#241 |
| 10. | 75225 | 60.6% | 13.5%(+47.1)#10 | 14.8%(+45.8)#283 |
| 11. | 77401 | 60.3% | 13.5%(+46.8)#11 | 14.8%(+45.5)#294 |
| 12. | 76445 | 59.4% | 13.5%(+45.9)#12 | 14.8%(+44.6)#318 |
| 13. | 78732 | 59.0% | 13.5%(+45.5)#13 | 14.8%(+44.2)#321 |
| 14. | 78739 | 56.2% | 13.5%(+42.7)#14 | 14.8%(+41.4)#408 |
| 15. | 76005 | 55.6% | 13.5%(+42.1)#15 | 14.8%(+40.8)#432 |
| 16. | 77008 | 55.4% | 13.5%(+41.9)#16 | 14.8%(+40.6)#440 |
| 17. | 78746 | 55.4% | 13.5%(+41.9)#17 | 14.8%(+40.6)#441 |
| 18. | 76034 | 55.4% | 13.5%(+41.9)#18 | 14.8%(+40.6)#442 |
| 19. | 75209 | 55.4% | 13.5%(+41.9)#19 | 14.8%(+40.6)#444 |
| 20. | 77976 | 54.5% | 13.5%(+41.0)#20 | 14.8%(+39.7)#477 |
| 21. | 78701 | 54.3% | 13.5%(+40.8)#21 | 14.8%(+39.5)#490 |
| 22. | 75022 | 53.8% | 13.5%(+40.3)#22 | 14.8%(+39.0)#502 |
| 23. | 77024 | 52.4% | 13.5%(+38.9)#23 | 14.8%(+37.6)#554 |
| 24. | 77007 | 52.3% | 13.5%(+38.8)#24 | 14.8%(+37.5)#559 |
| 25. | 78733 | 51.5% | 13.5%(+38.0)#25 | 14.8%(+36.7)#592 |
| 26. | 75214 | 51.2% | 13.5%(+37.7)#26 | 14.8%(+36.4)#607 |
| 27. | 75230 | 51.1% | 13.5%(+37.6)#27 | 14.8%(+36.3)#613 |
| 28. | 77094 | 51.1% | 13.5%(+37.6)#28 | 14.8%(+36.3)#616 |
| 29. | 78703 | 50.4% | 13.5%(+36.9)#29 | 14.8%(+35.6)#644 |
| 30. | 77019 | 50.3% | 13.5%(+36.8)#30 | 14.8%(+35.5)#647 |
| 31. | 77597 | 48.4% | 13.5%(+34.9)#31 | 14.8%(+33.6)#742 |
| 32. | 78730 | 47.1% | 13.5%(+33.6)#32 | 14.8%(+32.3)#813 |
| 33. | 77006 | 46.7% | 13.5%(+33.2)#33 | 14.8%(+31.9)#829 |
| 34. | 75856 | 46.2% | 13.5%(+32.7)#34 | 14.8%(+31.4)#858 |
| 35. | 77382 | 45.7% | 13.5%(+32.2)#35 | 14.8%(+30.9)#888 |
| 36. | 76109 | 45.6% | 13.5%(+32.1)#36 | 14.8%(+30.8)#896 |
| 37. | 78619 | 45.5% | 13.5%(+32.0)#37 | 14.8%(+30.7)#908 |
| 38. | 78738 | 44.8% | 13.5%(+31.3)#38 | 14.8%(+30.0)#946 |
| 39. | 76248 | 44.6% | 13.5%(+31.1)#39 | 14.8%(+29.8)#953 |
| 40. | 78731 | 44.5% | 13.5%(+31.0)#40 | 14.8%(+29.7)#959 |
| 41. | 76958 | 43.8% | 13.5%(+30.3)#41 | 14.8%(+29.0)#1,005 |
| 42. | 75078 | 43.0% | 13.5%(+29.5)#42 | 14.8%(+28.2)#1,053 |
| 43. | 78726 | 42.6% | 13.5%(+29.1)#43 | 14.8%(+27.8)#1,079 |
| 44. | 75033 | 42.5% | 13.5%(+29.0)#44 | 14.8%(+27.7)#1,087 |
| 45. | 78737 | 42.5% | 13.5%(+29.0)#45 | 14.8%(+27.7)#1,092 |
| 46. | 76226 | 42.4% | 13.5%(+28.9)#46 | 14.8%(+27.6)#1,104 |
| 47. | 79743 | 42.3% | 13.5%(+28.8)#47 | 14.8%(+27.5)#1,119 |
| 48. | 78205 | 41.9% | 13.5%(+28.4)#48 | 14.8%(+27.1)#1,152 |
| 49. | 78735 | 41.6% | 13.5%(+28.1)#49 | 14.8%(+26.8)#1,180 |
| 50. | 75013 | 41.4% | 13.5%(+27.9)#50 | 14.8%(+26.6)#1,189 |
| 51. | 77381 | 40.8% | 13.5%(+27.3)#51 | 14.8%(+26.0)#1,240 |
| 52. | 77027 | 40.6% | 13.5%(+27.1)#52 | 14.8%(+25.8)#1,265 |
| 53. | 78255 | 40.6% | 13.5%(+27.1)#53 | 14.8%(+25.8)#1,266 |
| 54. | 77345 | 40.5% | 13.5%(+27.0)#54 | 14.8%(+25.7)#1,271 |
| 55. | 75035 | 40.1% | 13.5%(+26.6)#55 | 14.8%(+25.3)#1,296 |
| 56. | 77056 | 40.1% | 13.5%(+26.6)#56 | 14.8%(+25.3)#1,304 |
| 57. | 77441 | 40.0% | 13.5%(+26.5)#57 | 14.8%(+25.2)#1,311 |
| 58. | 78107 | 40.0% | 13.5%(+26.5)#58 | 14.8%(+25.2)#1,316 |
| 59. | 75019 | 39.9% | 13.5%(+26.4)#59 | 14.8%(+25.1)#1,323 |
| 60. | 78717 | 39.7% | 13.5%(+26.2)#60 | 14.8%(+24.9)#1,335 |
| 61. | 77030 | 39.7% | 13.5%(+26.2)#61 | 14.8%(+24.9)#1,339 |
| 62. | 75218 | 39.6% | 13.5%(+26.1)#62 | 14.8%(+24.8)#1,347 |
| 63. | 77098 | 39.3% | 13.5%(+25.8)#63 | 14.8%(+24.5)#1,384 |
| 64. | 77479 | 39.2% | 13.5%(+25.7)#64 | 14.8%(+24.4)#1,390 |
| 65. | 77010 | 39.2% | 13.5%(+25.7)#65 | 14.8%(+24.4)#1,399 |
| 66. | 78734 | 39.1% | 13.5%(+25.6)#66 | 14.8%(+24.3)#1,402 |
| 67. | 77079 | 38.6% | 13.5%(+25.1)#67 | 14.8%(+23.8)#1,448 |
| 68. | 79503 | 38.5% | 13.5%(+25.0)#68 | 14.8%(+23.7)#1,468 |
| 69. | 77059 | 38.1% | 13.5%(+24.6)#69 | 14.8%(+23.3)#1,495 |
| 70. | 77389 | 38.0% | 13.5%(+24.5)#70 | 14.8%(+23.2)#1,501 |
| 71. | 78116 | 38.0% | 13.5%(+24.5)#71 | 14.8%(+23.2)#1,508 |
| 72. | 76262 | 37.1% | 13.5%(+23.6)#72 | 14.8%(+22.3)#1,588 |
| 73. | 76885 | 36.8% | 13.5%(+23.3)#73 | 14.8%(+22.0)#1,637 |
| 74. | 75093 | 36.3% | 13.5%(+22.8)#74 | 14.8%(+21.5)#1,699 |
| 75. | 78756 | 36.1% | 13.5%(+22.6)#75 | 14.8%(+21.3)#1,720 |
| 76. | 78759 | 36.0% | 13.5%(+22.5)#76 | 14.8%(+21.2)#1,723 |
| 77. | 78704 | 35.6% | 13.5%(+22.1)#77 | 14.8%(+20.8)#1,765 |
| 78. | 78209 | 35.6% | 13.5%(+22.1)#78 | 14.8%(+20.8)#1,766 |
| 79. | 78256 | 35.5% | 13.5%(+22.0)#79 | 14.8%(+20.7)#1,782 |
| 80. | 77025 | 35.4% | 13.5%(+21.9)#80 | 14.8%(+20.6)#1,787 |
| 81. | 75054 | 35.4% | 13.5%(+21.9)#81 | 14.8%(+20.6)#1,791 |
| 82. | 78669 | 35.3% | 13.5%(+21.8)#82 | 14.8%(+20.5)#1,805 |
| 83. | 77018 | 35.2% | 13.5%(+21.7)#83 | 14.8%(+20.4)#1,818 |
| 84. | 75034 | 35.1% | 13.5%(+21.6)#84 | 14.8%(+20.3)#1,826 |
| 85. | 75244 | 34.8% | 13.5%(+21.3)#85 | 14.8%(+20.0)#1,862 |
| 86. | 79777 | 34.8% | 13.5%(+21.3)#86 | 14.8%(+20.0)#1,870 |
| 87. | 75032 | 34.7% | 13.5%(+21.2)#87 | 14.8%(+19.9)#1,873 |
| 88. | 78750 | 34.5% | 13.5%(+21.0)#88 | 14.8%(+19.7)#1,903 |
| 89. | 76008 | 34.5% | 13.5%(+21.0)#89 | 14.8%(+19.7)#1,904 |
| 90. | 78266 | 34.2% | 13.5%(+20.7)#90 | 14.8%(+19.4)#1,937 |
| 91. | 78620 | 34.1% | 13.5%(+20.6)#91 | 14.8%(+19.3)#1,945 |
| 92. | 75182 | 34.0% | 13.5%(+20.5)#92 | 14.8%(+19.2)#1,962 |
| 93. | 75024 | 33.7% | 13.5%(+20.2)#93 | 14.8%(+18.9)#1,995 |
| 94. | 78015 | 33.6% | 13.5%(+20.1)#94 | 14.8%(+18.8)#2,009 |
| 95. | 75025 | 33.3% | 13.5%(+19.8)#95 | 14.8%(+18.5)#2,043 |
| 96. | 75036 | 32.9% | 13.5%(+19.4)#96 | 14.8%(+18.1)#2,112 |
| 97. | 75229 | 32.7% | 13.5%(+19.2)#97 | 14.8%(+17.9)#2,138 |
| 98. | 75028 | 32.6% | 13.5%(+19.1)#98 | 14.8%(+17.8)#2,151 |
| 99. | 77494 | 32.5% | 13.5%(+19.0)#99 | 14.8%(+17.7)#2,159 |
| 100. | 75082 | 32.5% | 13.5%(+19.0)#100 | 14.8%(+17.7)#2,165 |
Common Questions
What are the Top 10 Zip Codes with the Highest Percentage of Families with Income Above $200,000 in Texas?
Top 10 Zip Codes with the Highest Percentage of Families with Income Above $200,000 in Texas are:
What zip code has the Highest Percentage of Families with Income Above $200,000 in Texas?
76841 has the Highest Percentage of Families with Income Above $200,000 in Texas with 100.0%.
What is the Percentage of Families with Income Above $200,000 in the State of Texas?
Percentage of Families with Income Above $200,000 in Texas is 13.5%.
What is the Percentage of Families with Income Above $200,000 in the United States?
Percentage of Families with Income Above $200,000 in the United States is 14.8%.