Alsatian vs Menominee 2 or more Vehicles in Household
COMPARE
Alsatian
Menominee
2 or more Vehicles in Household
2 or more Vehicles in Household Comparison
Alsatians
Menominee
52.5%
2 OR MORE VEHICLES IN HOUSEHOLD
0.6/ 100
METRIC RATING
259th/ 347
METRIC RANK
55.3%
2 OR MORE VEHICLES IN HOUSEHOLD
46.2/ 100
METRIC RATING
177th/ 347
METRIC RANK
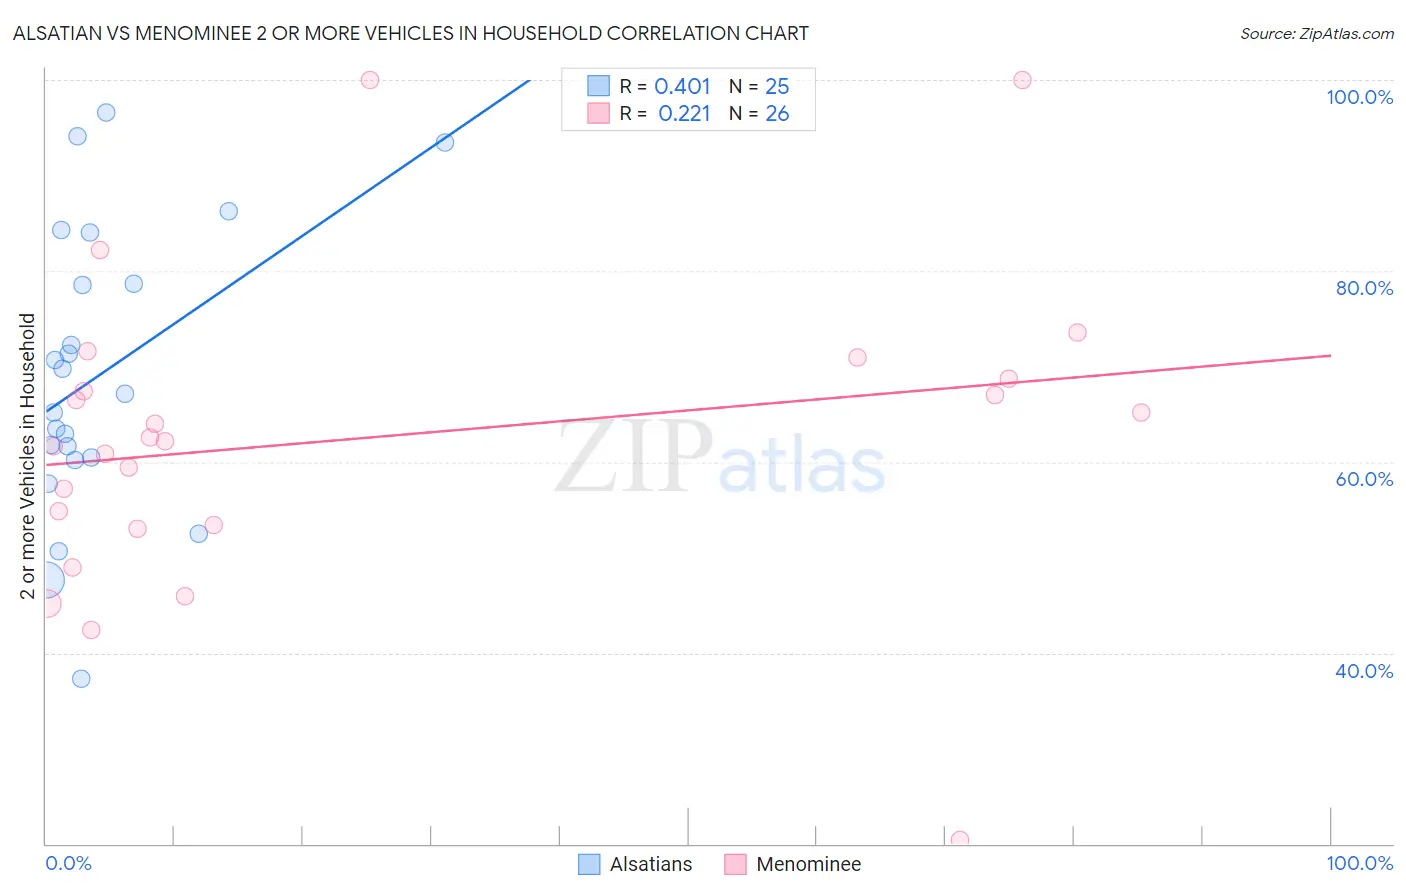
Alsatian vs Menominee 2 or more Vehicles in Household Correlation Chart
The statistical analysis conducted on geographies consisting of 82,680,020 people shows a moderate positive correlation between the proportion of Alsatians and percentage of households with 2 or more vehicles available in the United States with a correlation coefficient (R) of 0.401 and weighted average of 52.5%. Similarly, the statistical analysis conducted on geographies consisting of 45,777,849 people shows a weak positive correlation between the proportion of Menominee and percentage of households with 2 or more vehicles available in the United States with a correlation coefficient (R) of 0.221 and weighted average of 55.3%, a difference of 5.3%.
2 or more Vehicles in Household Correlation Summary
| Measurement | Alsatian | Menominee |
| Minimum | 37.2% | 20.4% |
| Maximum | 96.6% | 100.0% |
| Range | 59.4% | 79.6% |
| Mean | 69.1% | 62.5% |
| Median | 67.1% | 62.4% |
| Interquartile 25% (IQ1) | 60.3% | 53.4% |
| Interquartile 75% (IQ3) | 81.4% | 68.7% |
| Interquartile Range (IQR) | 21.1% | 15.3% |
| Standard Deviation (Sample) | 15.1% | 16.5% |
| Standard Deviation (Population) | 14.8% | 16.2% |
Similar Demographics by 2 or more Vehicles in Household
Demographics Similar to Alsatians by 2 or more Vehicles in Household
In terms of 2 or more vehicles in household, the demographic groups most similar to Alsatians are Central American Indian (52.5%, a difference of 0.040%), Immigrants from Bahamas (52.5%, a difference of 0.070%), Immigrants from Australia (52.4%, a difference of 0.10%), Immigrants from Hong Kong (52.6%, a difference of 0.14%), and Immigrants from Eritrea (52.6%, a difference of 0.28%).
| Demographics | Rating | Rank | 2 or more Vehicles in Household |
| Immigrants | Portugal | 1.0 /100 | #252 | Tragic 52.8% |
| Nigerians | 0.9 /100 | #253 | Tragic 52.8% |
| Immigrants | Malaysia | 0.8 /100 | #254 | Tragic 52.7% |
| Uruguayans | 0.7 /100 | #255 | Tragic 52.7% |
| Immigrants | Eritrea | 0.7 /100 | #256 | Tragic 52.6% |
| Immigrants | Hong Kong | 0.6 /100 | #257 | Tragic 52.6% |
| Central American Indians | 0.6 /100 | #258 | Tragic 52.5% |
| Alsatians | 0.6 /100 | #259 | Tragic 52.5% |
| Immigrants | Bahamas | 0.5 /100 | #260 | Tragic 52.5% |
| Immigrants | Australia | 0.5 /100 | #261 | Tragic 52.4% |
| Immigrants | Northern Africa | 0.4 /100 | #262 | Tragic 52.3% |
| Immigrants | Southern Europe | 0.4 /100 | #263 | Tragic 52.3% |
| Immigrants | Latvia | 0.4 /100 | #264 | Tragic 52.2% |
| Immigrants | Congo | 0.3 /100 | #265 | Tragic 52.1% |
| Immigrants | France | 0.2 /100 | #266 | Tragic 52.0% |
Demographics Similar to Menominee by 2 or more Vehicles in Household
In terms of 2 or more vehicles in household, the demographic groups most similar to Menominee are Immigrants from Cuba (55.3%, a difference of 0.030%), Immigrants from Sweden (55.2%, a difference of 0.040%), Immigrants from Denmark (55.3%, a difference of 0.13%), Alaskan Athabascan (55.2%, a difference of 0.13%), and Navajo (55.3%, a difference of 0.15%).
| Demographics | Rating | Rank | 2 or more Vehicles in Household |
| Romanians | 55.8 /100 | #170 | Average 55.5% |
| Immigrants | Costa Rica | 54.4 /100 | #171 | Average 55.4% |
| Immigrants | Nicaragua | 51.6 /100 | #172 | Average 55.4% |
| Immigrants | Western Europe | 51.4 /100 | #173 | Average 55.4% |
| Navajo | 50.0 /100 | #174 | Average 55.3% |
| Immigrants | Denmark | 49.4 /100 | #175 | Average 55.3% |
| Immigrants | Cuba | 47.0 /100 | #176 | Average 55.3% |
| Menominee | 46.2 /100 | #177 | Average 55.3% |
| Immigrants | Sweden | 45.3 /100 | #178 | Average 55.2% |
| Alaskan Athabascans | 42.9 /100 | #179 | Average 55.2% |
| Immigrants | Kenya | 40.4 /100 | #180 | Average 55.1% |
| Immigrants | Micronesia | 38.2 /100 | #181 | Fair 55.1% |
| Cree | 38.2 /100 | #182 | Fair 55.1% |
| Immigrants | Cameroon | 37.3 /100 | #183 | Fair 55.1% |
| Apache | 36.7 /100 | #184 | Fair 55.1% |