Alsatian vs Panamanian 2 or more Vehicles in Household
COMPARE
Alsatian
Panamanian
2 or more Vehicles in Household
2 or more Vehicles in Household Comparison
Alsatians
Panamanians
52.5%
2 OR MORE VEHICLES IN HOUSEHOLD
0.6/ 100
METRIC RATING
259th/ 347
METRIC RANK
53.5%
2 OR MORE VEHICLES IN HOUSEHOLD
3.4/ 100
METRIC RATING
231st/ 347
METRIC RANK
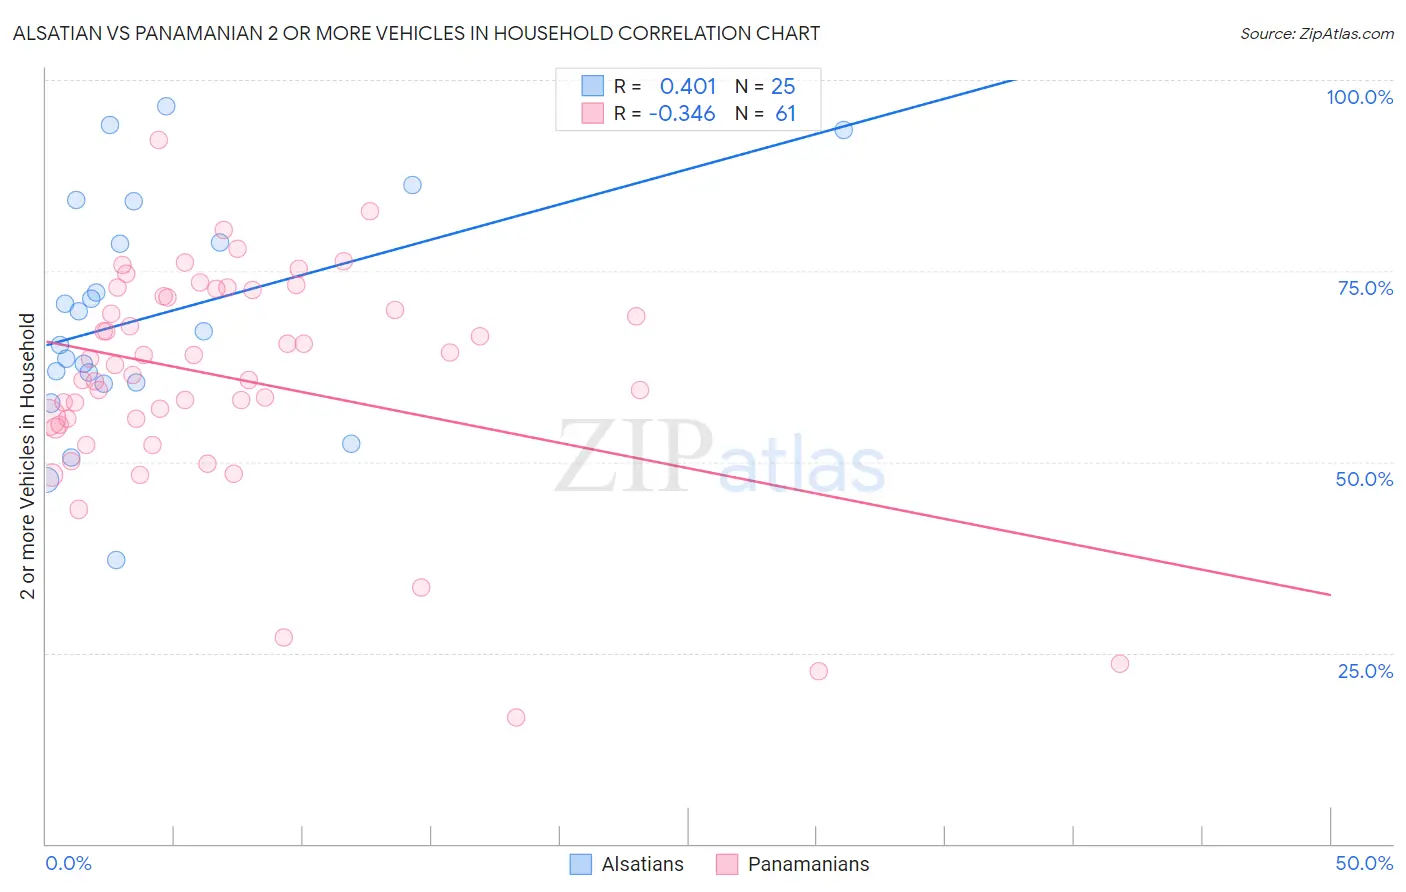
Alsatian vs Panamanian 2 or more Vehicles in Household Correlation Chart
The statistical analysis conducted on geographies consisting of 82,680,020 people shows a moderate positive correlation between the proportion of Alsatians and percentage of households with 2 or more vehicles available in the United States with a correlation coefficient (R) of 0.401 and weighted average of 52.5%. Similarly, the statistical analysis conducted on geographies consisting of 281,077,376 people shows a mild negative correlation between the proportion of Panamanians and percentage of households with 2 or more vehicles available in the United States with a correlation coefficient (R) of -0.346 and weighted average of 53.5%, a difference of 1.9%.
2 or more Vehicles in Household Correlation Summary
| Measurement | Alsatian | Panamanian |
| Minimum | 37.2% | 16.5% |
| Maximum | 96.6% | 92.2% |
| Range | 59.4% | 75.7% |
| Mean | 69.1% | 61.0% |
| Median | 67.1% | 62.7% |
| Interquartile 25% (IQ1) | 60.3% | 55.3% |
| Interquartile 75% (IQ3) | 81.4% | 72.1% |
| Interquartile Range (IQR) | 21.1% | 16.8% |
| Standard Deviation (Sample) | 15.1% | 14.6% |
| Standard Deviation (Population) | 14.8% | 14.5% |
Similar Demographics by 2 or more Vehicles in Household
Demographics Similar to Alsatians by 2 or more Vehicles in Household
In terms of 2 or more vehicles in household, the demographic groups most similar to Alsatians are Central American Indian (52.5%, a difference of 0.040%), Immigrants from Bahamas (52.5%, a difference of 0.070%), Immigrants from Australia (52.4%, a difference of 0.10%), Immigrants from Hong Kong (52.6%, a difference of 0.14%), and Immigrants from Eritrea (52.6%, a difference of 0.28%).
| Demographics | Rating | Rank | 2 or more Vehicles in Household |
| Immigrants | Portugal | 1.0 /100 | #252 | Tragic 52.8% |
| Nigerians | 0.9 /100 | #253 | Tragic 52.8% |
| Immigrants | Malaysia | 0.8 /100 | #254 | Tragic 52.7% |
| Uruguayans | 0.7 /100 | #255 | Tragic 52.7% |
| Immigrants | Eritrea | 0.7 /100 | #256 | Tragic 52.6% |
| Immigrants | Hong Kong | 0.6 /100 | #257 | Tragic 52.6% |
| Central American Indians | 0.6 /100 | #258 | Tragic 52.5% |
| Alsatians | 0.6 /100 | #259 | Tragic 52.5% |
| Immigrants | Bahamas | 0.5 /100 | #260 | Tragic 52.5% |
| Immigrants | Australia | 0.5 /100 | #261 | Tragic 52.4% |
| Immigrants | Northern Africa | 0.4 /100 | #262 | Tragic 52.3% |
| Immigrants | Southern Europe | 0.4 /100 | #263 | Tragic 52.3% |
| Immigrants | Latvia | 0.4 /100 | #264 | Tragic 52.2% |
| Immigrants | Congo | 0.3 /100 | #265 | Tragic 52.1% |
| Immigrants | France | 0.2 /100 | #266 | Tragic 52.0% |
Demographics Similar to Panamanians by 2 or more Vehicles in Household
In terms of 2 or more vehicles in household, the demographic groups most similar to Panamanians are Immigrants from Nepal (53.5%, a difference of 0.050%), Immigrants from Guatemala (53.5%, a difference of 0.070%), Ugandan (53.5%, a difference of 0.080%), Immigrants from Turkey (53.6%, a difference of 0.11%), and Alaska Native (53.6%, a difference of 0.13%).
| Demographics | Rating | Rank | 2 or more Vehicles in Household |
| Brazilians | 5.3 /100 | #224 | Tragic 53.8% |
| Immigrants | Egypt | 5.2 /100 | #225 | Tragic 53.8% |
| Immigrants | Eastern Africa | 5.1 /100 | #226 | Tragic 53.7% |
| Sudanese | 4.1 /100 | #227 | Tragic 53.6% |
| Alaska Natives | 3.9 /100 | #228 | Tragic 53.6% |
| Immigrants | Turkey | 3.8 /100 | #229 | Tragic 53.6% |
| Immigrants | Nepal | 3.6 /100 | #230 | Tragic 53.5% |
| Panamanians | 3.4 /100 | #231 | Tragic 53.5% |
| Immigrants | Guatemala | 3.2 /100 | #232 | Tragic 53.5% |
| Ugandans | 3.2 /100 | #233 | Tragic 53.5% |
| Immigrants | Switzerland | 3.0 /100 | #234 | Tragic 53.4% |
| Immigrants | Middle Africa | 3.0 /100 | #235 | Tragic 53.4% |
| Indonesians | 2.7 /100 | #236 | Tragic 53.4% |
| Macedonians | 2.4 /100 | #237 | Tragic 53.3% |
| Immigrants | Armenia | 2.3 /100 | #238 | Tragic 53.3% |