Alsatian vs Vietnamese 2 or more Vehicles in Household
COMPARE
Alsatian
Vietnamese
2 or more Vehicles in Household
2 or more Vehicles in Household Comparison
Alsatians
Vietnamese
52.5%
2 OR MORE VEHICLES IN HOUSEHOLD
0.6/ 100
METRIC RATING
259th/ 347
METRIC RANK
38.5%
2 OR MORE VEHICLES IN HOUSEHOLD
0.0/ 100
METRIC RATING
336th/ 347
METRIC RANK
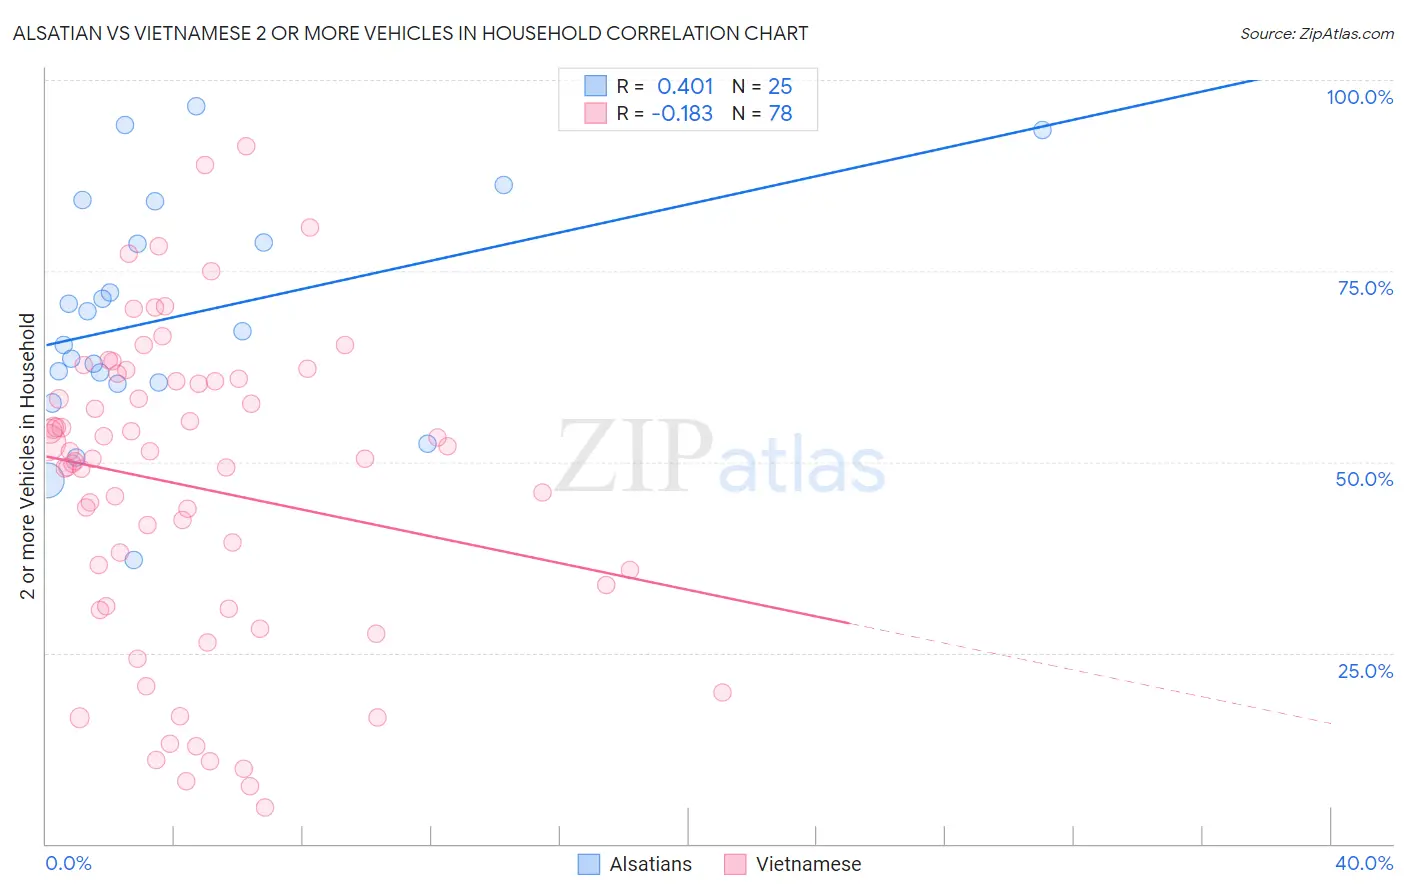
Alsatian vs Vietnamese 2 or more Vehicles in Household Correlation Chart
The statistical analysis conducted on geographies consisting of 82,680,020 people shows a moderate positive correlation between the proportion of Alsatians and percentage of households with 2 or more vehicles available in the United States with a correlation coefficient (R) of 0.401 and weighted average of 52.5%. Similarly, the statistical analysis conducted on geographies consisting of 170,680,365 people shows a poor negative correlation between the proportion of Vietnamese and percentage of households with 2 or more vehicles available in the United States with a correlation coefficient (R) of -0.183 and weighted average of 38.5%, a difference of 36.3%.
2 or more Vehicles in Household Correlation Summary
| Measurement | Alsatian | Vietnamese |
| Minimum | 37.2% | 4.7% |
| Maximum | 96.6% | 91.3% |
| Range | 59.4% | 86.6% |
| Mean | 69.1% | 46.7% |
| Median | 67.1% | 50.4% |
| Interquartile 25% (IQ1) | 60.3% | 31.1% |
| Interquartile 75% (IQ3) | 81.4% | 60.6% |
| Interquartile Range (IQR) | 21.1% | 29.5% |
| Standard Deviation (Sample) | 15.1% | 20.3% |
| Standard Deviation (Population) | 14.8% | 20.2% |
Similar Demographics by 2 or more Vehicles in Household
Demographics Similar to Alsatians by 2 or more Vehicles in Household
In terms of 2 or more vehicles in household, the demographic groups most similar to Alsatians are Central American Indian (52.5%, a difference of 0.040%), Immigrants from Bahamas (52.5%, a difference of 0.070%), Immigrants from Australia (52.4%, a difference of 0.10%), Immigrants from Hong Kong (52.6%, a difference of 0.14%), and Immigrants from Eritrea (52.6%, a difference of 0.28%).
| Demographics | Rating | Rank | 2 or more Vehicles in Household |
| Immigrants | Portugal | 1.0 /100 | #252 | Tragic 52.8% |
| Nigerians | 0.9 /100 | #253 | Tragic 52.8% |
| Immigrants | Malaysia | 0.8 /100 | #254 | Tragic 52.7% |
| Uruguayans | 0.7 /100 | #255 | Tragic 52.7% |
| Immigrants | Eritrea | 0.7 /100 | #256 | Tragic 52.6% |
| Immigrants | Hong Kong | 0.6 /100 | #257 | Tragic 52.6% |
| Central American Indians | 0.6 /100 | #258 | Tragic 52.5% |
| Alsatians | 0.6 /100 | #259 | Tragic 52.5% |
| Immigrants | Bahamas | 0.5 /100 | #260 | Tragic 52.5% |
| Immigrants | Australia | 0.5 /100 | #261 | Tragic 52.4% |
| Immigrants | Northern Africa | 0.4 /100 | #262 | Tragic 52.3% |
| Immigrants | Southern Europe | 0.4 /100 | #263 | Tragic 52.3% |
| Immigrants | Latvia | 0.4 /100 | #264 | Tragic 52.2% |
| Immigrants | Congo | 0.3 /100 | #265 | Tragic 52.1% |
| Immigrants | France | 0.2 /100 | #266 | Tragic 52.0% |
Demographics Similar to Vietnamese by 2 or more Vehicles in Household
In terms of 2 or more vehicles in household, the demographic groups most similar to Vietnamese are Barbadian (38.3%, a difference of 0.41%), Immigrants from Bangladesh (38.8%, a difference of 0.72%), Immigrants from Uzbekistan (37.9%, a difference of 1.6%), Immigrants from Trinidad and Tobago (40.3%, a difference of 4.6%), and Immigrants from Ecuador (40.5%, a difference of 5.2%).
| Demographics | Rating | Rank | 2 or more Vehicles in Household |
| Ecuadorians | 0.0 /100 | #329 | Tragic 42.0% |
| Immigrants | Dominica | 0.0 /100 | #330 | Tragic 41.6% |
| West Indians | 0.0 /100 | #331 | Tragic 41.3% |
| Trinidadians and Tobagonians | 0.0 /100 | #332 | Tragic 40.9% |
| Immigrants | Ecuador | 0.0 /100 | #333 | Tragic 40.5% |
| Immigrants | Trinidad and Tobago | 0.0 /100 | #334 | Tragic 40.3% |
| Immigrants | Bangladesh | 0.0 /100 | #335 | Tragic 38.8% |
| Vietnamese | 0.0 /100 | #336 | Tragic 38.5% |
| Barbadians | 0.0 /100 | #337 | Tragic 38.3% |
| Immigrants | Uzbekistan | 0.0 /100 | #338 | Tragic 37.9% |
| Immigrants | Barbados | 0.0 /100 | #339 | Tragic 35.8% |
| British West Indians | 0.0 /100 | #340 | Tragic 35.4% |
| Guyanese | 0.0 /100 | #341 | Tragic 35.4% |
| Dominicans | 0.0 /100 | #342 | Tragic 35.3% |
| Immigrants | Guyana | 0.0 /100 | #343 | Tragic 35.0% |