Area Code 435 Map & Demographics
Area Code 435 Map
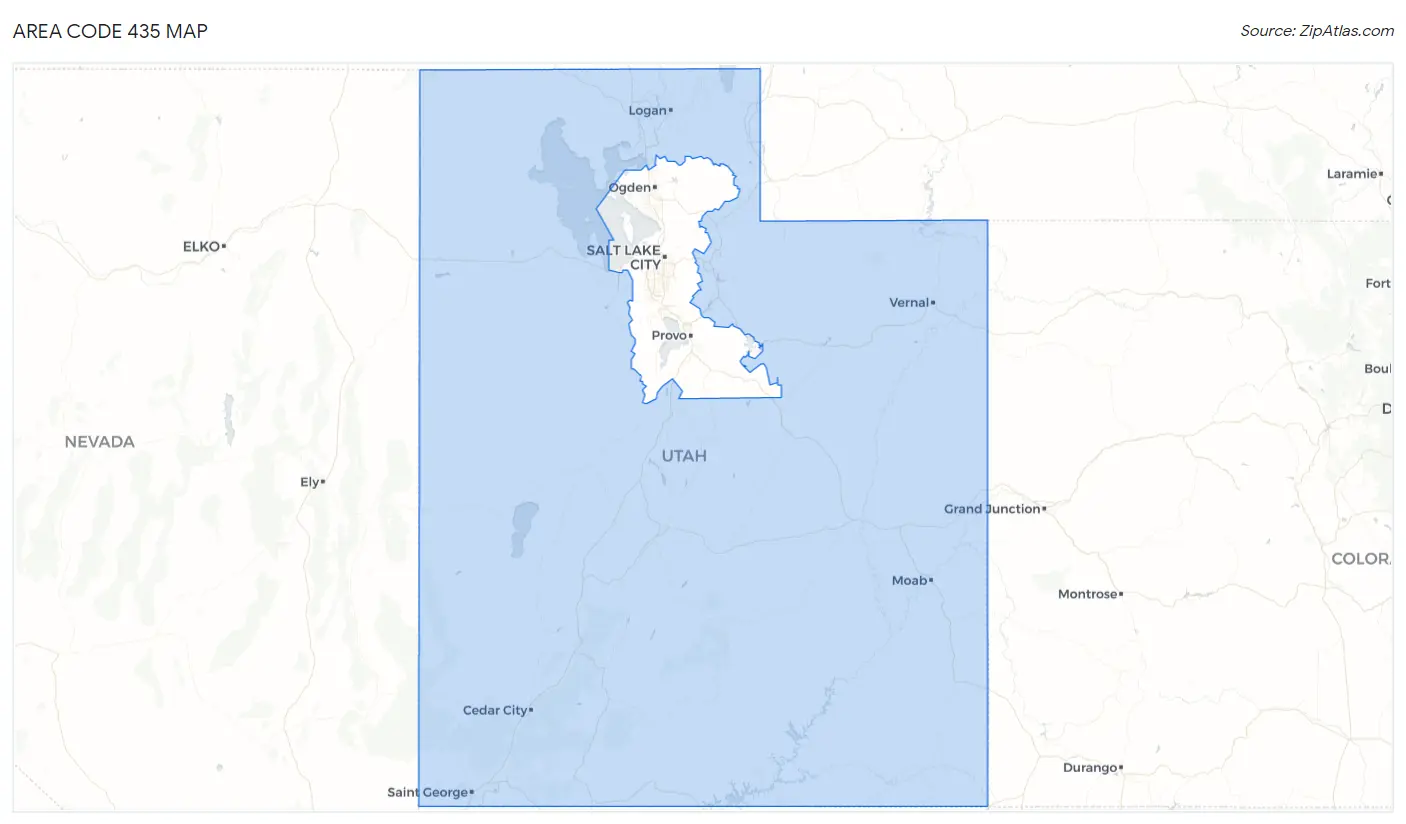
Area Code 435 Overview
$31,989
PER CAPITA INCOME
$86,021
AVG FAMILY INCOME
$72,937
AVG HOUSEHOLD INCOME
47.7%
WAGE / INCOME GAP [ % ]
52.3¢/ $1
WAGE / INCOME GAP [ $ ]
$11,415
FAMILY INCOME DEFICIT
77.12
INEQUALITY / GINI INDEX
797,397
TOTAL POPULATION
404,211
MALE POPULATION
393,186
FEMALE POPULATION
102.80
MALES / 100 FEMALES
97.27
FEMALES / 100 MALES
39.0
MEDIAN AGE
3.5
AVG FAMILY SIZE
3.0
AVG HOUSEHOLD SIZE
353,348
LABOR FORCE [ PEOPLE ]
58.9%
PERCENT IN LABOR FORCE
5.6%
UNEMPLOYMENT RATE
Income in Area Code 435
Income Overview in Area Code 435
Per Capita Income in Area Code 435 is $31,989, while median incomes of families and households are $86,021 and $72,937 respectively.
| Characteristic | Number | Measure |
| Per Capita Income | 797,397 | $31,989 |
| Median Family Income | 196,431 | $86,021 |
| Mean Family Income | 196,431 | $20,036,525 |
| Median Household Income | 261,872 | $72,937 |
| Mean Household Income | 261,872 | $17,627,333 |
| Income Deficit | 196,431 | $11,415 |
| Wage / Income Gap (%) | 797,397 | 47.74% |
| Wage / Income Gap ($) | 797,397 | 52.26¢ per $1 |
| Gini / Inequality Index | 797,397 | 77.12 |
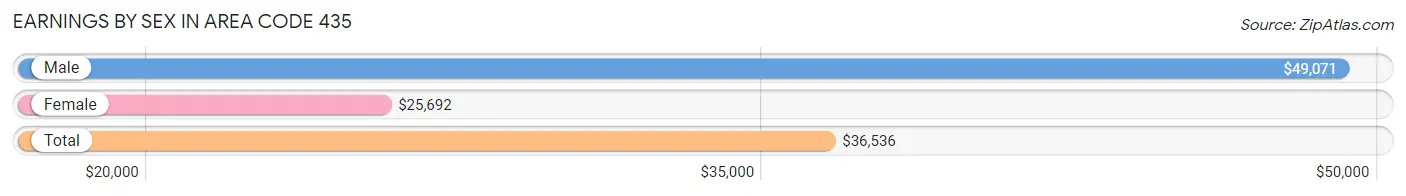
Earnings by Sex in Area Code 435
Average Earnings in Area Code 435 are $36,536, $49,071 for men and $25,692 for women, a difference of 47.6%.
| Sex | Number | Average Earnings |
| Male | 224,556 (55.2%) | $49,071 |
| Female | 182,548 (44.8%) | $25,692 |
| Total | 407,104 (100.0%) | $36,536 |
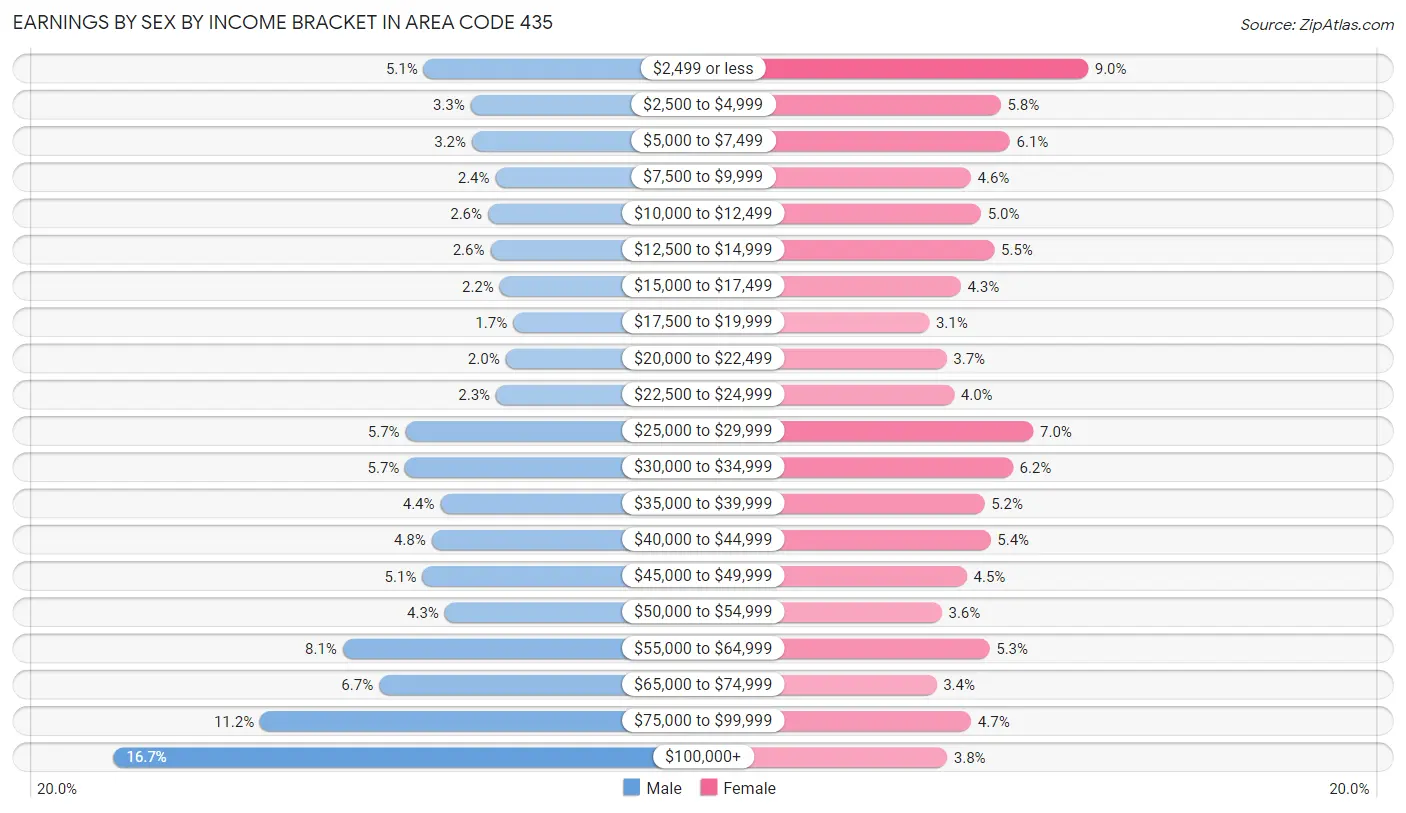
Earnings by Sex by Income Bracket in Area Code 435
The most common earnings brackets in Area Code 435 are $100,000+ for men (37,437 | 16.7%) and $2,499 or less for women (16,481 | 9.0%).
| Income | Male | Female |
| $2,499 or less | 11,337 (5.1%) | 16,481 (9.0%) |
| $2,500 to $4,999 | 7,380 (3.3%) | 10,521 (5.8%) |
| $5,000 to $7,499 | 7,268 (3.2%) | 11,132 (6.1%) |
| $7,500 to $9,999 | 5,295 (2.4%) | 8,479 (4.6%) |
| $10,000 to $12,499 | 5,935 (2.6%) | 9,158 (5.0%) |
| $12,500 to $14,999 | 5,731 (2.5%) | 10,068 (5.5%) |
| $15,000 to $17,499 | 4,935 (2.2%) | 7,778 (4.3%) |
| $17,500 to $19,999 | 3,820 (1.7%) | 5,624 (3.1%) |
| $20,000 to $22,499 | 4,445 (2.0%) | 6,811 (3.7%) |
| $22,500 to $24,999 | 5,252 (2.3%) | 7,327 (4.0%) |
| $25,000 to $29,999 | 12,856 (5.7%) | 12,749 (7.0%) |
| $30,000 to $34,999 | 12,894 (5.7%) | 11,334 (6.2%) |
| $35,000 to $39,999 | 9,936 (4.4%) | 9,399 (5.1%) |
| $40,000 to $44,999 | 10,672 (4.8%) | 9,818 (5.4%) |
| $45,000 to $49,999 | 11,463 (5.1%) | 8,204 (4.5%) |
| $50,000 to $54,999 | 9,577 (4.3%) | 6,488 (3.5%) |
| $55,000 to $64,999 | 18,136 (8.1%) | 9,747 (5.3%) |
| $65,000 to $74,999 | 15,083 (6.7%) | 6,107 (3.4%) |
| $75,000 to $99,999 | 25,104 (11.2%) | 8,481 (4.6%) |
| $100,000+ | 37,437 (16.7%) | 6,842 (3.7%) |
| Total | 224,556 (100.0%) | 182,548 (100.0%) |
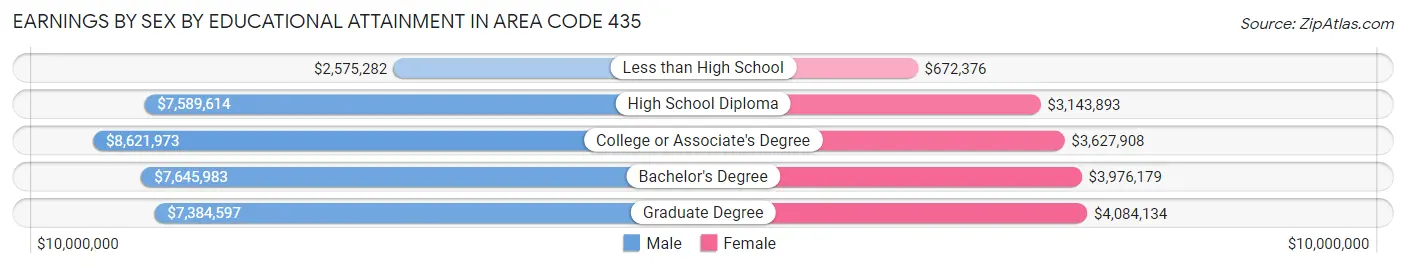
Earnings by Sex by Educational Attainment in Area Code 435
Average earnings in Area Code 435 are $9,906,682 for men and $4,758,539 for women, a difference of 52.0%. Men with an educational attainment of college or associate's degree enjoy the highest average annual earnings of $8,621,973, while those with less than high school education earn the least with $2,575,282. Women with an educational attainment of graduate degree earn the most with the average annual earnings of $4,084,134, while those with less than high school education have the smallest earnings of $672,376.
| Educational Attainment | Male Income | Female Income |
| Less than High School | $2,575,282 | $672,376 |
| High School Diploma | $7,589,614 | $3,143,893 |
| College or Associate's Degree | $8,621,973 | $3,627,908 |
| Bachelor's Degree | $7,645,983 | $3,976,179 |
| Graduate Degree | $7,384,597 | $4,084,134 |
| Total | $9,906,682 | $4,758,539 |
Family Income in Area Code 435
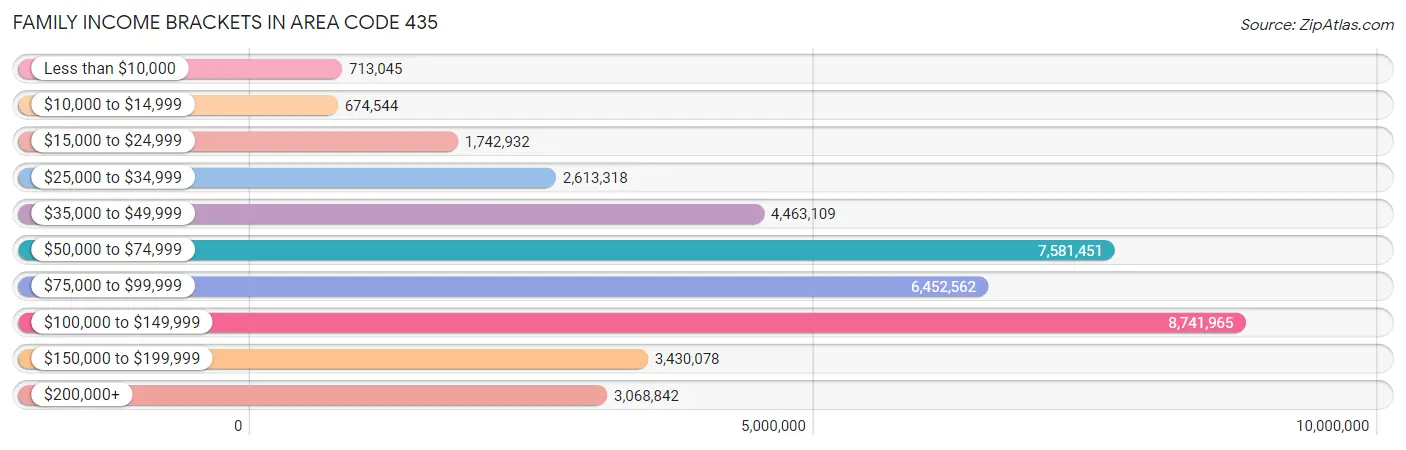
Family Income Brackets in Area Code 435
According to the Area Code 435 family income data, there are 8,741,965 families falling into the $100,000 to $149,999 income range, which is the most common income bracket and makes up 4,450.4% of all families. Conversely, the $10,000 to $14,999 income bracket is the least frequent group with only 674,544 families (343.4%) belonging to this category.
| Income Bracket | # Families | % Families |
| Less than $10,000 | 713,045 | 363.0% |
| $10,000 to $14,999 | 674,544 | 343.4% |
| $15,000 to $24,999 | 1,742,932 | 887.3% |
| $25,000 to $34,999 | 2,613,318 | 1,330.4% |
| $35,000 to $49,999 | 4,463,109 | 2,272.1% |
| $50,000 to $74,999 | 7,581,451 | 3,859.6% |
| $75,000 to $99,999 | 6,452,562 | 3,284.9% |
| $100,000 to $149,999 | 8,741,965 | 4,450.4% |
| $150,000 to $199,999 | 3,430,078 | 1,746.2% |
| $200,000+ | 3,068,842 | 1,562.3% |
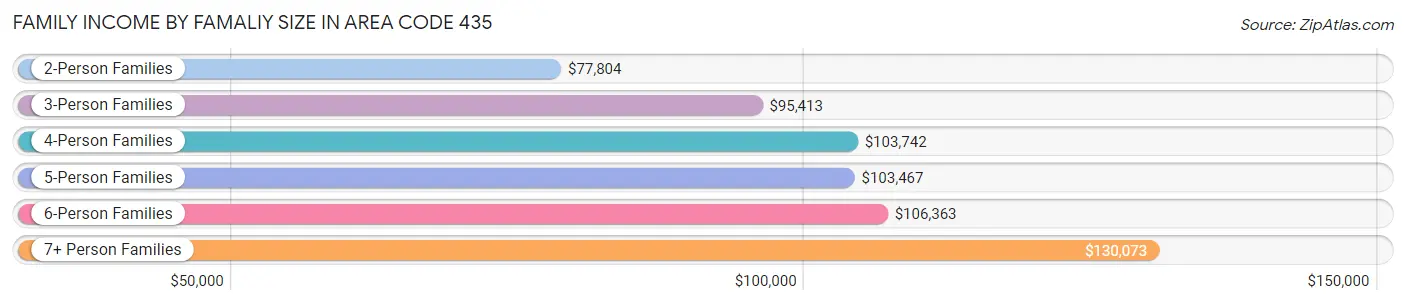
Family Income by Famaliy Size in Area Code 435
7+ person families (9,008 | 4.6%) account for the highest median family income in Area Code 435 with $130,073 per family, while 2-person families (86,493 | 44.0%) have the highest median income of $38,902 per family member.
| Income Bracket | # Families | Median Income |
| 2-Person Families | 86,493 (44.0%) | $77,804 |
| 3-Person Families | 34,710 (17.7%) | $95,413 |
| 4-Person Families | 32,660 (16.6%) | $103,742 |
| 5-Person Families | 21,137 (10.8%) | $103,467 |
| 6-Person Families | 12,423 (6.3%) | $106,363 |
| 7+ Person Families | 9,008 (4.6%) | $130,073 |
| Total | 196,431 (100.0%) | $86,021 |
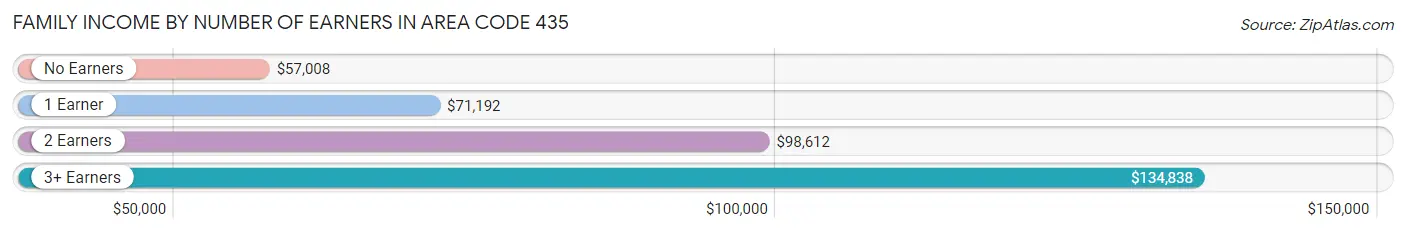
Family Income by Number of Earners in Area Code 435
The median family income in Area Code 435 is $86,021, with families comprising 3+ earners (28,945) having the highest median family income of $134,838, while families with no earners (30,465) have the lowest median family income of $57,008, accounting for 14.7% and 15.5% of families, respectively.
| Number of Earners | # Families | Median Income |
| No Earners | 30,465 (15.5%) | $57,008 |
| 1 Earner | 55,223 (28.1%) | $71,192 |
| 2 Earners | 81,798 (41.6%) | $98,612 |
| 3+ Earners | 28,945 (14.7%) | $134,838 |
| Total | 196,431 (100.0%) | $86,021 |
Household Income in Area Code 435
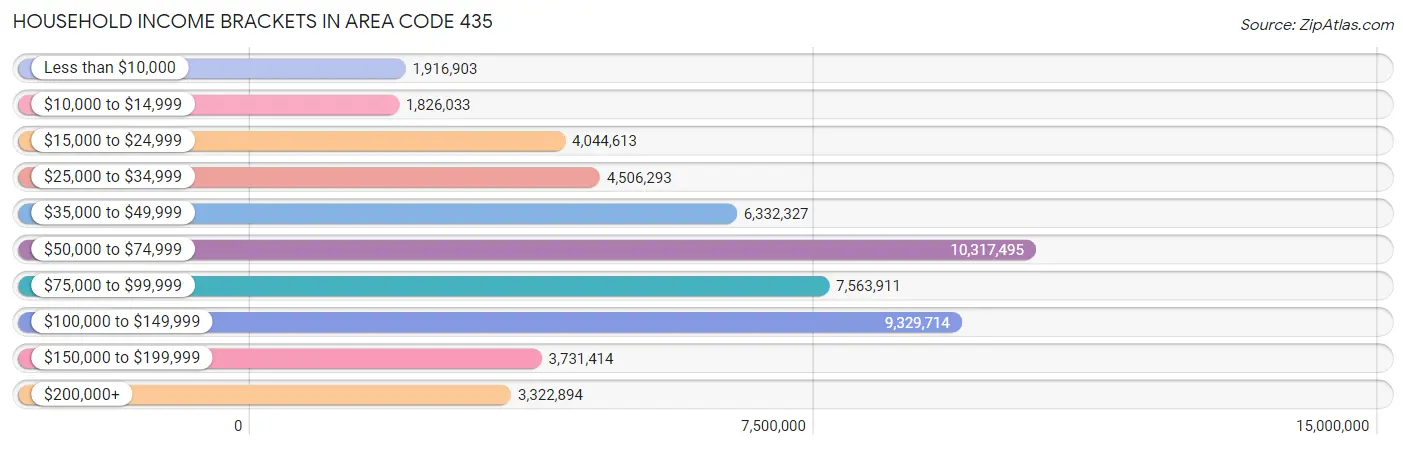
Household Income Brackets in Area Code 435
With 10,317,495 households falling in the category, the $50,000 to $74,999 income range is the most frequent in Area Code 435, accounting for 3,939.9% of all households. In contrast, only 1,826,033 households (697.3%) fall into the $10,000 to $14,999 income bracket, making it the least populous group.
| Income Bracket | # Households | % Households |
| Less than $10,000 | 1,916,903 | 732.0% |
| $10,000 to $14,999 | 1,826,033 | 697.3% |
| $15,000 to $24,999 | 4,044,613 | 1,544.5% |
| $25,000 to $34,999 | 4,506,293 | 1,720.8% |
| $35,000 to $49,999 | 6,332,327 | 2,418.1% |
| $50,000 to $74,999 | 10,317,495 | 3,939.9% |
| $75,000 to $99,999 | 7,563,911 | 2,888.4% |
| $100,000 to $149,999 | 9,329,714 | 3,562.7% |
| $150,000 to $199,999 | 3,731,414 | 1,424.9% |
| $200,000+ | 3,322,894 | 1,268.9% |
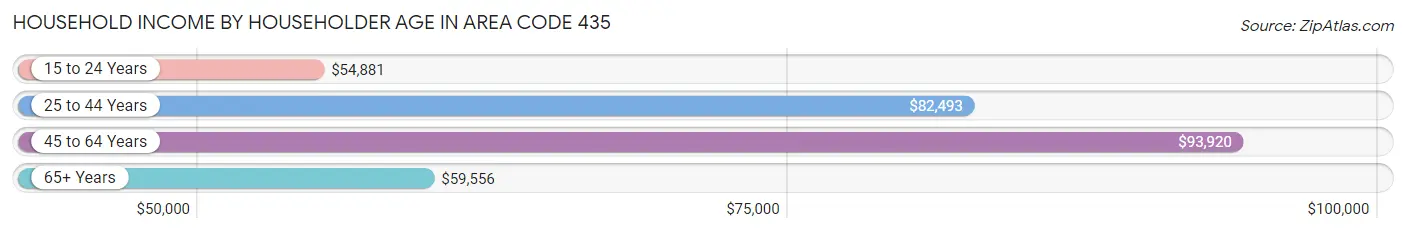
Household Income by Householder Age in Area Code 435
The median household income in Area Code 435 is $72,937, with the highest median household income of $93,920 found in the 45 to 64 years age bracket for the primary householder. A total of 86,723 households (33.1%) fall into this category. Meanwhile, the 15 to 24 years age bracket for the primary householder has the lowest median household income of $54,881, with 16,868 households (6.4%) in this group.
| Income Bracket | # Households | Median Income |
| 15 to 24 Years | 16,868 (6.4%) | $54,881 |
| 25 to 44 Years | 88,346 (33.7%) | $82,493 |
| 45 to 64 Years | 86,723 (33.1%) | $93,920 |
| 65+ Years | 69,935 (26.7%) | $59,556 |
| Total | 261,872 (100.0%) | $72,937 |
Poverty in Area Code 435
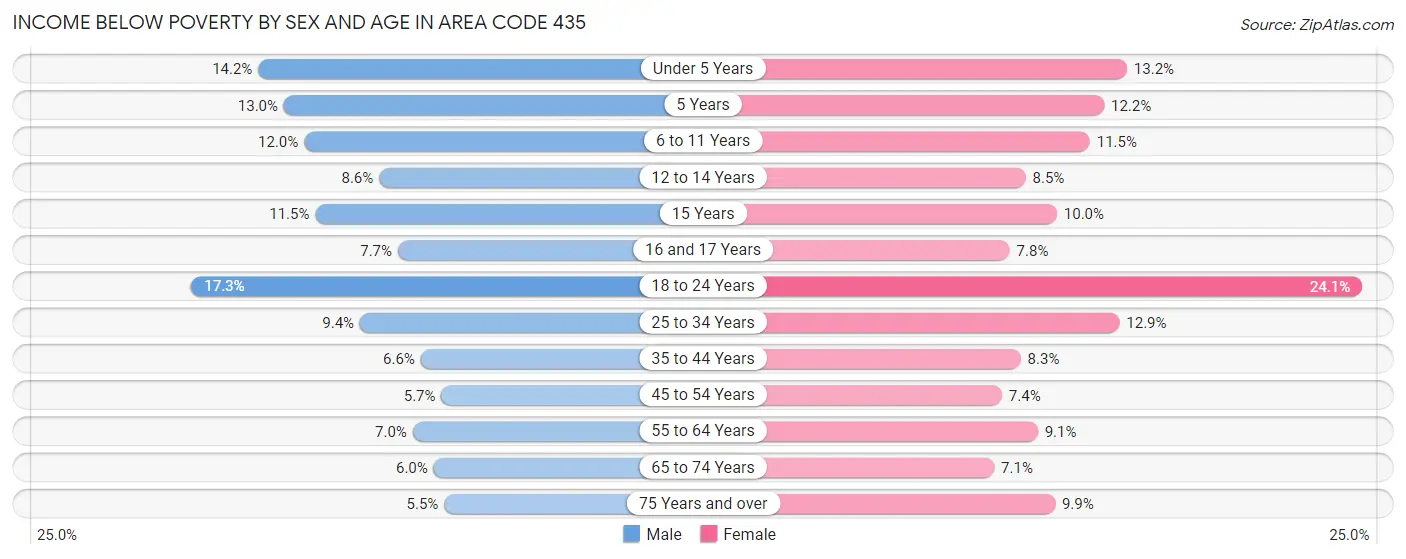
Income Below Poverty by Sex and Age in Area Code 435
With 9.4% poverty level for males and 11.3% for females among the residents of Area Code 435, 18 to 24 year old males and 18 to 24 year old females are the most vulnerable to poverty, with 7,561 males (17.3%) and 10,334 females (24.1%) in their respective age groups living below the poverty level.
| Age Bracket | Male | Female |
| Under 5 Years | 3,942 (14.2%) | 3,448 (13.2%) |
| 5 Years | 790 (13.0%) | 761 (12.2%) |
| 6 to 11 Years | 4,764 (12.0%) | 4,165 (11.5%) |
| 12 to 14 Years | 1,733 (8.6%) | 1,613 (8.5%) |
| 15 Years | 806 (11.5%) | 669 (10.0%) |
| 16 and 17 Years | 1,027 (7.7%) | 991 (7.8%) |
| 18 to 24 Years | 7,561 (17.3%) | 10,334 (24.1%) |
| 25 to 34 Years | 4,667 (9.4%) | 6,152 (12.9%) |
| 35 to 44 Years | 3,322 (6.6%) | 4,137 (8.3%) |
| 45 to 54 Years | 2,344 (5.7%) | 2,936 (7.4%) |
| 55 to 64 Years | 2,796 (7.0%) | 3,753 (9.1%) |
| 65 to 74 Years | 2,081 (6.0%) | 2,499 (7.1%) |
| 75 Years and over | 1,230 (5.5%) | 2,403 (9.9%) |
| Total | 37,063 (9.4%) | 43,861 (11.3%) |
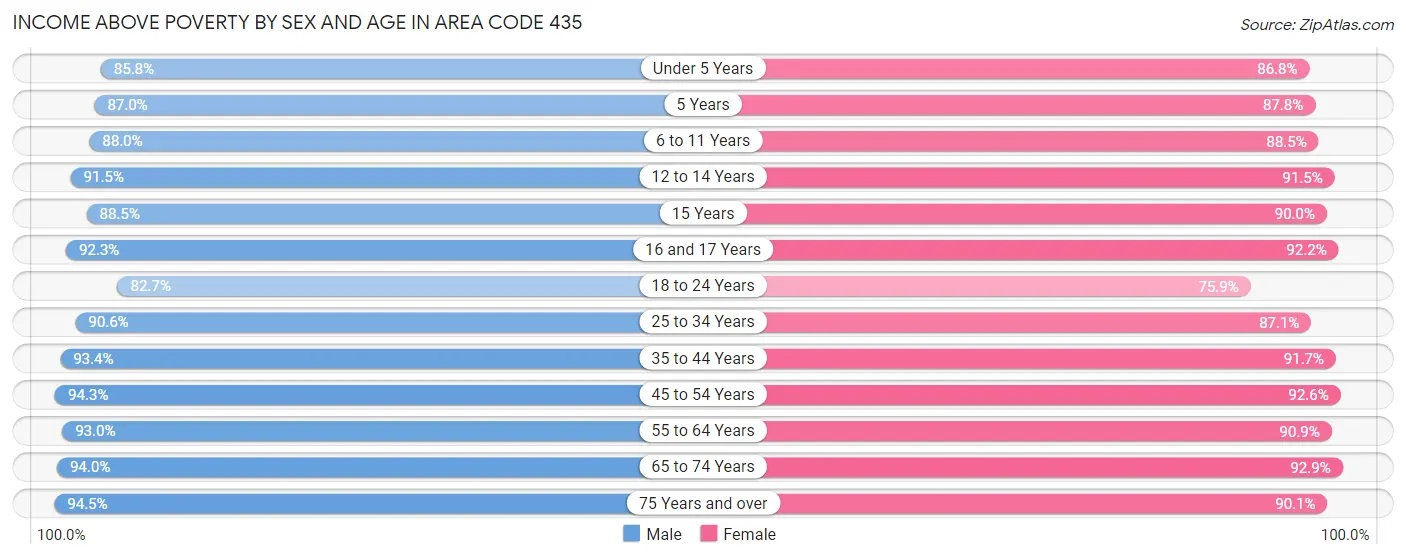
Income Above Poverty by Sex and Age in Area Code 435
According to the poverty statistics in Area Code 435, males aged 75 years and over and females aged 65 to 74 years are the age groups that are most secure financially, with 94.5% of males and 92.9% of females in these age groups living above the poverty line.
| Age Bracket | Male | Female |
| Under 5 Years | 23,892 (85.8%) | 22,608 (86.8%) |
| 5 Years | 5,302 (87.0%) | 5,490 (87.8%) |
| 6 to 11 Years | 34,844 (88.0%) | 32,034 (88.5%) |
| 12 to 14 Years | 18,545 (91.4%) | 17,298 (91.5%) |
| 15 Years | 6,197 (88.5%) | 6,034 (90.0%) |
| 16 and 17 Years | 12,349 (92.3%) | 11,730 (92.2%) |
| 18 to 24 Years | 36,241 (82.7%) | 32,481 (75.9%) |
| 25 to 34 Years | 44,758 (90.6%) | 41,611 (87.1%) |
| 35 to 44 Years | 46,865 (93.4%) | 45,694 (91.7%) |
| 45 to 54 Years | 39,081 (94.3%) | 36,604 (92.6%) |
| 55 to 64 Years | 37,206 (93.0%) | 37,542 (90.9%) |
| 65 to 74 Years | 32,461 (94.0%) | 32,839 (92.9%) |
| 75 Years and over | 21,013 (94.5%) | 21,900 (90.1%) |
| Total | 358,754 (90.6%) | 343,865 (88.7%) |
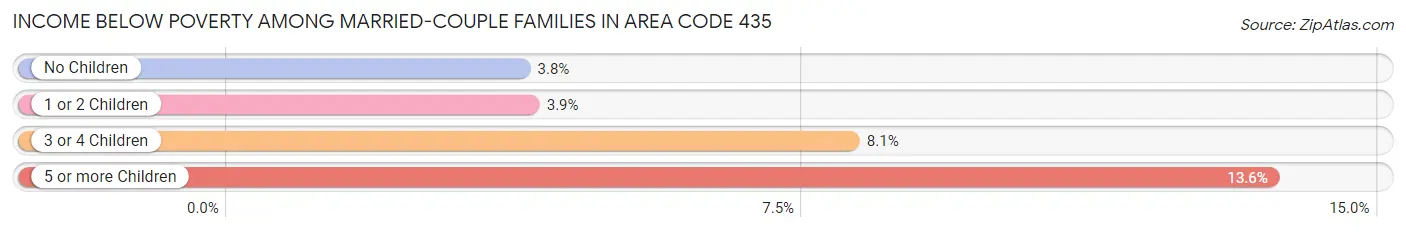
Income Below Poverty Among Married-Couple Families in Area Code 435
The poverty statistics for married-couple families in Area Code 435 show that 4.8% or 7,980 of the total 165,851 families live below the poverty line. Families with 5 or more children have the highest poverty rate of 13.6%, comprising of 702 families. On the other hand, families with no children have the lowest poverty rate of 3.8%, which includes 3,334 families.
| Children | Above Poverty | Below Poverty |
| No Children | 83,902 (96.2%) | 3,334 (3.8%) |
| 1 or 2 Children | 46,389 (96.1%) | 1,901 (3.9%) |
| 3 or 4 Children | 23,121 (91.9%) | 2,043 (8.1%) |
| 5 or more Children | 4,459 (86.4%) | 702 (13.6%) |
| Total | 157,871 (95.2%) | 7,980 (4.8%) |
Income Below Poverty Among Single-Parent Households in Area Code 435
According to the poverty data in Area Code 435, 9.6% or 1,021 single-father households and 21.6% or 4,313 single-mother households are living below the poverty line. Among single-father households, those with 3 or 4 children have the highest poverty rate, with 182 households (20.7%) experiencing poverty. Likewise, among single-mother households, those with 5 or more children have the highest poverty rate, with 278 households (67.6%) falling below the poverty line.
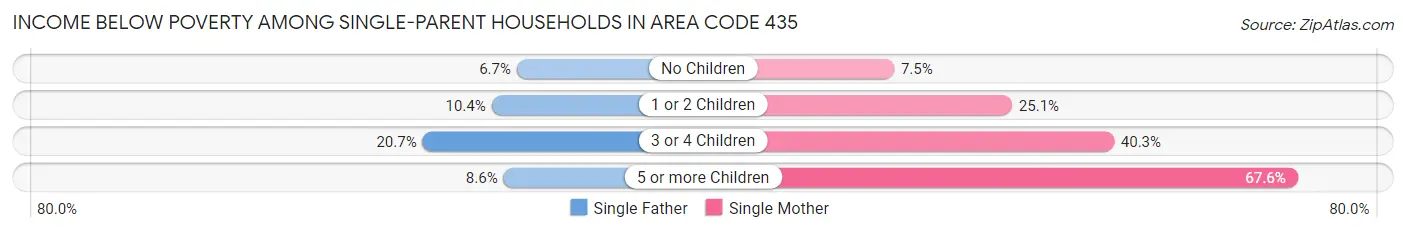
| Children | Single Father | Single Mother |
| No Children | 313 (6.7%) | 530 (7.5%) |
| 1 or 2 Children | 512 (10.4%) | 2,478 (25.1%) |
| 3 or 4 Children | 182 (20.7%) | 1,027 (40.3%) |
| 5 or more Children | 14 (8.6%) | 278 (67.6%) |
| Total | 1,021 (9.6%) | 4,313 (21.6%) |
Income Below Poverty Among Married-Couple vs Single-Parent Households in Area Code 435
The poverty data for Area Code 435 shows that 7,980 of the married-couple family households (4.8%) and 5,334 of the single-parent households (17.4%) are living below the poverty level. Within the married-couple family households, those with 5 or more children have the highest poverty rate, with 702 households (13.6%) falling below the poverty line. Among the single-parent households, those with 5 or more children have the highest poverty rate, with 292 household (51.0%) living below poverty.
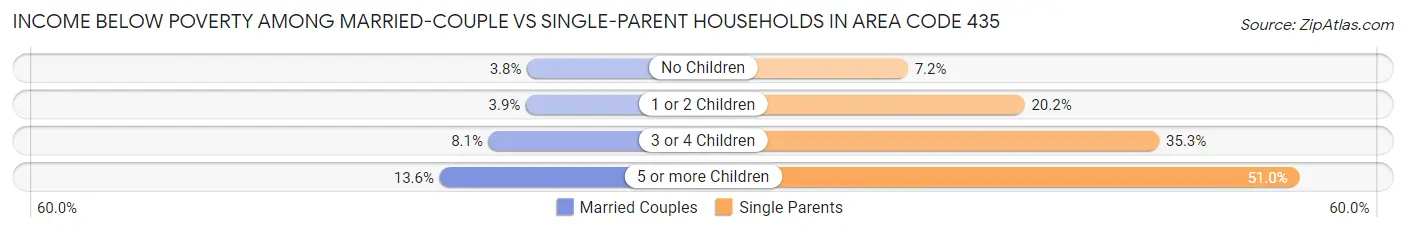
| Children | Married-Couple Families | Single-Parent Households |
| No Children | 3,334 (3.8%) | 843 (7.2%) |
| 1 or 2 Children | 1,901 (3.9%) | 2,990 (20.2%) |
| 3 or 4 Children | 2,043 (8.1%) | 1,209 (35.2%) |
| 5 or more Children | 702 (13.6%) | 292 (51.0%) |
| Total | 7,980 (4.8%) | 5,334 (17.4%) |
Race in Area Code 435
The most populous races in Area Code 435 are White / Caucasian (697,577 | 87.5%), Hispanic or Latino (84,674 | 10.6%), and Two or more Races (42,860 | 5.4%).
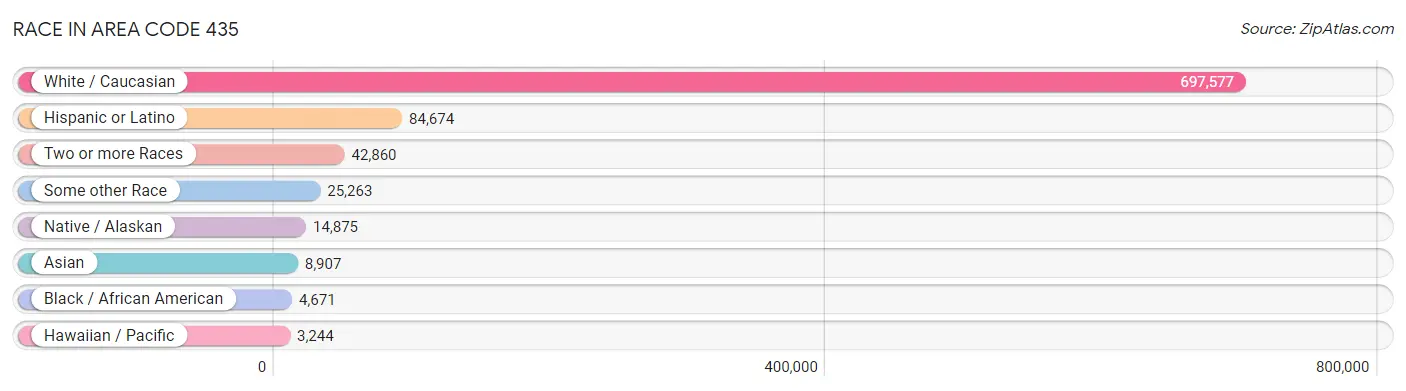
| Race | # Population | % Population |
| Asian | 8,907 | 1.1% |
| Black / African American | 4,671 | 0.6% |
| Hawaiian / Pacific | 3,244 | 0.4% |
| Hispanic or Latino | 84,674 | 10.6% |
| Native / Alaskan | 14,875 | 1.9% |
| White / Caucasian | 697,577 | 87.5% |
| Two or more Races | 42,860 | 5.4% |
| Some other Race | 25,263 | 3.2% |
| Total | 797,397 | 100.0% |
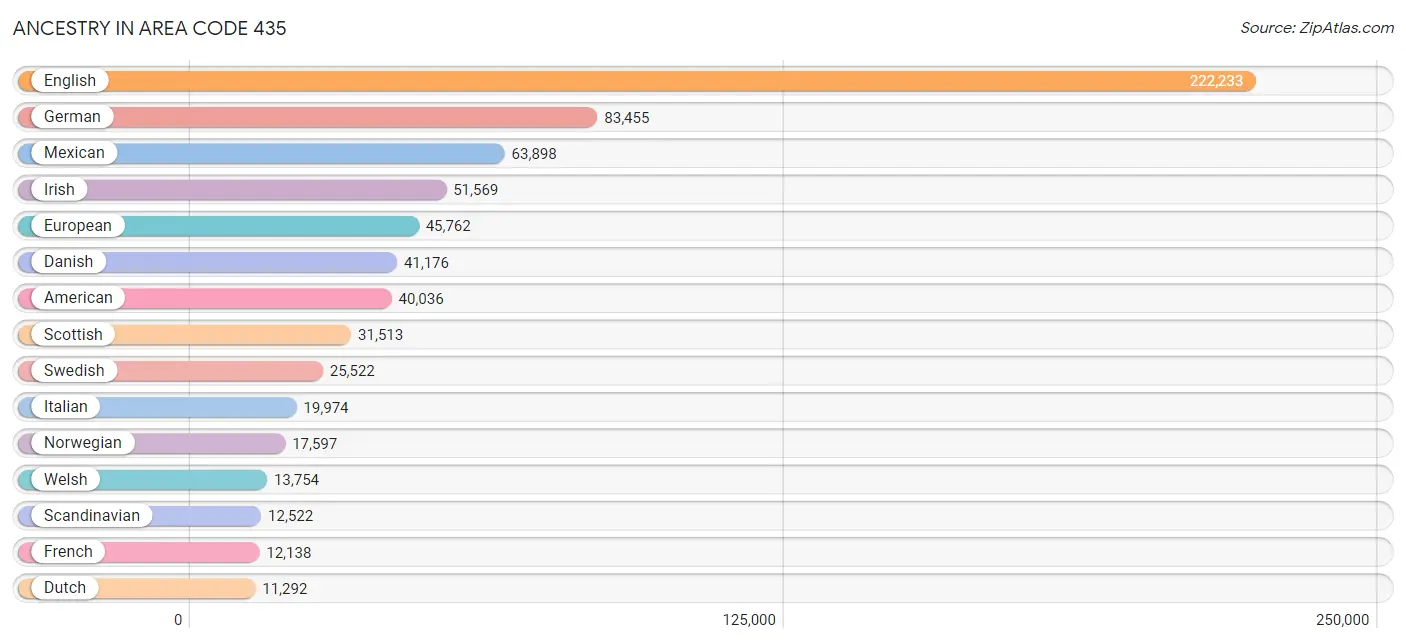
Ancestry in Area Code 435
The most populous ancestries reported in Area Code 435 are English (222,233 | 27.9%), German (83,455 | 10.5%), Mexican (63,898 | 8.0%), Irish (51,569 | 6.5%), and European (45,762 | 5.7%), together accounting for 58.6% of all Area Code 435 residents.
| Ancestry | # Population | % Population |
| Afghan | 63 | 0.0% |
| African | 851 | 0.1% |
| Alaska Native | 162 | 0.0% |
| Alaskan Athabascan | 34 | 0.0% |
| Albanian | 38 | 0.0% |
| Aleut | 27 | 0.0% |
| Alsatian | 2 | 0.0% |
| American | 40,036 | 5.0% |
| Apache | 337 | 0.0% |
| Arab | 1,236 | 0.2% |
| Arapaho | 22 | 0.0% |
| Argentinean | 845 | 0.1% |
| Armenian | 222 | 0.0% |
| Australian | 448 | 0.1% |
| Austrian | 1,224 | 0.2% |
| Bahamian | 34 | 0.0% |
| Bangladeshi | 45 | 0.0% |
| Barbadian | 17 | 0.0% |
| Basque | 427 | 0.1% |
| Belgian | 341 | 0.0% |
| Bhutanese | 2,686 | 0.3% |
| Blackfeet | 519 | 0.1% |
| Bolivian | 62 | 0.0% |
| Brazilian | 1,308 | 0.2% |
| British | 9,980 | 1.3% |
| Bulgarian | 31 | 0.0% |
| Burmese | 1,070 | 0.1% |
| Cajun | 13 | 0.0% |
| Cambodian | 18 | 0.0% |
| Canadian | 2,468 | 0.3% |
| Celtic | 13 | 0.0% |
| Central American | 4,732 | 0.6% |
| Central American Indian | 224 | 0.0% |
| Cherokee | 1,922 | 0.2% |
| Cheyenne | 60 | 0.0% |
| Chickasaw | 175 | 0.0% |
| Chilean | 390 | 0.1% |
| Chippewa | 55 | 0.0% |
| Choctaw | 217 | 0.0% |
| Colombian | 885 | 0.1% |
| Comanche | 68 | 0.0% |
| Costa Rican | 130 | 0.0% |
| Cree | 25 | 0.0% |
| Creek | 111 | 0.0% |
| Croatian | 357 | 0.0% |
| Crow | 122 | 0.0% |
| Cuban | 410 | 0.1% |
| Czech | 1,052 | 0.1% |
| Czechoslovakian | 262 | 0.0% |
| Danish | 41,176 | 5.2% |
| Delaware | 68 | 0.0% |
| Dominican | 219 | 0.0% |
| Dutch | 11,292 | 1.4% |
| Dutch West Indian | 62 | 0.0% |
| Eastern European | 1,079 | 0.1% |
| Ecuadorian | 183 | 0.0% |
| Egyptian | 175 | 0.0% |
| English | 222,233 | 27.9% |
| Estonian | 71 | 0.0% |
| Ethiopian | 175 | 0.0% |
| European | 45,762 | 5.7% |
| Fijian | 125 | 0.0% |
| Filipino | 97 | 0.0% |
| Finnish | 1,560 | 0.2% |
| French | 12,138 | 1.5% |
| French American Indian | 22 | 0.0% |
| French Canadian | 1,873 | 0.2% |
| German | 83,455 | 10.5% |
| German Russian | 18 | 0.0% |
| Ghanaian | 84 | 0.0% |
| Greek | 2,272 | 0.3% |
| Guamanian / Chamorro | 202 | 0.0% |
| Guatemalan | 1,686 | 0.2% |
| Haitian | 153 | 0.0% |
| Honduran | 222 | 0.0% |
| Hopi | 239 | 0.0% |
| Hungarian | 1,250 | 0.2% |
| Icelander | 974 | 0.1% |
| Indian (Asian) | 2,828 | 0.4% |
| Indonesian | 158 | 0.0% |
| Inupiat | 16 | 0.0% |
| Iranian | 203 | 0.0% |
| Irish | 51,569 | 6.5% |
| Iroquois | 63 | 0.0% |
| Israeli | 143 | 0.0% |
| Italian | 19,974 | 2.5% |
| Jamaican | 143 | 0.0% |
| Japanese | 670 | 0.1% |
| Jordanian | 1 | 0.0% |
| Kenyan | 12 | 0.0% |
| Korean | 3,502 | 0.4% |
| Laotian | 56 | 0.0% |
| Latvian | 20 | 0.0% |
| Lebanese | 359 | 0.1% |
| Lithuanian | 416 | 0.1% |
| Lumbee | 36 | 0.0% |
| Luxembourger | 28 | 0.0% |
| Malaysian | 52 | 0.0% |
| Maltese | 11 | 0.0% |
| Menominee | 22 | 0.0% |
| Mexican | 63,898 | 8.0% |
| Mexican American Indian | 790 | 0.1% |
| Mongolian | 57 | 0.0% |
| Moroccan | 148 | 0.0% |
| Native Hawaiian | 1,964 | 0.3% |
| Navajo | 9,762 | 1.2% |
| New Zealander | 58 | 0.0% |
| Nicaraguan | 60 | 0.0% |
| Nigerian | 316 | 0.0% |
| Northern European | 2,439 | 0.3% |
| Norwegian | 17,597 | 2.2% |
| Osage | 21 | 0.0% |
| Ottawa | 26 | 0.0% |
| Paiute | 603 | 0.1% |
| Pakistani | 572 | 0.1% |
| Palestinian | 47 | 0.0% |
| Panamanian | 26 | 0.0% |
| Paraguayan | 9 | 0.0% |
| Pennsylvania German | 164 | 0.0% |
| Peruvian | 906 | 0.1% |
| Pima | 35 | 0.0% |
| Polish | 5,637 | 0.7% |
| Portuguese | 1,268 | 0.2% |
| Potawatomi | 15 | 0.0% |
| Pueblo | 44 | 0.0% |
| Puerto Rican | 2,319 | 0.3% |
| Puget Sound Salish | 21 | 0.0% |
| Romanian | 334 | 0.0% |
| Russian | 2,267 | 0.3% |
| Salvadoran | 2,608 | 0.3% |
| Samoan | 2,825 | 0.4% |
| Scandinavian | 12,522 | 1.6% |
| Scotch-Irish | 6,309 | 0.8% |
| Scottish | 31,513 | 4.0% |
| Seminole | 8 | 0.0% |
| Serbian | 280 | 0.0% |
| Shoshone | 387 | 0.1% |
| Sierra Leonean | 2 | 0.0% |
| Sioux | 434 | 0.1% |
| Slavic | 179 | 0.0% |
| Slovak | 394 | 0.1% |
| Slovene | 191 | 0.0% |
| Somali | 170 | 0.0% |
| South African | 107 | 0.0% |
| South American | 4,238 | 0.5% |
| South American Indian | 94 | 0.0% |
| Spaniard | 3,787 | 0.5% |
| Spanish | 2,098 | 0.3% |
| Spanish American | 76 | 0.0% |
| Spanish American Indian | 116 | 0.0% |
| Sri Lankan | 1,095 | 0.1% |
| Subsaharan African | 1,972 | 0.3% |
| Sudanese | 112 | 0.0% |
| Swedish | 25,522 | 3.2% |
| Swiss | 10,737 | 1.3% |
| Syrian | 115 | 0.0% |
| Thai | 1,448 | 0.2% |
| Tlingit-Haida | 8 | 0.0% |
| Tohono O'Odham | 13 | 0.0% |
| Tongan | 1,594 | 0.2% |
| Turkish | 432 | 0.1% |
| Ukrainian | 790 | 0.1% |
| Uruguayan | 104 | 0.0% |
| Ute | 2,869 | 0.4% |
| Venezuelan | 810 | 0.1% |
| Welsh | 13,754 | 1.7% |
| Yaqui | 85 | 0.0% |
| Yugoslavian | 542 | 0.1% |
| Yuman | 26 | 0.0% |
| Yup'ik | 56 | 0.0% |
| Zimbabwean | 6 | 0.0% | View All 171 Rows |
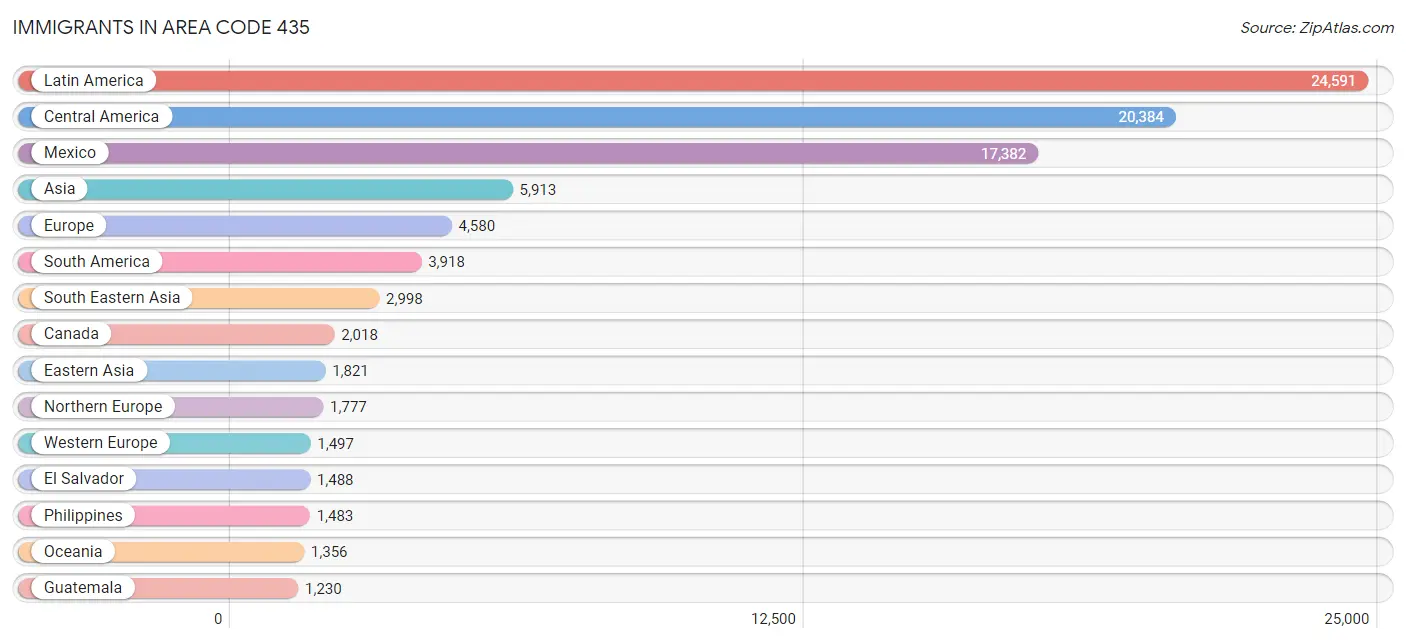
Immigrants in Area Code 435
The most numerous immigrant groups reported in Area Code 435 came from Latin America (24,591 | 3.1%), Central America (20,384 | 2.6%), Mexico (17,382 | 2.2%), Asia (5,913 | 0.7%), and Europe (4,580 | 0.6%), together accounting for 9.1% of all Area Code 435 residents.
| Immigration Origin | # Population | % Population |
| Afghanistan | 52 | 0.0% |
| Africa | 1,006 | 0.1% |
| Argentina | 363 | 0.1% |
| Armenia | 6 | 0.0% |
| Asia | 5,913 | 0.7% |
| Australia | 280 | 0.0% |
| Austria | 44 | 0.0% |
| Azores | 6 | 0.0% |
| Bahamas | 10 | 0.0% |
| Bangladesh | 19 | 0.0% |
| Belarus | 11 | 0.0% |
| Belgium | 23 | 0.0% |
| Bolivia | 27 | 0.0% |
| Bosnia and Herzegovina | 145 | 0.0% |
| Brazil | 988 | 0.1% |
| Bulgaria | 19 | 0.0% |
| Cambodia | 216 | 0.0% |
| Cameroon | 1 | 0.0% |
| Canada | 2,018 | 0.3% |
| Caribbean | 289 | 0.0% |
| Central America | 20,384 | 2.6% |
| Chile | 216 | 0.0% |
| China | 1,125 | 0.1% |
| Colombia | 710 | 0.1% |
| Congo | 28 | 0.0% |
| Costa Rica | 71 | 0.0% |
| Cuba | 10 | 0.0% |
| Czechoslovakia | 70 | 0.0% |
| Denmark | 252 | 0.0% |
| Dominican Republic | 89 | 0.0% |
| Eastern Africa | 335 | 0.0% |
| Eastern Asia | 1,821 | 0.2% |
| Eastern Europe | 1,084 | 0.1% |
| Ecuador | 103 | 0.0% |
| El Salvador | 1,488 | 0.2% |
| England | 709 | 0.1% |
| Eritrea | 1 | 0.0% |
| Ethiopia | 115 | 0.0% |
| Europe | 4,580 | 0.6% |
| Fiji | 104 | 0.0% |
| France | 273 | 0.0% |
| Germany | 844 | 0.1% |
| Ghana | 170 | 0.0% |
| Guatemala | 1,230 | 0.2% |
| Haiti | 53 | 0.0% |
| Honduras | 181 | 0.0% |
| Hong Kong | 167 | 0.0% |
| Hungary | 42 | 0.0% |
| India | 423 | 0.1% |
| Indonesia | 41 | 0.0% |
| Iran | 100 | 0.0% |
| Iraq | 18 | 0.0% |
| Ireland | 82 | 0.0% |
| Israel | 14 | 0.0% |
| Italy | 77 | 0.0% |
| Jamaica | 116 | 0.0% |
| Japan | 204 | 0.0% |
| Jordan | 4 | 0.0% |
| Kazakhstan | 20 | 0.0% |
| Kenya | 24 | 0.0% |
| Korea | 350 | 0.0% |
| Kuwait | 38 | 0.0% |
| Laos | 40 | 0.0% |
| Latin America | 24,591 | 3.1% |
| Liberia | 42 | 0.0% |
| Malaysia | 51 | 0.0% |
| Mexico | 17,382 | 2.2% |
| Micronesia | 65 | 0.0% |
| Middle Africa | 64 | 0.0% |
| Moldova | 11 | 0.0% |
| Morocco | 39 | 0.0% |
| Nepal | 66 | 0.0% |
| Netherlands | 239 | 0.0% |
| Nicaragua | 15 | 0.0% |
| Nigeria | 123 | 0.0% |
| Northern Africa | 78 | 0.0% |
| Northern Europe | 1,777 | 0.2% |
| Norway | 60 | 0.0% |
| Oceania | 1,356 | 0.2% |
| Pakistan | 8 | 0.0% |
| Panama | 17 | 0.0% |
| Peru | 602 | 0.1% |
| Philippines | 1,483 | 0.2% |
| Poland | 79 | 0.0% |
| Portugal | 14 | 0.0% |
| Romania | 83 | 0.0% |
| Russia | 362 | 0.1% |
| Saudi Arabia | 14 | 0.0% |
| Scotland | 117 | 0.0% |
| Sierra Leone | 2 | 0.0% |
| Somalia | 138 | 0.0% |
| South Africa | 37 | 0.0% |
| South America | 3,918 | 0.5% |
| South Central Asia | 728 | 0.1% |
| South Eastern Asia | 2,998 | 0.4% |
| Southern Europe | 206 | 0.0% |
| Spain | 115 | 0.0% |
| Sri Lanka | 2 | 0.0% |
| Sudan | 39 | 0.0% |
| Sweden | 120 | 0.0% |
| Switzerland | 68 | 0.0% |
| Taiwan | 175 | 0.0% |
| Thailand | 426 | 0.1% |
| Trinidad and Tobago | 8 | 0.0% |
| Turkey | 179 | 0.0% |
| Ukraine | 232 | 0.0% |
| Uruguay | 116 | 0.0% |
| Venezuela | 777 | 0.1% |
| Vietnam | 570 | 0.1% |
| Western Africa | 462 | 0.1% |
| Western Asia | 366 | 0.1% |
| Western Europe | 1,497 | 0.2% |
| Yemen | 4 | 0.0% |
| Zaire | 29 | 0.0% |
| Zimbabwe | 8 | 0.0% | View All 115 Rows |
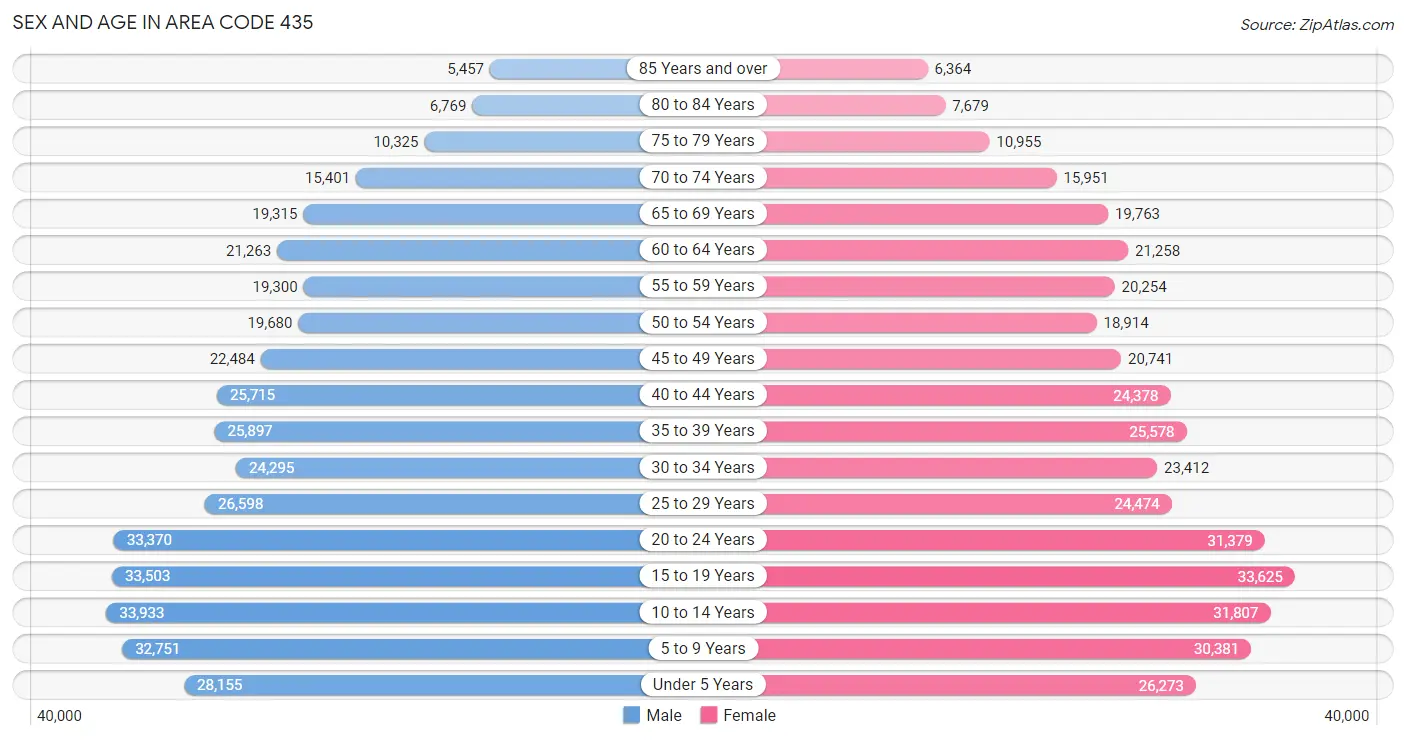
Sex and Age in Area Code 435
Sex and Age in Area Code 435
The most populous age groups in Area Code 435 are 10 to 14 Years (33,933 | 8.4%) for men and 15 to 19 Years (33,625 | 8.6%) for women.
| Age Bracket | Male | Female |
| Under 5 Years | 28,155 (7.0%) | 26,273 (6.7%) |
| 5 to 9 Years | 32,751 (8.1%) | 30,381 (7.7%) |
| 10 to 14 Years | 33,933 (8.4%) | 31,807 (8.1%) |
| 15 to 19 Years | 33,503 (8.3%) | 33,625 (8.6%) |
| 20 to 24 Years | 33,370 (8.3%) | 31,379 (8.0%) |
| 25 to 29 Years | 26,598 (6.6%) | 24,474 (6.2%) |
| 30 to 34 Years | 24,295 (6.0%) | 23,412 (5.9%) |
| 35 to 39 Years | 25,897 (6.4%) | 25,578 (6.5%) |
| 40 to 44 Years | 25,715 (6.4%) | 24,378 (6.2%) |
| 45 to 49 Years | 22,484 (5.6%) | 20,741 (5.3%) |
| 50 to 54 Years | 19,680 (4.9%) | 18,914 (4.8%) |
| 55 to 59 Years | 19,300 (4.8%) | 20,254 (5.1%) |
| 60 to 64 Years | 21,263 (5.3%) | 21,258 (5.4%) |
| 65 to 69 Years | 19,315 (4.8%) | 19,763 (5.0%) |
| 70 to 74 Years | 15,401 (3.8%) | 15,951 (4.1%) |
| 75 to 79 Years | 10,325 (2.5%) | 10,955 (2.8%) |
| 80 to 84 Years | 6,769 (1.7%) | 7,679 (1.9%) |
| 85 Years and over | 5,457 (1.3%) | 6,364 (1.6%) |
| Total | 404,211 (100.0%) | 393,186 (100.0%) |
Families and Households in Area Code 435
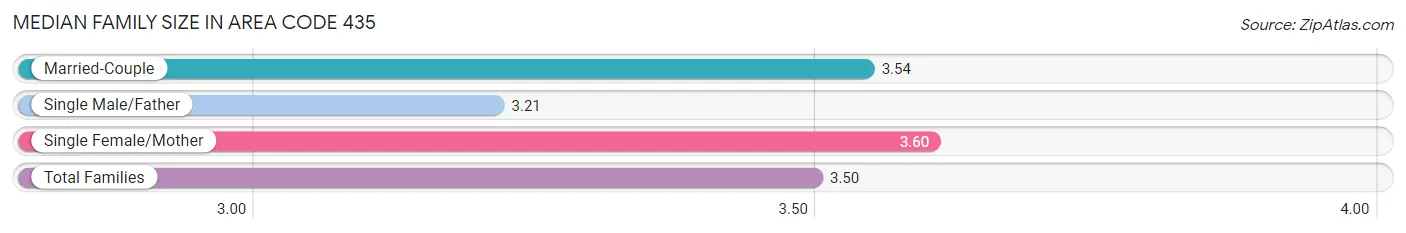
Median Family Size in Area Code 435
The median family size in Area Code 435 is 3.50 persons per family, with single female/mother families (19,922 | 10.1%) accounting for the largest median family size of 3.60236 persons per family. On the other hand, single male/father families (10,658 | 5.4%) represent the smallest median family size with 3.21 persons per family.
| Family Type | # Families | Family Size |
| Married-Couple | 165,851 (84.4%) | 3.54 |
| Single Male/Father | 10,658 (5.4%) | 3.21 |
| Single Female/Mother | 19,922 (10.1%) | 3.60 |
| Total Families | 196,431 (100.0%) | 3.50 |
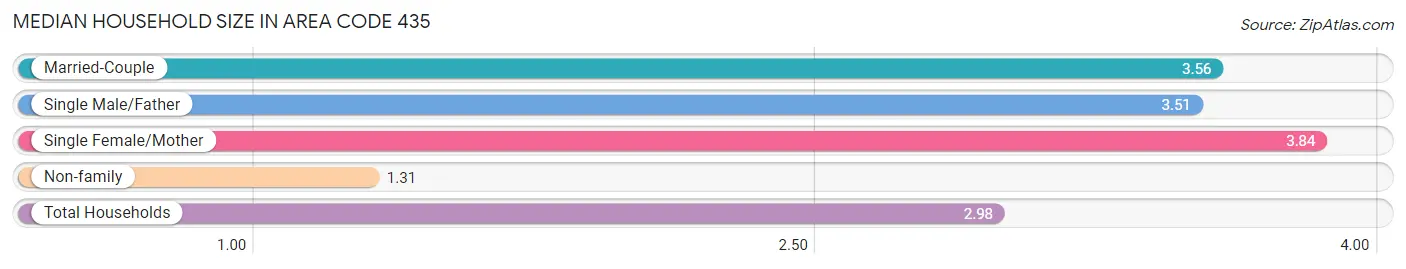
Median Household Size in Area Code 435
The median household size in Area Code 435 is 2.98 persons per household, with single female/mother households (19,922 | 7.6%) accounting for the largest median household size of 3.84068 persons per household. non-family households (65,441 | 25.0%) represent the smallest median household size with 1.31 persons per household.
| Household Type | # Households | Household Size |
| Married-Couple | 165,851 (63.3%) | 3.56 |
| Single Male/Father | 10,658 (4.1%) | 3.51 |
| Single Female/Mother | 19,922 (7.6%) | 3.84 |
| Non-family | 65,441 (25.0%) | 1.31 |
| Total Households | 261,872 (100.0%) | 2.98 |
Household Size by Marriage Status in Area Code 435
Out of a total of 261,872 households in Area Code 435, 196,431 (75.0%) are family households, while 65,441 (25.0%) are nonfamily households. The most numerous type of family households are 2-person households, comprising 82,814, and the most common type of nonfamily households are 1-person households, comprising 52,069.
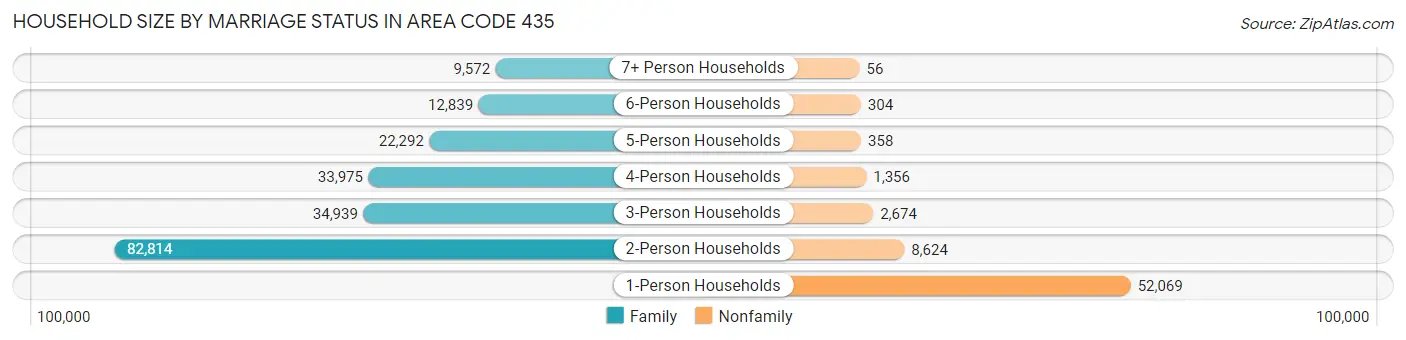
| Household Size | Family Households | Nonfamily Households |
| 1-Person Households | - | 52,069 (19.9%) |
| 2-Person Households | 82,814 (31.6%) | 8,624 (3.3%) |
| 3-Person Households | 34,939 (13.3%) | 2,674 (1.0%) |
| 4-Person Households | 33,975 (13.0%) | 1,356 (0.5%) |
| 5-Person Households | 22,292 (8.5%) | 358 (0.1%) |
| 6-Person Households | 12,839 (4.9%) | 304 (0.1%) |
| 7+ Person Households | 9,572 (3.7%) | 56 (0.0%) |
| Total | 196,431 (75.0%) | 65,441 (25.0%) |
Female Fertility in Area Code 435
Fertility by Age in Area Code 435
Average fertility rate in Area Code 435 is 84.2 births per 1,000 women. Women in the age bracket of 20 to 34 years have the highest fertility rate with 175.1 births per 1,000 women. Women in the age bracket of 20 to 34 years acount for 81.3% of all women with births.
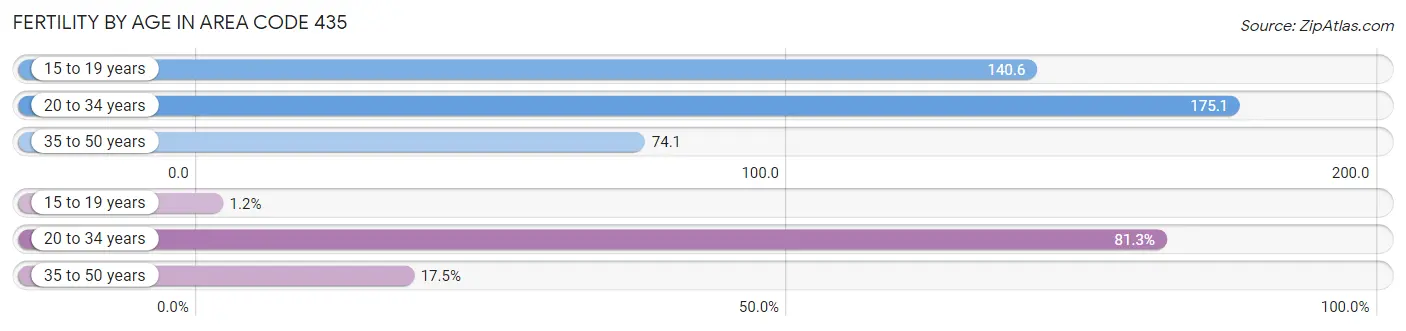
| Age Bracket | Women with Births | Births / 1,000 Women |
| 15 to 19 years | 135 (1.2%) | 140.6 |
| 20 to 34 years | 8,879 (81.3%) | 175.1 |
| 35 to 50 years | 1,905 (17.4%) | 74.1 |
| Total | 10,919 (100.0%) | 84.2 |
Fertility by Age by Marriage Status in Area Code 435
66.4% of women with births (10,919) in Area Code 435 are married. The highest percentage of unmarried women with births falls into 15 to 19 years age bracket with 92.6% of them unmarried at the time of birth, while the lowest percentage of unmarried women with births belong to 20 to 34 years age bracket with 37.0% of them unmarried.
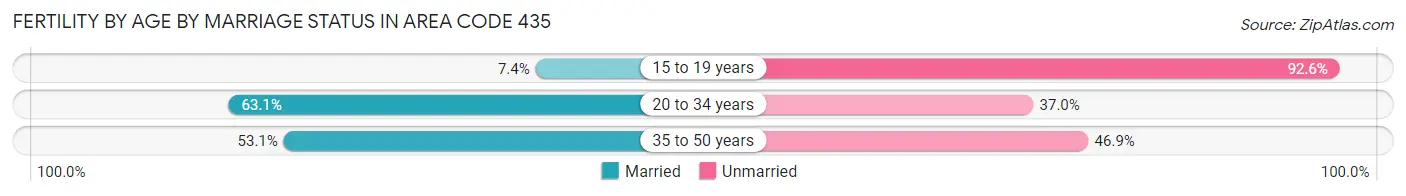
| Age Bracket | Married | Unmarried |
| 15 to 19 years | 10 (7.4%) | 125 (92.6%) |
| 20 to 34 years | 5,598 (63.0%) | 3,281 (36.9%) |
| 35 to 50 years | 1,011 (53.1%) | 894 (46.9%) |
| Total | 7,247 (66.4%) | 3,672 (33.6%) |
Fertility by Education in Area Code 435
Average fertility rate in Area Code 435 is 84.2 births per 1,000 women. Women with the education attainment of graduate degree have the highest fertility rate of 195.4 births per 1,000 women, while women with the education attainment of less than high school have the lowest fertility at 129.8 births per 1,000 women. Women with the education attainment of college or associate's degree represent 37.9% of all women with births.
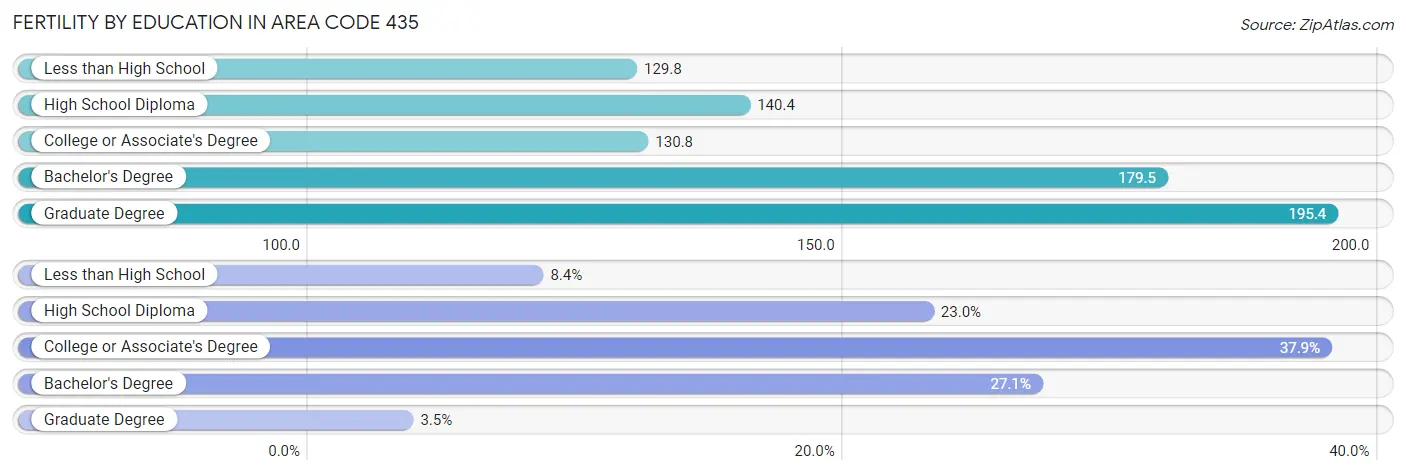
| Educational Attainment | Women with Births | Births / 1,000 Women |
| Less than High School | 917 (8.4%) | 129.8 |
| High School Diploma | 2,515 (23.0%) | 140.4 |
| College or Associate's Degree | 4,143 (37.9%) | 130.8 |
| Bachelor's Degree | 2,959 (27.1%) | 179.5 |
| Graduate Degree | 385 (3.5%) | 195.4 |
| Total | 10,919 (100.0%) | 84.2 |
Fertility by Education by Marriage Status in Area Code 435
33.6% of women with births in Area Code 435 are unmarried. Women with the educational attainment of college or associate's degree are most likely to be married with 66.2% of them married at childbirth, while women with the educational attainment of less than high school are least likely to be married with 68.8% of them unmarried at childbirth.
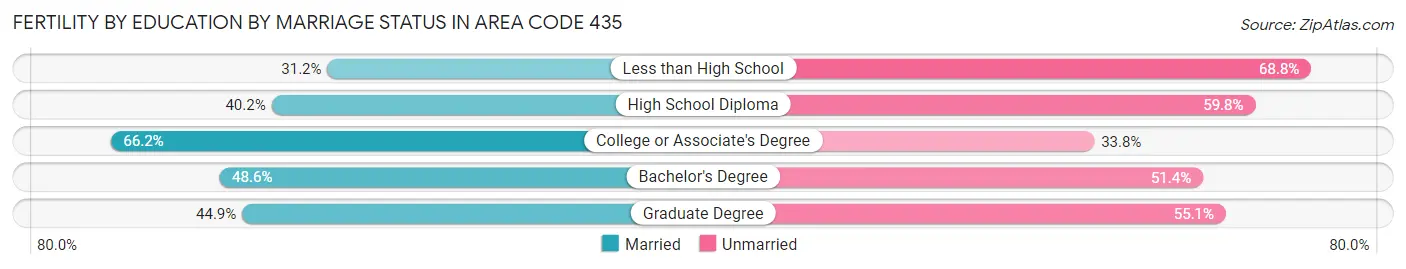
| Educational Attainment | Married | Unmarried |
| Less than High School | 286 (31.2%) | 631 (68.8%) |
| High School Diploma | 1,011 (40.2%) | 1,504 (59.8%) |
| College or Associate's Degree | 2,741 (66.2%) | 1,402 (33.8%) |
| Bachelor's Degree | 1,439 (48.6%) | 1,520 (51.4%) |
| Graduate Degree | 173 (44.9%) | 212 (55.1%) |
| Total | 7,247 (66.4%) | 3,672 (33.6%) |
Employment Characteristics in Area Code 435
Employment by Class of Employer in Area Code 435
Among the 361,537 employed individuals in Area Code 435, private company employees (239,407 | 66.2%), local government employees (28,966 | 8.0%), and state government employees (21,500 | 5.9%) make up the most common classes of employment.
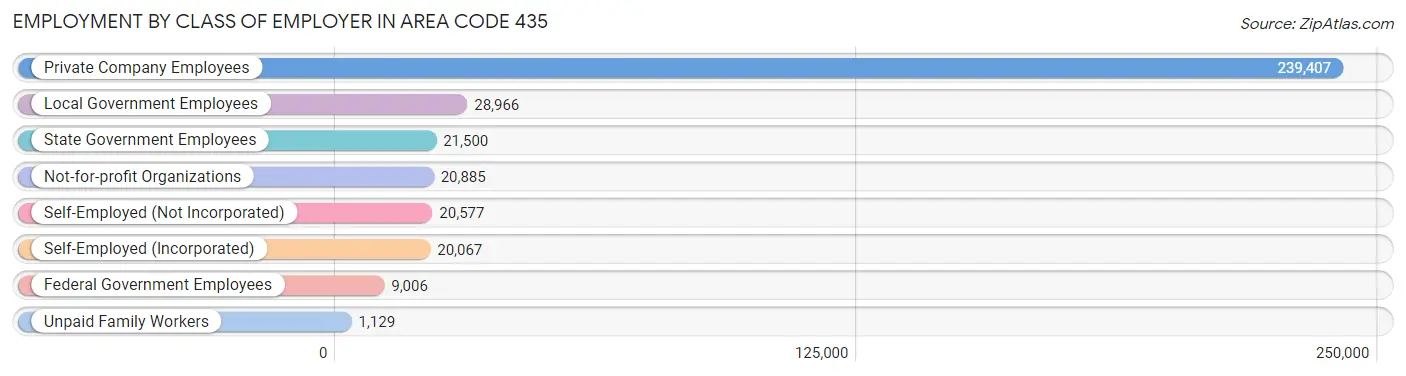
| Employer Class | # Employees | % Employees |
| Private Company Employees | 239,407 | 66.2% |
| Self-Employed (Incorporated) | 20,067 | 5.6% |
| Self-Employed (Not Incorporated) | 20,577 | 5.7% |
| Not-for-profit Organizations | 20,885 | 5.8% |
| Local Government Employees | 28,966 | 8.0% |
| State Government Employees | 21,500 | 5.9% |
| Federal Government Employees | 9,006 | 2.5% |
| Unpaid Family Workers | 1,129 | 0.3% |
| Total | 361,537 | 100.0% |
Employment Status by Age in Area Code 435
According to the labor force statistics for Area Code 435, out of the total population over 16 years of age (600,145), 58.9% or 353,365 individuals are in the labor force, with 5.6% or 19,894 of them unemployed. The age group with the highest labor force participation rate is 45 to 54 years, with 81.0% or 66,314 individuals in the labor force. Within the labor force, the 16 to 19 years age range has the highest percentage of unemployed individuals, with 1,477.4% or 402,872 of them being unemployed.
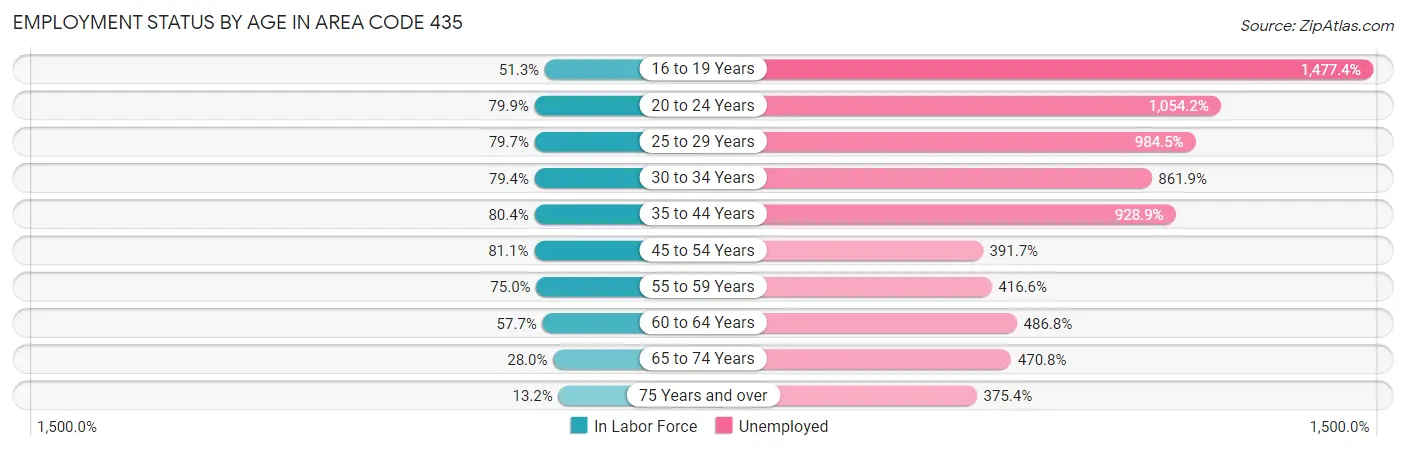
| Age Bracket | In Labor Force | Unemployed |
| 16 to 19 Years | 27,269 (51.3%) | 402,872 (1,477.4%) |
| 20 to 24 Years | 51,713 (79.9%) | 545,180 (1,054.2%) |
| 25 to 29 Years | 40,699 (79.7%) | 400,682 (984.5%) |
| 30 to 34 Years | 37,897 (79.4%) | 326,643 (861.9%) |
| 35 to 44 Years | 81,652 (80.4%) | 758,456 (928.9%) |
| 45 to 54 Years | 66,313 (81.0%) | 259,752 (391.7%) |
| 55 to 59 Years | 29,655 (75.0%) | 123,539 (416.6%) |
| 60 to 64 Years | 24,521 (57.7%) | 119,373 (486.8%) |
| 65 to 74 Years | 19,700 (28.0%) | 92,743 (470.8%) |
| 75 Years and over | 6,263 (13.2%) | 23,508 (375.4%) |
| Total | 353,348 (58.9%) | 19,910 (5.6%) |
Employment Status by Educational Attainment in Area Code 435
According to labor force statistics for Area Code 435, 74.4% of individuals (270,922) out of the total population between 25 and 64 years of age (364,241) are in the labor force, with 742.6% or 2,011,867 of them being unemployed. The group with the highest labor force participation rate are those with the educational attainment of bachelor's degree or higher, with 82.4% or 91,719 individuals in the labor force. Within the labor force, individuals with less than high school education have the highest percentage of unemployment, with 1,089.4% or 184,218 of them being unemployed.
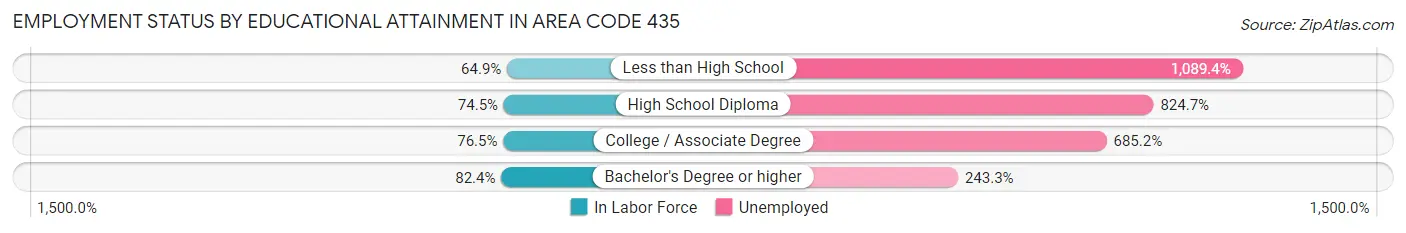
| Educational Attainment | In Labor Force | Unemployed |
| Less than High School | 16,910 (64.9%) | 283,767 (1,089.4%) |
| High School Diploma | 68,632 (74.5%) | 760,085 (824.7%) |
| College / Associate Degree | 103,012 (76.5%) | 923,088 (685.2%) |
| Bachelor's Degree or higher | 91,719 (82.4%) | 270,817 (243.3%) |
| Total | 270,912 (74.4%) | 2,704,854 (742.6%) |
Employment Occupations by Sex in Area Code 435
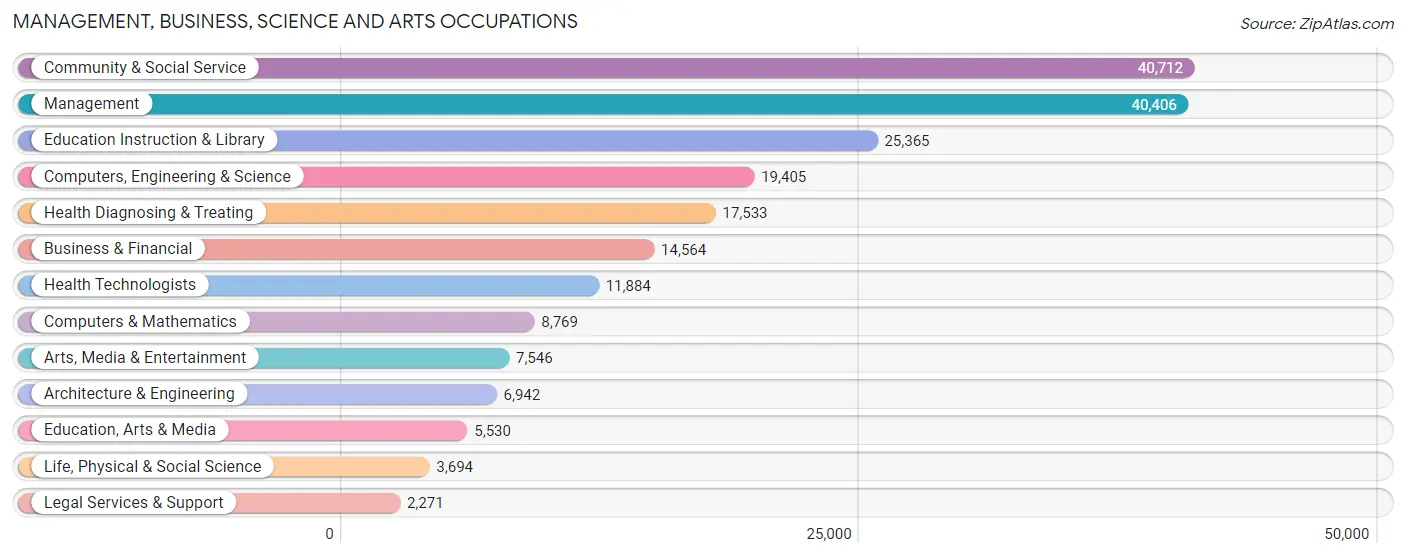
Management, Business, Science and Arts Occupations
The most common Management, Business, Science and Arts occupations in Area Code 435 are Community & Social Service (40,712 | 11.1%), Management (40,406 | 11.0%), Education Instruction & Library (25,365 | 6.9%), Computers, Engineering & Science (19,405 | 5.3%), and Health Diagnosing & Treating (17,533 | 4.8%).
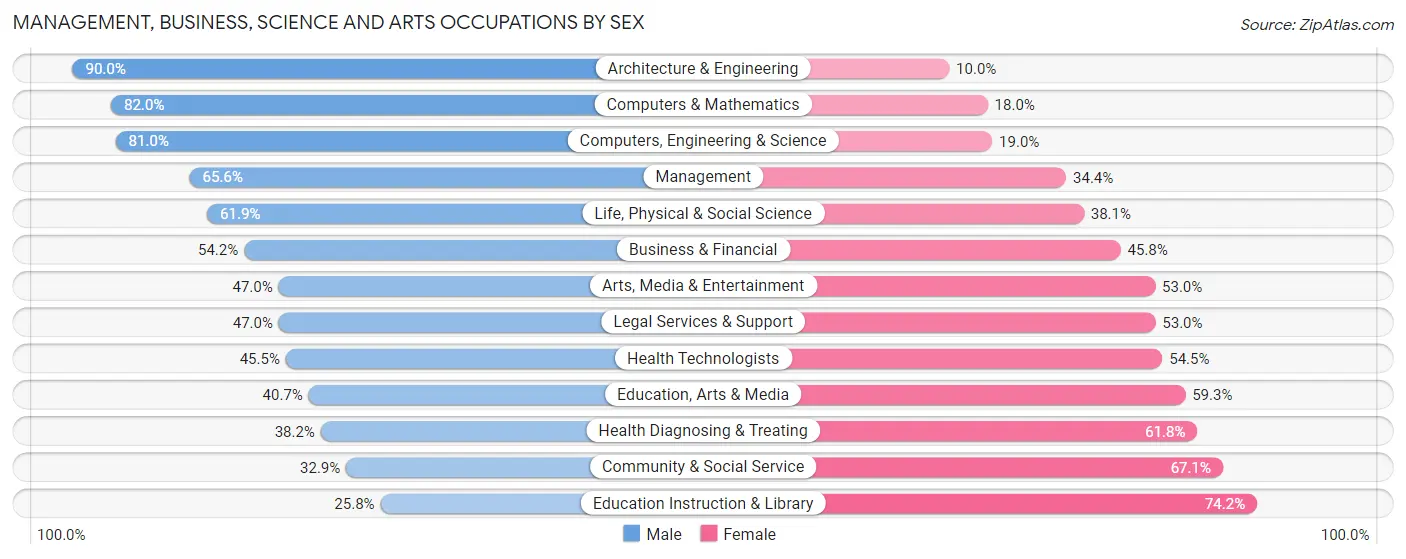
Management, Business, Science and Arts Occupations by Sex
Within the Management, Business, Science and Arts occupations in Area Code 435, the most male-oriented occupations are Architecture & Engineering (90.0%), Computers & Mathematics (82.0%), and Computers, Engineering & Science (81.0%), while the most female-oriented occupations are Education Instruction & Library (74.2%), Community & Social Service (67.1%), and Health Diagnosing & Treating (61.8%).
| Occupation | Male | Female |
| Management | 26,502 (65.6%) | 13,904 (34.4%) |
| Business & Financial | 7,896 (54.2%) | 6,668 (45.8%) |
| Computers, Engineering & Science | 15,721 (81.0%) | 3,684 (19.0%) |
| Computers & Mathematics | 7,187 (82.0%) | 1,582 (18.0%) |
| Architecture & Engineering | 6,247 (90.0%) | 695 (10.0%) |
| Life, Physical & Social Science | 2,287 (61.9%) | 1,407 (38.1%) |
| Community & Social Service | 13,407 (32.9%) | 27,305 (67.1%) |
| Education, Arts & Media | 2,253 (40.7%) | 3,277 (59.3%) |
| Legal Services & Support | 1,067 (47.0%) | 1,204 (53.0%) |
| Education Instruction & Library | 6,538 (25.8%) | 18,827 (74.2%) |
| Arts, Media & Entertainment | 3,549 (47.0%) | 3,997 (53.0%) |
| Health Diagnosing & Treating | 6,703 (38.2%) | 10,830 (61.8%) |
| Health Technologists | 5,411 (45.5%) | 6,473 (54.5%) |
| Total (Category) | 70,229 (53.0%) | 62,391 (47.0%) |
| Total (Overall) | 203,854 (55.5%) | 163,185 (44.5%) |
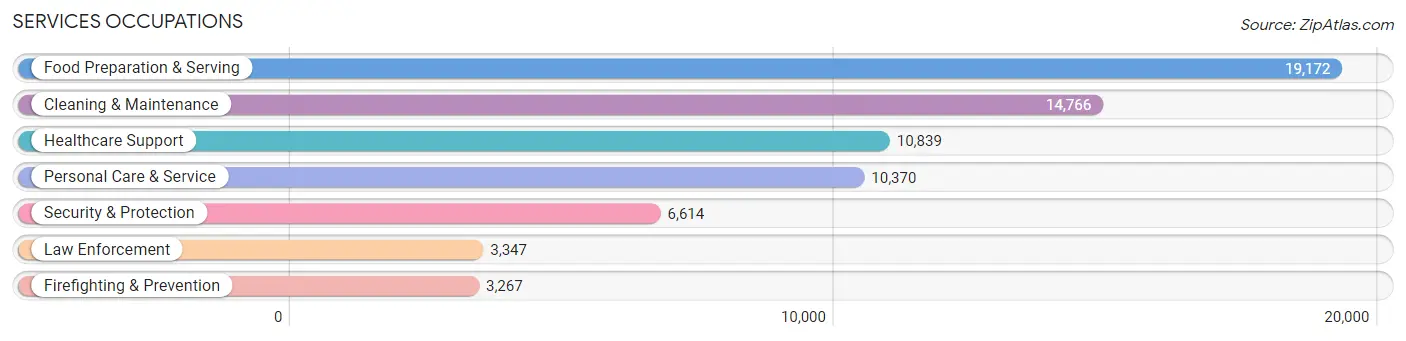
Services Occupations
The most common Services occupations in Area Code 435 are Food Preparation & Serving (19,172 | 5.2%), Cleaning & Maintenance (14,766 | 4.0%), Healthcare Support (10,839 | 2.9%), Personal Care & Service (10,370 | 2.8%), and Security & Protection (6,614 | 1.8%).
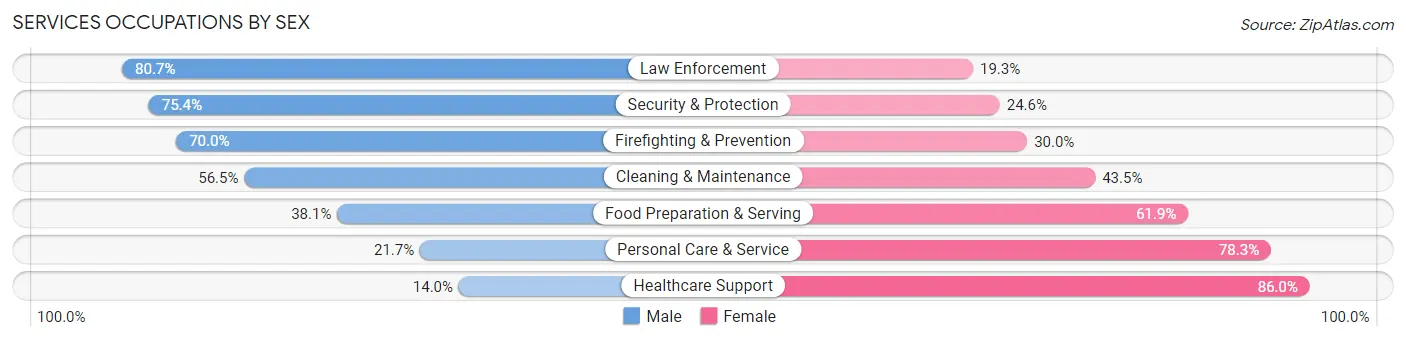
Services Occupations by Sex
Within the Services occupations in Area Code 435, the most male-oriented occupations are Law Enforcement (80.7%), Security & Protection (75.4%), and Firefighting & Prevention (70.0%), while the most female-oriented occupations are Healthcare Support (86.0%), Personal Care & Service (78.3%), and Food Preparation & Serving (61.9%).
| Occupation | Male | Female |
| Healthcare Support | 1,519 (14.0%) | 9,320 (86.0%) |
| Security & Protection | 4,987 (75.4%) | 1,627 (24.6%) |
| Firefighting & Prevention | 2,286 (70.0%) | 981 (30.0%) |
| Law Enforcement | 2,701 (80.7%) | 646 (19.3%) |
| Food Preparation & Serving | 7,303 (38.1%) | 11,869 (61.9%) |
| Cleaning & Maintenance | 8,343 (56.5%) | 6,423 (43.5%) |
| Personal Care & Service | 2,250 (21.7%) | 8,120 (78.3%) |
| Total (Category) | 24,402 (39.5%) | 37,359 (60.5%) |
| Total (Overall) | 203,854 (55.5%) | 163,185 (44.5%) |
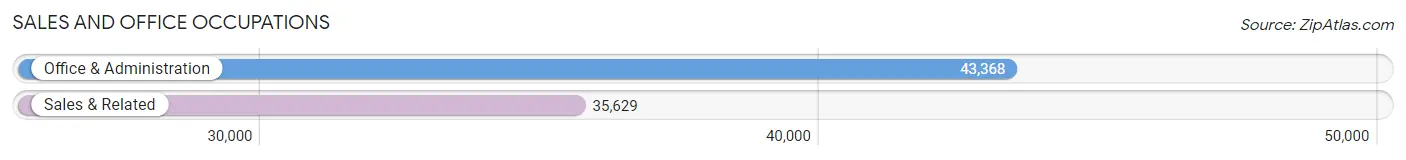
Sales and Office Occupations
The most common Sales and Office occupations in Area Code 435 are Office & Administration (43,368 | 11.8%), and Sales & Related (35,629 | 9.7%).
Sales and Office Occupations by Sex
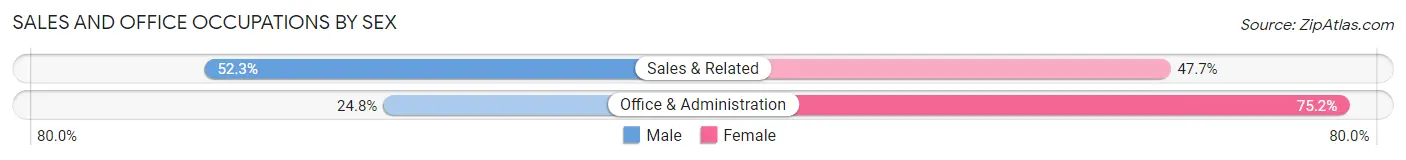
| Occupation | Male | Female |
| Sales & Related | 18,642 (52.3%) | 16,987 (47.7%) |
| Office & Administration | 10,773 (24.8%) | 32,595 (75.2%) |
| Total (Category) | 29,415 (37.2%) | 49,582 (62.8%) |
| Total (Overall) | 203,854 (55.5%) | 163,185 (44.5%) |
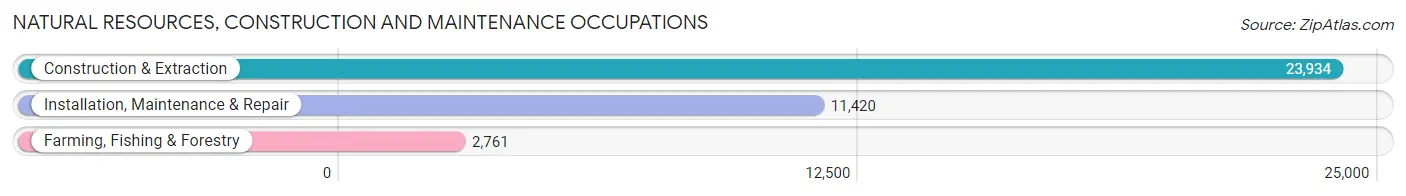
Natural Resources, Construction and Maintenance Occupations
The most common Natural Resources, Construction and Maintenance occupations in Area Code 435 are Construction & Extraction (23,934 | 6.5%), Installation, Maintenance & Repair (11,420 | 3.1%), and Farming, Fishing & Forestry (2,761 | 0.7%).
Natural Resources, Construction and Maintenance Occupations by Sex
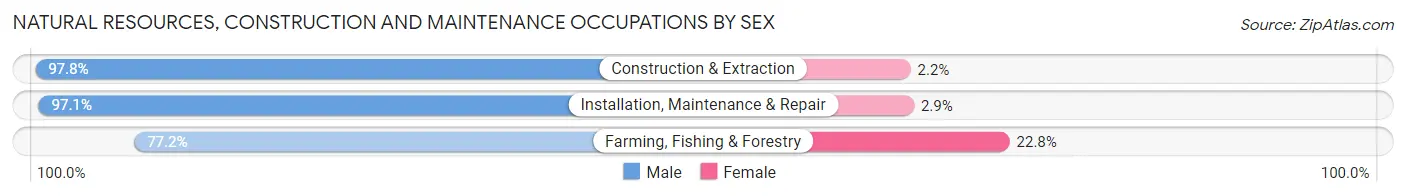
| Occupation | Male | Female |
| Farming, Fishing & Forestry | 2,131 (77.2%) | 630 (22.8%) |
| Construction & Extraction | 23,402 (97.8%) | 532 (2.2%) |
| Installation, Maintenance & Repair | 11,086 (97.1%) | 334 (2.9%) |
| Total (Category) | 36,619 (96.1%) | 1,496 (3.9%) |
| Total (Overall) | 203,854 (55.5%) | 163,185 (44.5%) |
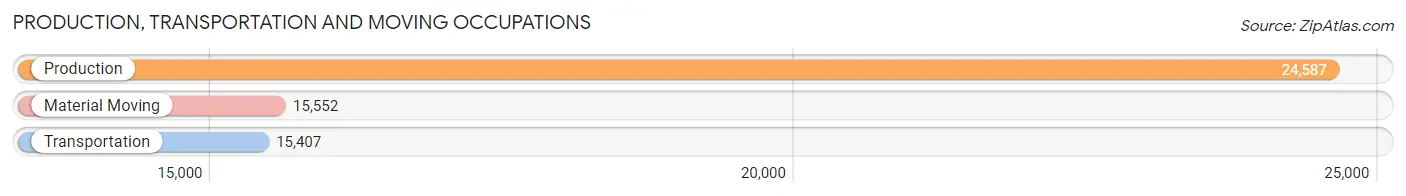
Production, Transportation and Moving Occupations
The most common Production, Transportation and Moving occupations in Area Code 435 are Production (24,587 | 6.7%), Material Moving (15,552 | 4.2%), and Transportation (15,407 | 4.2%).
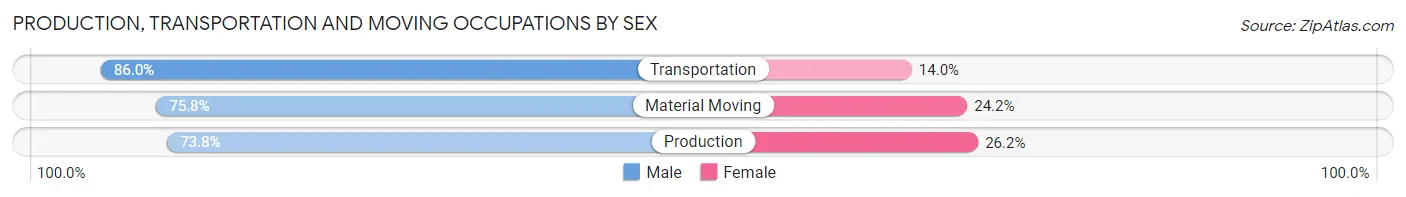
Production, Transportation and Moving Occupations by Sex
| Occupation | Male | Female |
| Production | 18,150 (73.8%) | 6,437 (26.2%) |
| Transportation | 13,248 (86.0%) | 2,159 (14.0%) |
| Material Moving | 11,791 (75.8%) | 3,761 (24.2%) |
| Total (Category) | 43,189 (77.7%) | 12,357 (22.3%) |
| Total (Overall) | 203,854 (55.5%) | 163,185 (44.5%) |
Employment Industries by Sex in Area Code 435
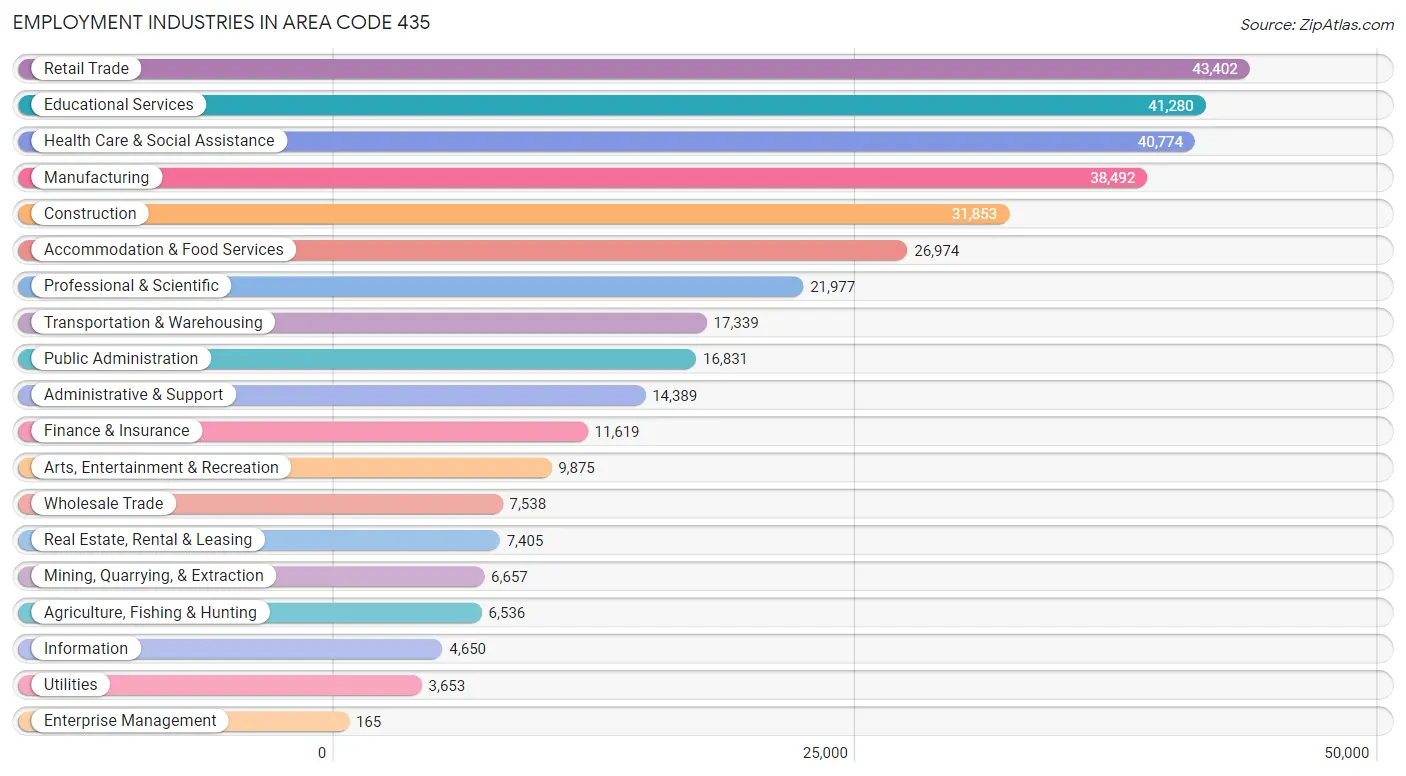
Employment Industries in Area Code 435
The major employment industries in Area Code 435 include Retail Trade (43,402 | 11.8%), Educational Services (41,280 | 11.3%), Health Care & Social Assistance (40,774 | 11.1%), Manufacturing (38,492 | 10.5%), and Construction (31,853 | 8.7%).
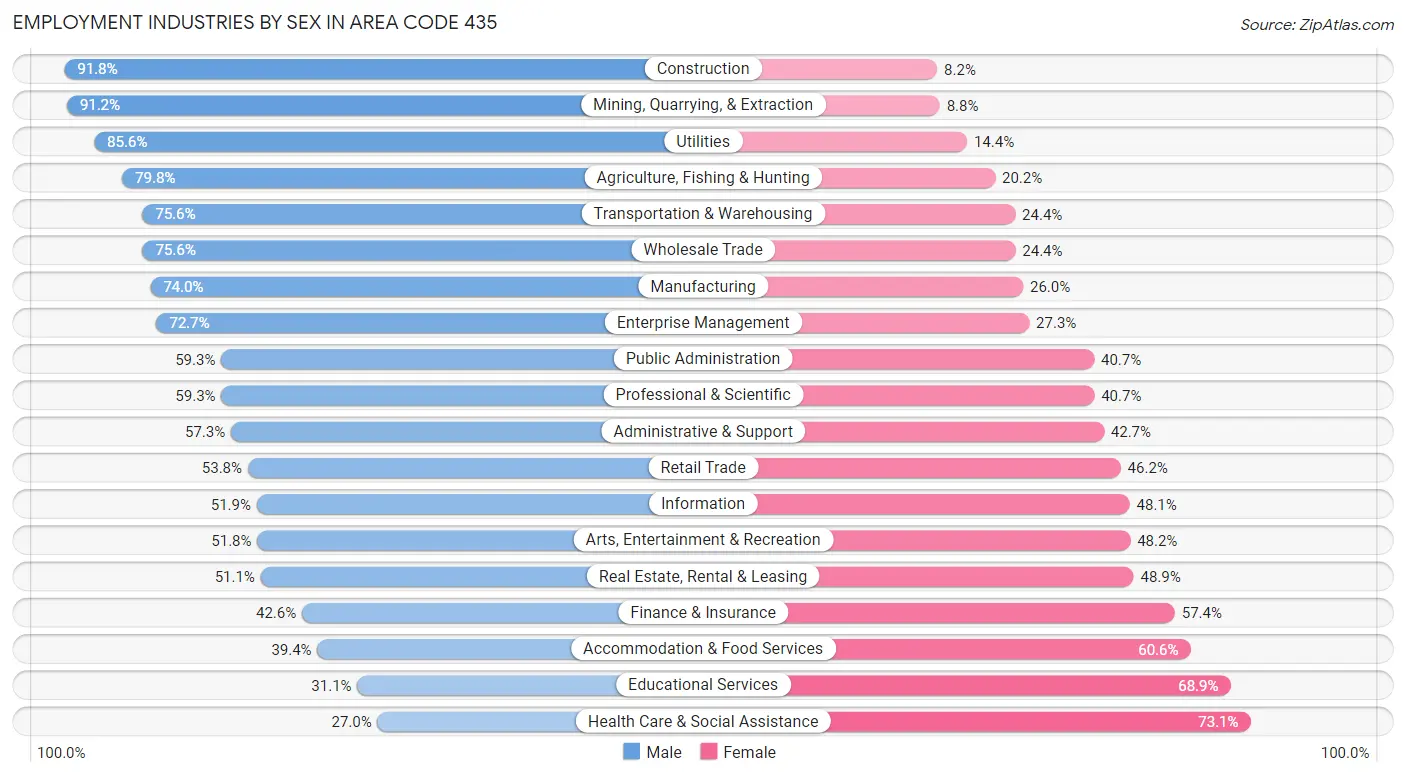
Employment Industries by Sex in Area Code 435
The Area Code 435 industries that see more men than women are Construction (91.8%), Mining, Quarrying, & Extraction (91.2%), and Utilities (85.6%), whereas the industries that tend to have a higher number of women are Health Care & Social Assistance (73.1%), Educational Services (68.9%), and Accommodation & Food Services (60.6%).
| Industry | Male | Female |
| Agriculture, Fishing & Hunting | 5,216 (79.8%) | 1,320 (20.2%) |
| Mining, Quarrying, & Extraction | 6,074 (91.2%) | 583 (8.8%) |
| Construction | 29,235 (91.8%) | 2,618 (8.2%) |
| Manufacturing | 28,483 (74.0%) | 10,009 (26.0%) |
| Wholesale Trade | 5,698 (75.6%) | 1,840 (24.4%) |
| Retail Trade | 23,346 (53.8%) | 20,056 (46.2%) |
| Transportation & Warehousing | 13,114 (75.6%) | 4,225 (24.4%) |
| Utilities | 3,127 (85.6%) | 526 (14.4%) |
| Information | 2,415 (51.9%) | 2,235 (48.1%) |
| Finance & Insurance | 4,947 (42.6%) | 6,672 (57.4%) |
| Real Estate, Rental & Leasing | 3,786 (51.1%) | 3,619 (48.9%) |
| Professional & Scientific | 13,024 (59.3%) | 8,953 (40.7%) |
| Enterprise Management | 120 (72.7%) | 45 (27.3%) |
| Administrative & Support | 8,241 (57.3%) | 6,148 (42.7%) |
| Educational Services | 12,842 (31.1%) | 28,438 (68.9%) |
| Health Care & Social Assistance | 10,989 (27.0%) | 29,785 (73.1%) |
| Arts, Entertainment & Recreation | 5,117 (51.8%) | 4,758 (48.2%) |
| Accommodation & Food Services | 10,622 (39.4%) | 16,352 (60.6%) |
| Public Administration | 9,981 (59.3%) | 6,850 (40.7%) |
| Total | 203,854 (55.5%) | 163,185 (44.5%) |
Education in Area Code 435
School Enrollment in Area Code 435
The most common levels of schooling among the 240,629 students in Area Code 435 are high school (55,404 | 23.0%), middle school (51,520 | 21.4%), and college / undergraduate (50,984 | 21.2%).
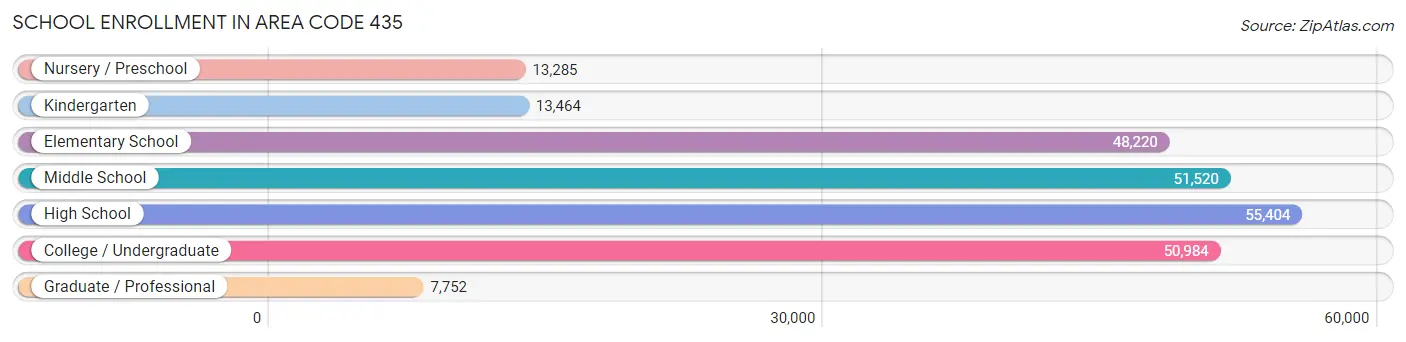
| School Level | # Students | % Students |
| Nursery / Preschool | 13,285 | 5.5% |
| Kindergarten | 13,464 | 5.6% |
| Elementary School | 48,220 | 20.0% |
| Middle School | 51,520 | 21.4% |
| High School | 55,404 | 23.0% |
| College / Undergraduate | 50,984 | 21.2% |
| Graduate / Professional | 7,752 | 3.2% |
| Total | 240,629 | 100.0% |
School Enrollment by Age by Funding Source in Area Code 435
Out of a total of 240,629 students who are enrolled in schools in Area Code 435, 24,140 (10.0%) attend a private institution, while the remaining 216,489 (90.0%) are enrolled in public schools. The age group of 3 to 4 year olds has the highest likelihood of being enrolled in private schools, with 3,467 (35.4% in the age bracket) enrolled. Conversely, the age group of 10 to 14 year olds has the lowest likelihood of being enrolled in a private school, with 60,911 (94.5% in the age bracket) attending a public institution.
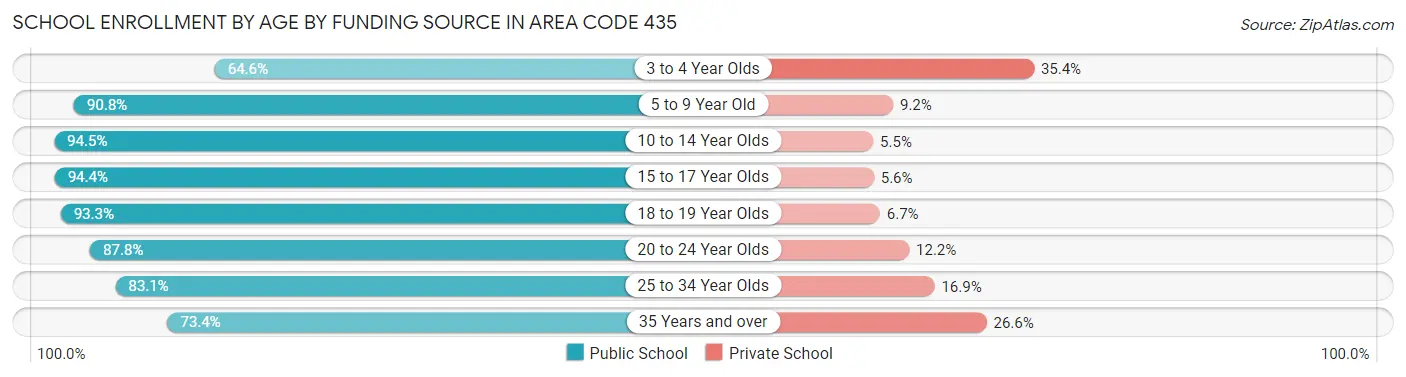
| Age Bracket | Public School | Private School |
| 3 to 4 Year Olds | 6,317 (64.6%) | 3,467 (35.4%) |
| 5 to 9 Year Old | 54,151 (90.8%) | 5,477 (9.2%) |
| 10 to 14 Year Olds | 60,911 (94.5%) | 3,537 (5.5%) |
| 15 to 17 Year Olds | 37,003 (94.4%) | 2,201 (5.6%) |
| 18 to 19 Year Olds | 16,657 (93.3%) | 1,204 (6.7%) |
| 20 to 24 Year Olds | 23,078 (87.8%) | 3,205 (12.2%) |
| 25 to 34 Year Olds | 10,084 (83.1%) | 2,054 (16.9%) |
| 35 Years and over | 8,281 (73.4%) | 3,002 (26.6%) |
| Total | 216,489 (90.0%) | 24,140 (10.0%) |
Educational Attainment by Field of Study in Area Code 435
Business (29,339 | 18.1%), education (26,035 | 16.0%), science & technology (16,044 | 9.9%), arts & humanities (12,887 | 7.9%), and bio, nature & agricultural (12,482 | 7.7%) are the most common fields of study among 162,395 individuals in Area Code 435 who have obtained a bachelor's degree or higher.
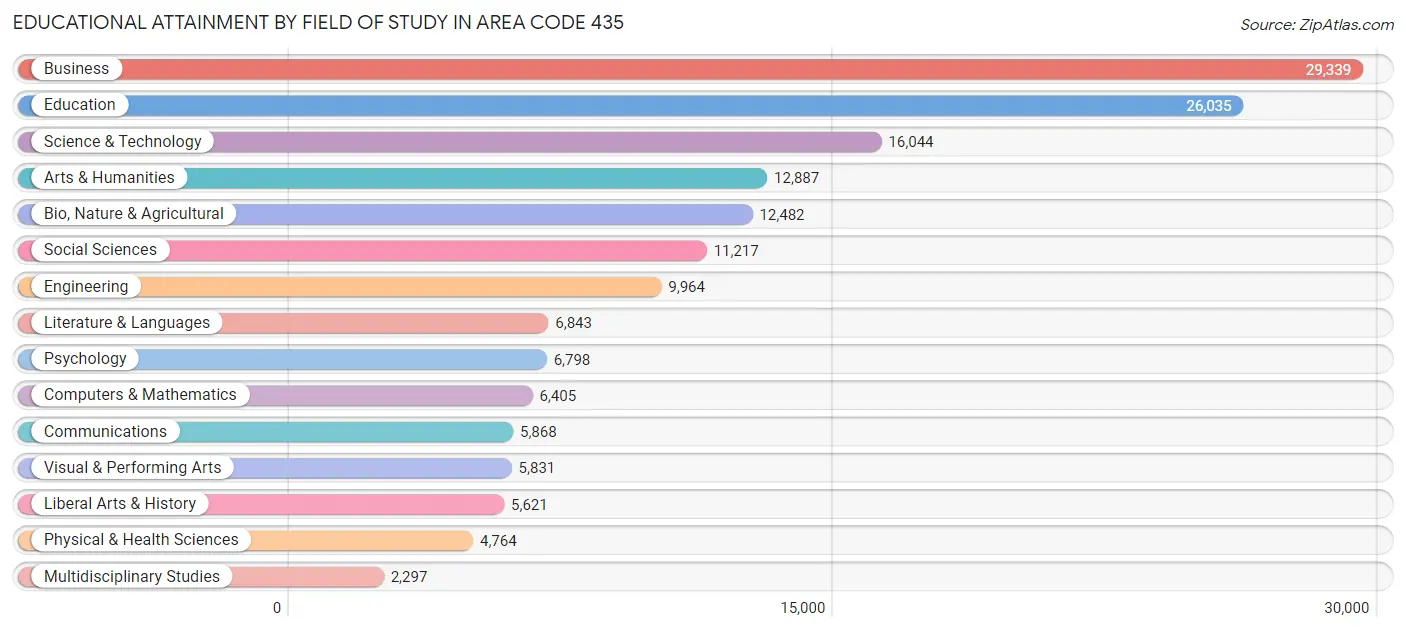
| Field of Study | # Graduates | % Graduates |
| Computers & Mathematics | 6,405 | 3.9% |
| Bio, Nature & Agricultural | 12,482 | 7.7% |
| Physical & Health Sciences | 4,764 | 2.9% |
| Psychology | 6,798 | 4.2% |
| Social Sciences | 11,217 | 6.9% |
| Engineering | 9,964 | 6.1% |
| Multidisciplinary Studies | 2,297 | 1.4% |
| Science & Technology | 16,044 | 9.9% |
| Business | 29,339 | 18.1% |
| Education | 26,035 | 16.0% |
| Literature & Languages | 6,843 | 4.2% |
| Liberal Arts & History | 5,621 | 3.5% |
| Visual & Performing Arts | 5,831 | 3.6% |
| Communications | 5,868 | 3.6% |
| Arts & Humanities | 12,887 | 7.9% |
| Total | 162,395 | 100.0% |
Transportation & Commute in Area Code 435
Vehicle Availability by Sex in Area Code 435
The most prevalent vehicle ownership categories in Area Code 435 are males with 2 vehicles (70,288, accounting for 35.1%) and females with 2 vehicles (54,157, making up 44.5%).
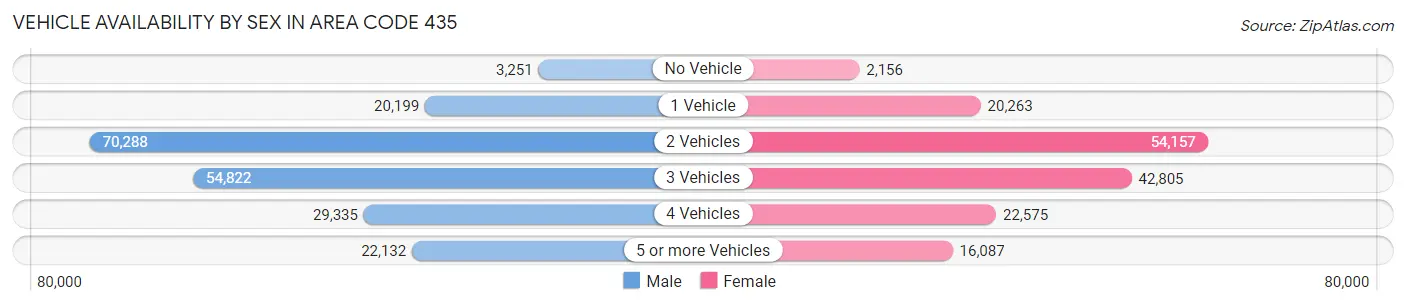
| Vehicles Available | Male | Female |
| No Vehicle | 3,251 (1.6%) | 2,156 (1.4%) |
| 1 Vehicle | 20,199 (10.1%) | 20,263 (12.8%) |
| 2 Vehicles | 70,288 (35.1%) | 54,157 (34.3%) |
| 3 Vehicles | 54,822 (27.4%) | 42,805 (27.1%) |
| 4 Vehicles | 29,335 (14.7%) | 22,575 (14.3%) |
| 5 or more Vehicles | 22,132 (11.1%) | 16,087 (10.2%) |
| Total | 200,027 (100.0%) | 158,043 (100.0%) |
Commute Time in Area Code 435
The most frequently occuring commute durations in Area Code 435 are 5 to 9 minutes (64,693 commuters, 20.2%), 10 to 14 minutes (61,646 commuters, 19.3%), and 15 to 19 minutes (48,237 commuters, 15.1%).
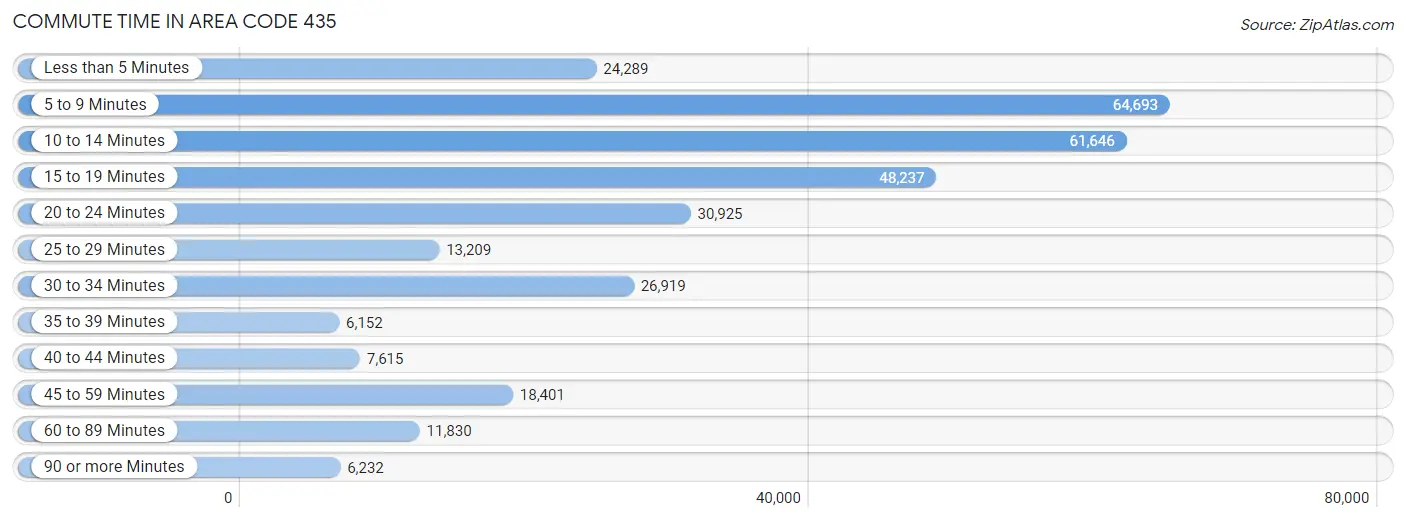
| Commute Time | # Commuters | % Commuters |
| Less than 5 Minutes | 24,289 | 7.6% |
| 5 to 9 Minutes | 64,693 | 20.2% |
| 10 to 14 Minutes | 61,646 | 19.3% |
| 15 to 19 Minutes | 48,237 | 15.1% |
| 20 to 24 Minutes | 30,925 | 9.7% |
| 25 to 29 Minutes | 13,209 | 4.1% |
| 30 to 34 Minutes | 26,919 | 8.4% |
| 35 to 39 Minutes | 6,152 | 1.9% |
| 40 to 44 Minutes | 7,615 | 2.4% |
| 45 to 59 Minutes | 18,401 | 5.8% |
| 60 to 89 Minutes | 11,830 | 3.7% |
| 90 or more Minutes | 6,232 | 1.9% |
Commute Time by Sex in Area Code 435
The most common commute times in Area Code 435 are 5 to 9 minutes (32,503 commuters, 17.9%) for males and 5 to 9 minutes (32,190 commuters, 23.3%) for females.
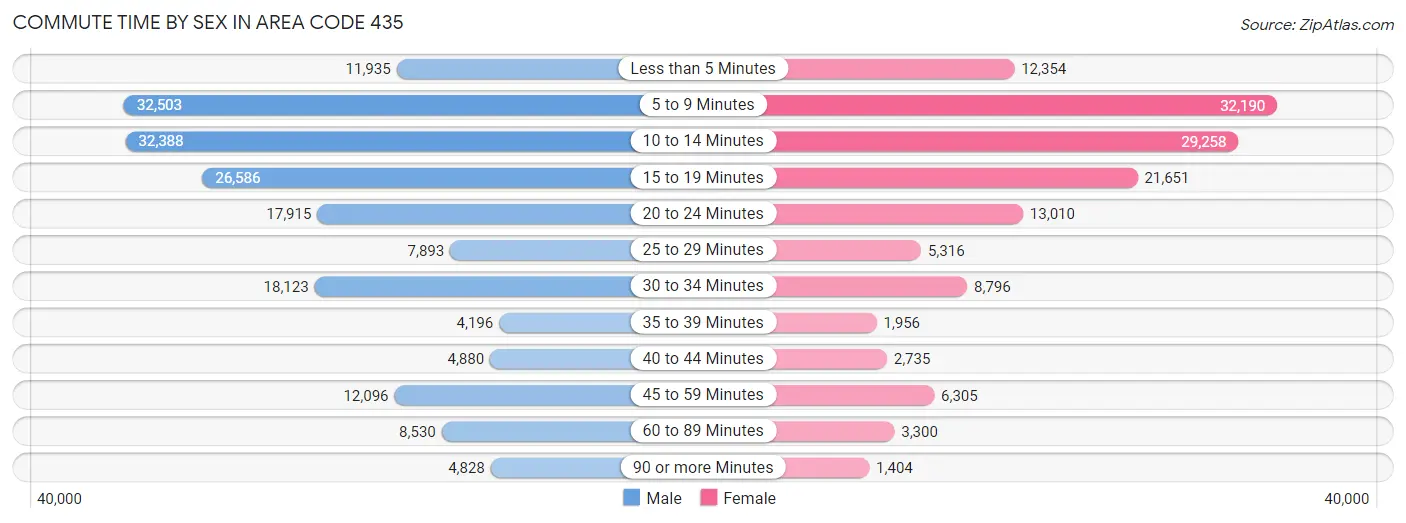
| Commute Time | Male | Female |
| Less than 5 Minutes | 11,935 (6.6%) | 12,354 (8.9%) |
| 5 to 9 Minutes | 32,503 (17.9%) | 32,190 (23.3%) |
| 10 to 14 Minutes | 32,388 (17.8%) | 29,258 (21.2%) |
| 15 to 19 Minutes | 26,586 (14.6%) | 21,651 (15.7%) |
| 20 to 24 Minutes | 17,915 (9.9%) | 13,010 (9.4%) |
| 25 to 29 Minutes | 7,893 (4.3%) | 5,316 (3.8%) |
| 30 to 34 Minutes | 18,123 (10.0%) | 8,796 (6.4%) |
| 35 to 39 Minutes | 4,196 (2.3%) | 1,956 (1.4%) |
| 40 to 44 Minutes | 4,880 (2.7%) | 2,735 (2.0%) |
| 45 to 59 Minutes | 12,096 (6.7%) | 6,305 (4.6%) |
| 60 to 89 Minutes | 8,530 (4.7%) | 3,300 (2.4%) |
| 90 or more Minutes | 4,828 (2.6%) | 1,404 (1.0%) |
Time of Departure to Work by Sex in Area Code 435
The most frequent times of departure to work in Area Code 435 are 7:00 AM to 7:29 AM (24,552, 13.5%) for males and 7:30 AM to 7:59 AM (19,842, 14.3%) for females.
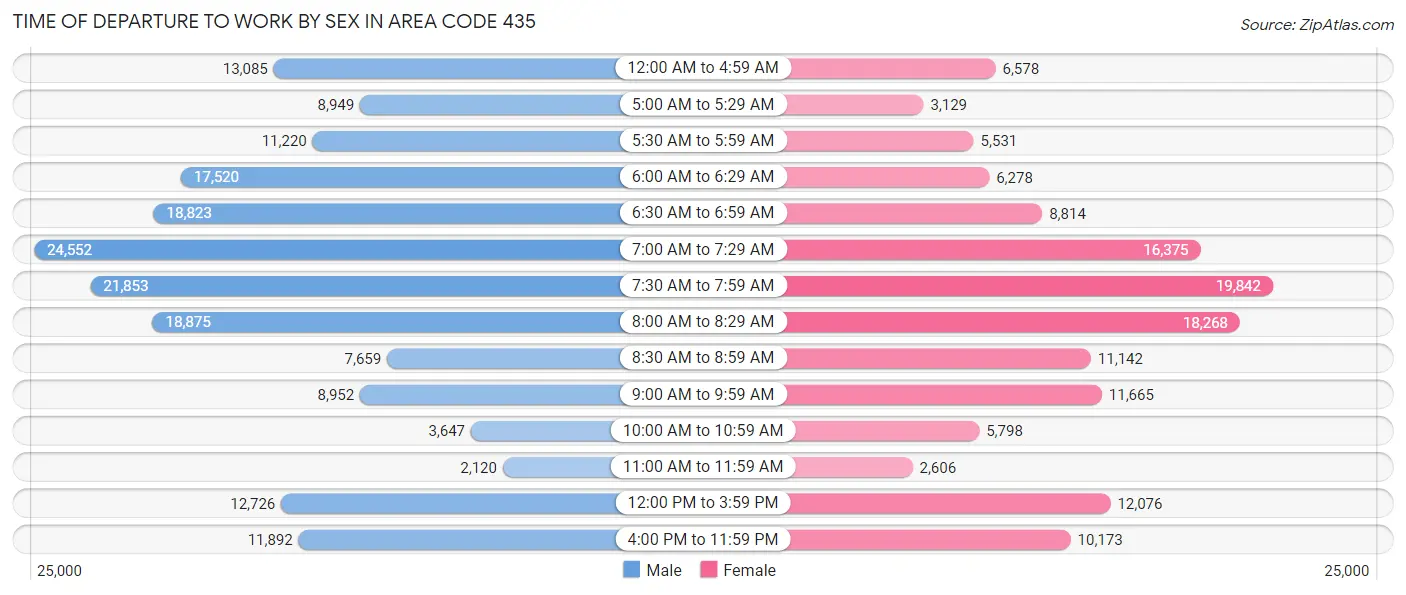
| Time of Departure | Male | Female |
| 12:00 AM to 4:59 AM | 13,085 (7.2%) | 6,578 (4.8%) |
| 5:00 AM to 5:29 AM | 8,949 (4.9%) | 3,129 (2.3%) |
| 5:30 AM to 5:59 AM | 11,220 (6.2%) | 5,531 (4.0%) |
| 6:00 AM to 6:29 AM | 17,520 (9.6%) | 6,278 (4.5%) |
| 6:30 AM to 6:59 AM | 18,823 (10.3%) | 8,814 (6.4%) |
| 7:00 AM to 7:29 AM | 24,552 (13.5%) | 16,375 (11.8%) |
| 7:30 AM to 7:59 AM | 21,853 (12.0%) | 19,842 (14.3%) |
| 8:00 AM to 8:29 AM | 18,875 (10.4%) | 18,268 (13.2%) |
| 8:30 AM to 8:59 AM | 7,659 (4.2%) | 11,142 (8.1%) |
| 9:00 AM to 9:59 AM | 8,952 (4.9%) | 11,665 (8.4%) |
| 10:00 AM to 10:59 AM | 3,647 (2.0%) | 5,798 (4.2%) |
| 11:00 AM to 11:59 AM | 2,120 (1.2%) | 2,606 (1.9%) |
| 12:00 PM to 3:59 PM | 12,726 (7.0%) | 12,076 (8.7%) |
| 4:00 PM to 11:59 PM | 11,892 (6.5%) | 10,173 (7.4%) |
| Total | 181,873 (100.0%) | 138,275 (100.0%) |
Housing Occupancy in Area Code 435
Occupancy by Ownership in Area Code 435
Of the total 261,872 dwellings in Area Code 435, owner-occupied units account for 192,331 (73.4%), while renter-occupied units make up 69,541 (26.6%).
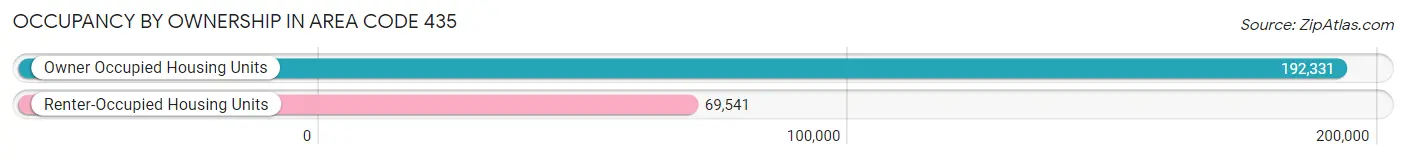
| Occupancy | # Housing Units | % Housing Units |
| Owner Occupied Housing Units | 192,331 | 73.4% |
| Renter-Occupied Housing Units | 69,541 | 26.6% |
| Total Occupied Housing Units | 261,872 | 100.0% |
Occupancy by Household Size in Area Code 435
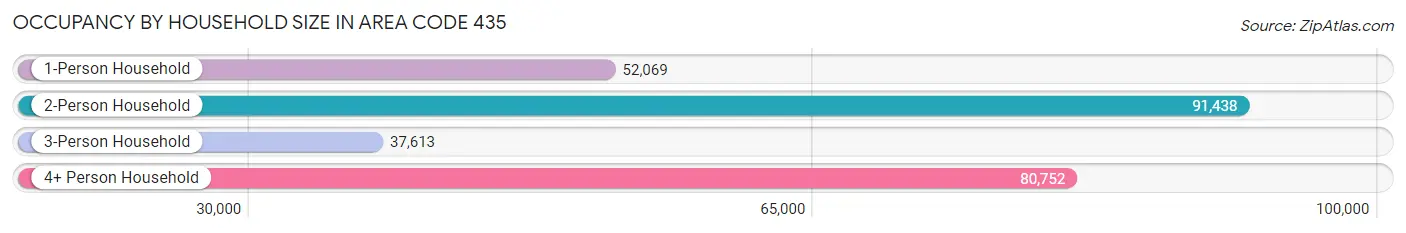
| Household Size | # Housing Units | % Housing Units |
| 1-Person Household | 52,069 | 19.9% |
| 2-Person Household | 91,438 | 34.9% |
| 3-Person Household | 37,613 | 14.4% |
| 4+ Person Household | 80,752 | 30.8% |
| Total Housing Units | 261,872 | 100.0% |
Occupancy by Ownership by Household Size in Area Code 435
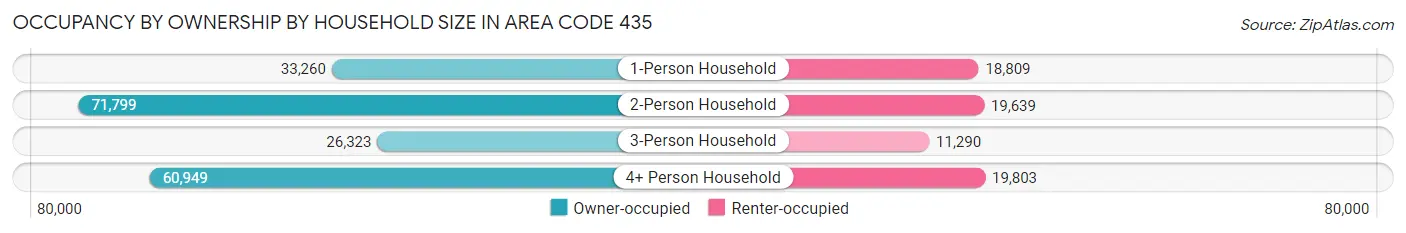
| Household Size | Owner-occupied | Renter-occupied |
| 1-Person Household | 33,260 (63.9%) | 18,809 (36.1%) |
| 2-Person Household | 71,799 (78.5%) | 19,639 (21.5%) |
| 3-Person Household | 26,323 (70.0%) | 11,290 (30.0%) |
| 4+ Person Household | 60,949 (75.5%) | 19,803 (24.5%) |
| Total Housing Units | 192,331 (73.4%) | 69,541 (26.6%) |
Occupancy by Educational Attainment in Area Code 435
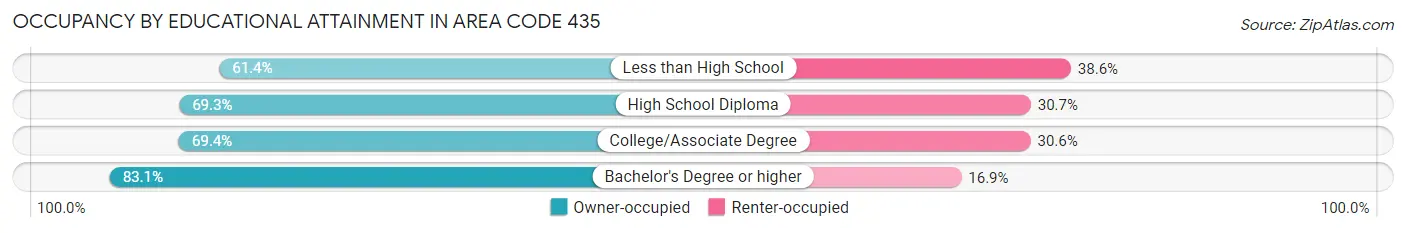
| Household Size | Owner-occupied | Renter-occupied |
| Less than High School | 8,567 (61.4%) | 5,387 (38.6%) |
| High School Diploma | 41,404 (69.3%) | 18,310 (30.7%) |
| College/Associate Degree | 71,155 (69.4%) | 31,375 (30.6%) |
| Bachelor's Degree or higher | 71,205 (83.1%) | 14,469 (16.9%) |
Occupancy by Age of Householder in Area Code 435
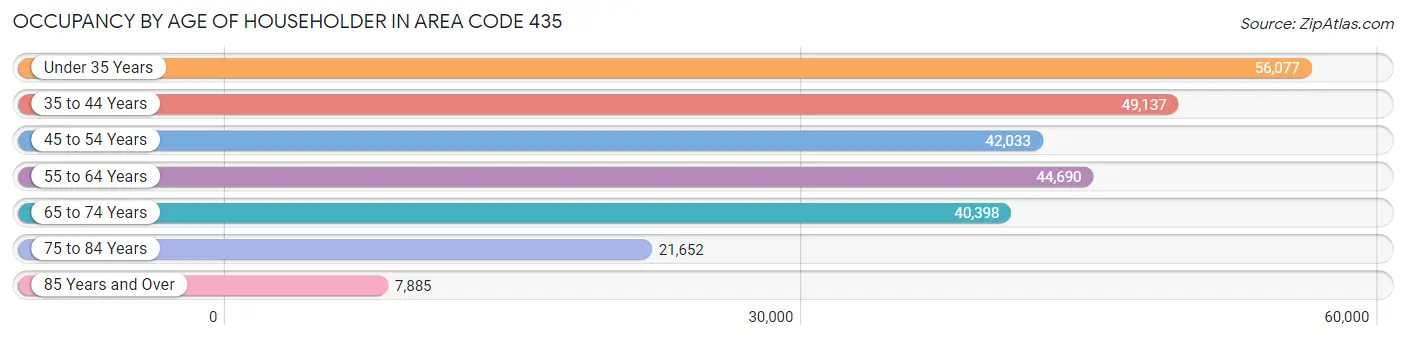
| Age Bracket | # Households | % Households |
| Under 35 Years | 56,077 | 21.4% |
| 35 to 44 Years | 49,137 | 18.8% |
| 45 to 54 Years | 42,033 | 16.1% |
| 55 to 64 Years | 44,690 | 17.1% |
| 65 to 74 Years | 40,398 | 15.4% |
| 75 to 84 Years | 21,652 | 8.3% |
| 85 Years and Over | 7,885 | 3.0% |
| Total | 261,872 | 100.0% |
Housing Finances in Area Code 435
Median Income by Occupancy in Area Code 435
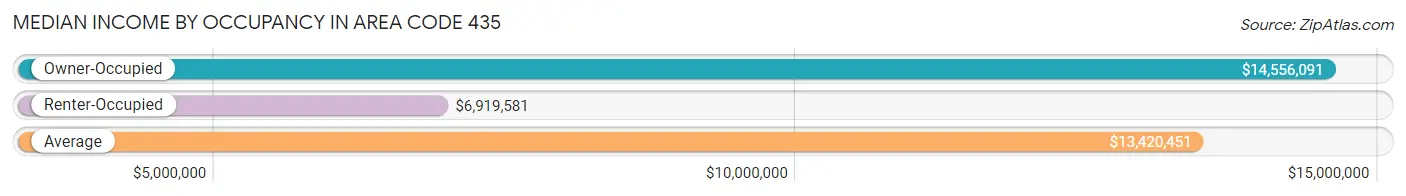
| Occupancy Type | # Households | Median Income |
| Owner-Occupied | 192,331 (73.4%) | $14,556,091 |
| Renter-Occupied | 69,541 (26.6%) | $6,919,581 |
| Average | 261,872 (100.0%) | $13,420,451 |
Occupancy by Householder Income Bracket in Area Code 435
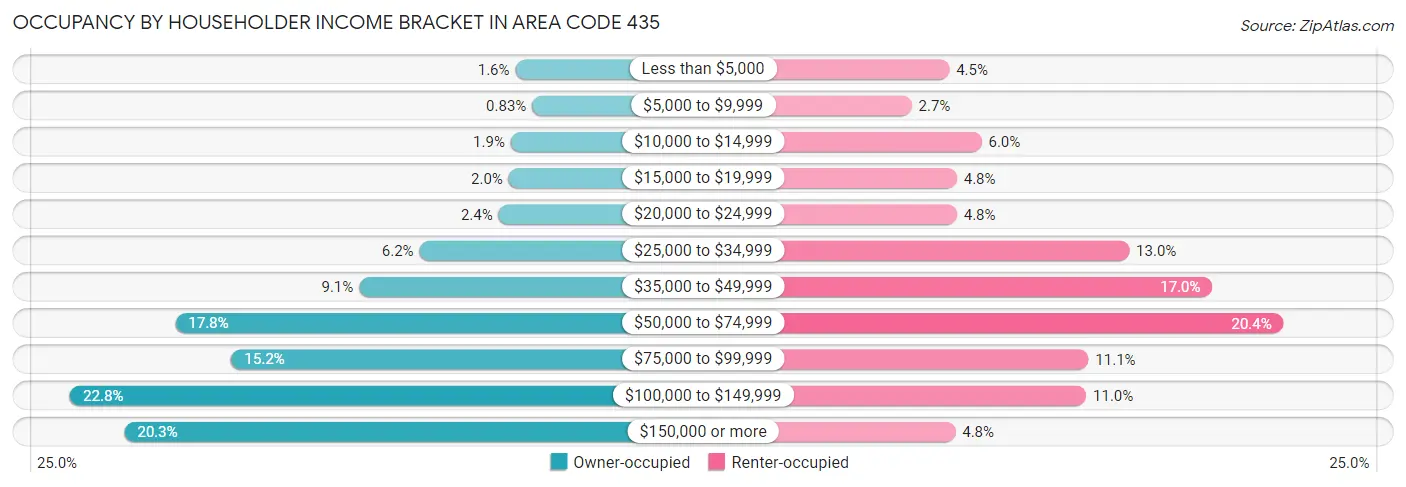
| Income Bracket | Owner-occupied | Renter-occupied |
| Less than $5,000 | 3,131 (1.6%) | 3,100 (4.5%) |
| $5,000 to $9,999 | 1,601 (0.8%) | 1,860 (2.7%) |
| $10,000 to $14,999 | 3,553 (1.8%) | 4,174 (6.0%) |
| $15,000 to $19,999 | 3,752 (1.9%) | 3,351 (4.8%) |
| $20,000 to $24,999 | 4,673 (2.4%) | 3,351 (4.8%) |
| $25,000 to $34,999 | 11,918 (6.2%) | 9,063 (13.0%) |
| $35,000 to $49,999 | 17,437 (9.1%) | 11,813 (17.0%) |
| $50,000 to $74,999 | 34,269 (17.8%) | 14,175 (20.4%) |
| $75,000 to $99,999 | 29,147 (15.1%) | 7,712 (11.1%) |
| $100,000 to $149,999 | 43,912 (22.8%) | 7,639 (11.0%) |
| $150,000 or more | 38,938 (20.3%) | 3,303 (4.8%) |
| Total | 192,331 (100.0%) | 69,541 (100.0%) |
Monthly Housing Cost Tiers in Area Code 435
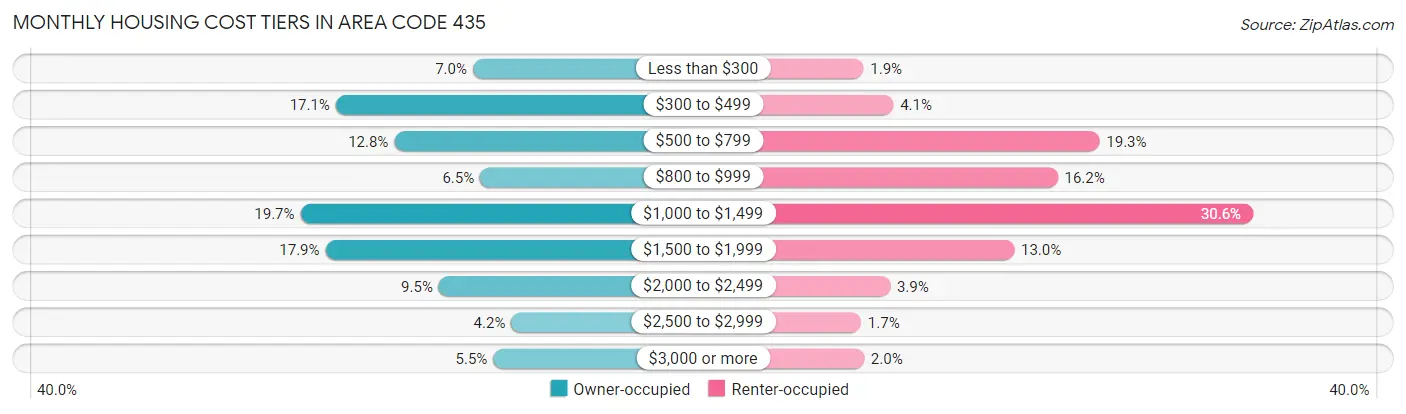
| Monthly Cost | Owner-occupied | Renter-occupied |
| Less than $300 | 13,439 (7.0%) | 1,328 (1.9%) |
| $300 to $499 | 32,861 (17.1%) | 2,861 (4.1%) |
| $500 to $799 | 24,579 (12.8%) | 13,412 (19.3%) |
| $800 to $999 | 12,421 (6.5%) | 11,272 (16.2%) |
| $1,000 to $1,499 | 37,879 (19.7%) | 21,280 (30.6%) |
| $1,500 to $1,999 | 34,339 (17.8%) | 9,047 (13.0%) |
| $2,000 to $2,499 | 18,269 (9.5%) | 2,689 (3.9%) |
| $2,500 to $2,999 | 7,992 (4.2%) | 1,201 (1.7%) |
| $3,000 or more | 10,552 (5.5%) | 1,356 (1.9%) |
| Total | 192,331 (100.0%) | 69,541 (100.0%) |
Physical Housing Characteristics in Area Code 435
Housing Structures in Area Code 435
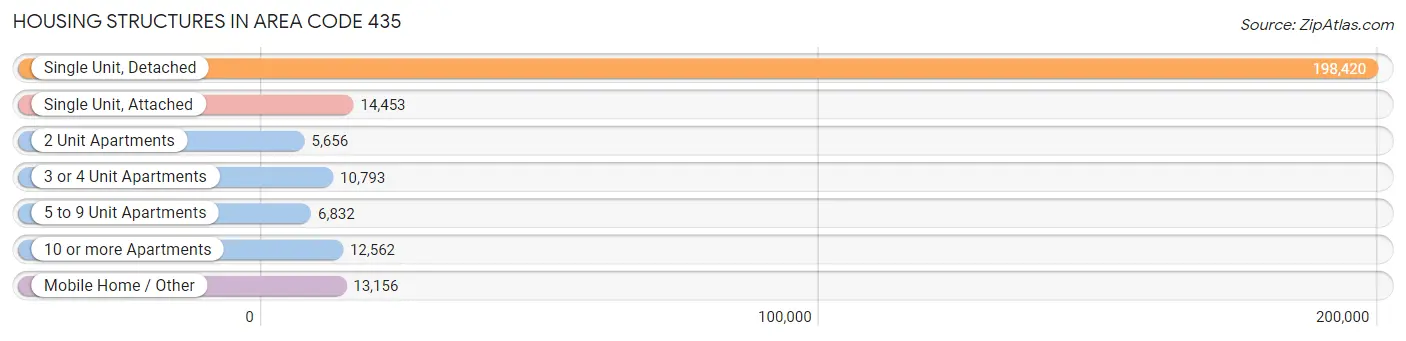
| Structure Type | # Housing Units | % Housing Units |
| Single Unit, Detached | 198,420 | 75.8% |
| Single Unit, Attached | 14,453 | 5.5% |
| 2 Unit Apartments | 5,656 | 2.2% |
| 3 or 4 Unit Apartments | 10,793 | 4.1% |
| 5 to 9 Unit Apartments | 6,832 | 2.6% |
| 10 or more Apartments | 12,562 | 4.8% |
| Mobile Home / Other | 13,156 | 5.0% |
| Total | 261,872 | 100.0% |
Housing Structures by Occupancy in Area Code 435
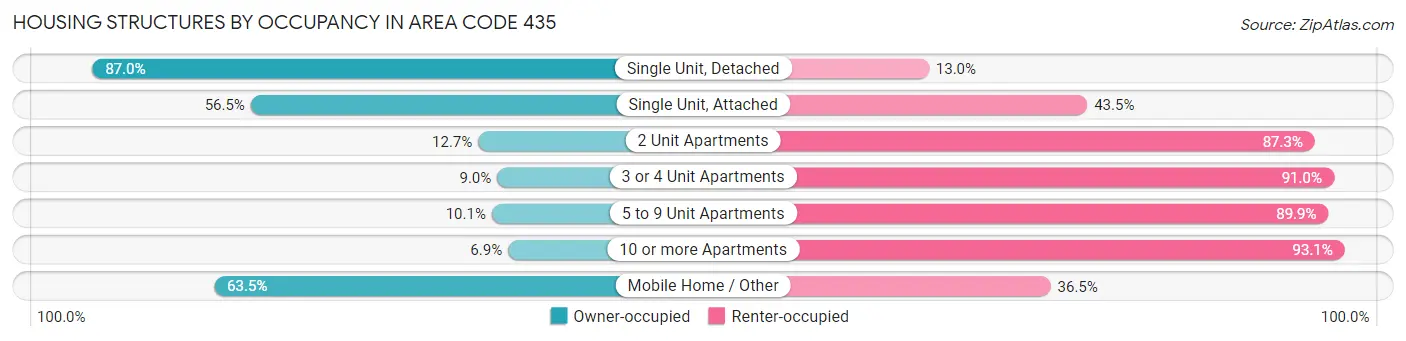
| Structure Type | Owner-occupied | Renter-occupied |
| Single Unit, Detached | 172,563 (87.0%) | 25,857 (13.0%) |
| Single Unit, Attached | 8,162 (56.5%) | 6,291 (43.5%) |
| 2 Unit Apartments | 717 (12.7%) | 4,939 (87.3%) |
| 3 or 4 Unit Apartments | 974 (9.0%) | 9,819 (91.0%) |
| 5 to 9 Unit Apartments | 687 (10.1%) | 6,145 (89.9%) |
| 10 or more Apartments | 870 (6.9%) | 11,692 (93.1%) |
| Mobile Home / Other | 8,358 (63.5%) | 4,798 (36.5%) |
| Total | 192,331 (73.4%) | 69,541 (26.6%) |
Housing Structures by Number of Rooms in Area Code 435
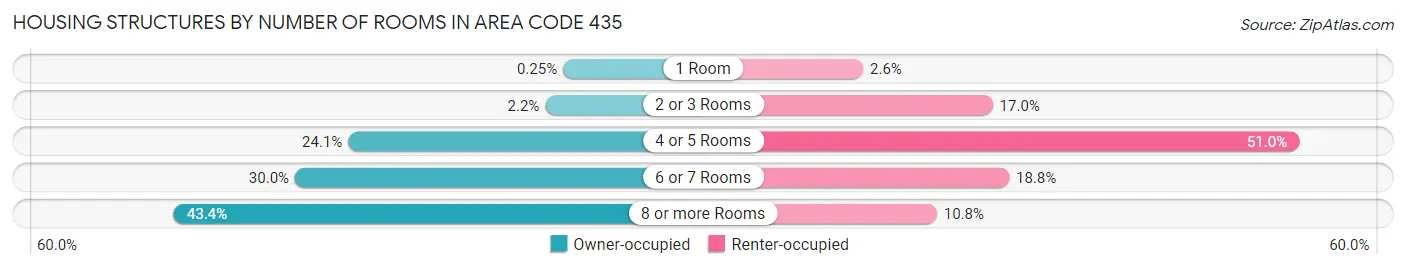
| Number of Rooms | Owner-occupied | Renter-occupied |
| 1 Room | 480 (0.3%) | 1,790 (2.6%) |
| 2 or 3 Rooms | 4,279 (2.2%) | 11,788 (17.0%) |
| 4 or 5 Rooms | 46,341 (24.1%) | 35,434 (50.9%) |
| 6 or 7 Rooms | 57,705 (30.0%) | 13,056 (18.8%) |
| 8 or more Rooms | 83,526 (43.4%) | 7,473 (10.7%) |
| Total | 192,331 (100.0%) | 69,541 (100.0%) |
Housing Structure by Heating Type in Area Code 435
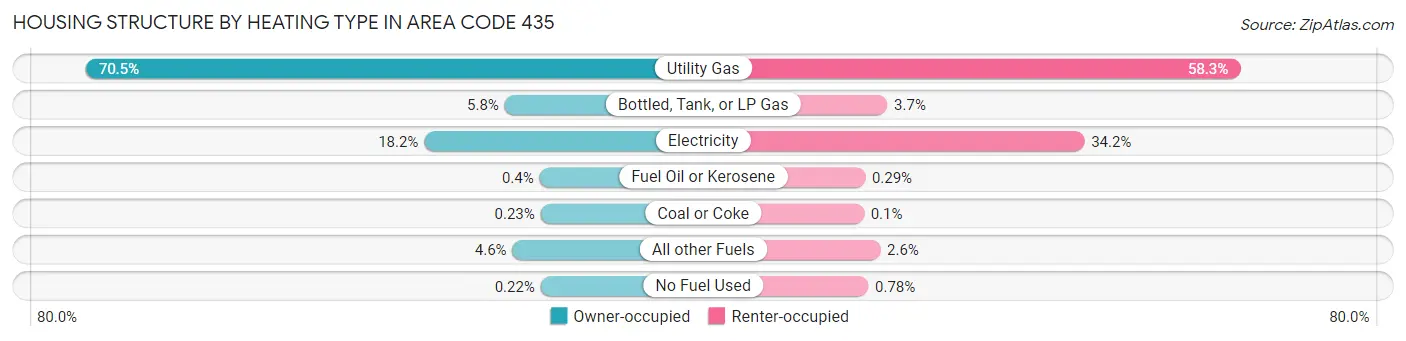
| Heating Type | Owner-occupied | Renter-occupied |
| Utility Gas | 135,673 (70.5%) | 40,521 (58.3%) |
| Bottled, Tank, or LP Gas | 11,130 (5.8%) | 2,594 (3.7%) |
| Electricity | 35,054 (18.2%) | 23,775 (34.2%) |
| Fuel Oil or Kerosene | 772 (0.4%) | 201 (0.3%) |
| Coal or Coke | 446 (0.2%) | 70 (0.1%) |
| All other Fuels | 8,834 (4.6%) | 1,837 (2.6%) |
| No Fuel Used | 422 (0.2%) | 543 (0.8%) |
| Total | 192,331 (100.0%) | 69,541 (100.0%) |
Household Vehicle Usage in Area Code 435
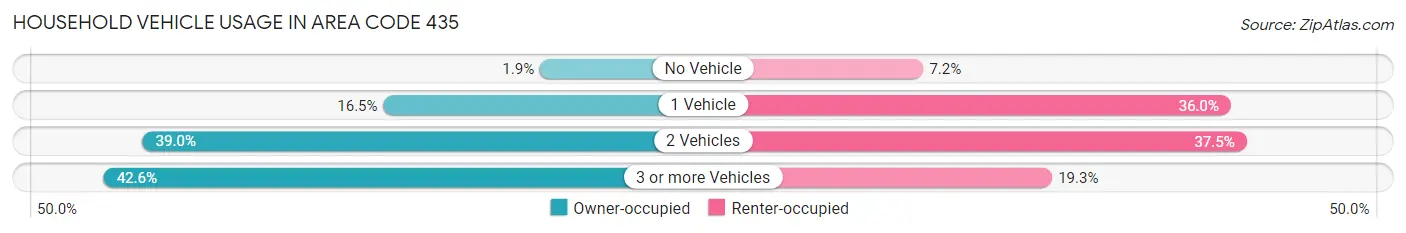
| Vehicles per Household | Owner-occupied | Renter-occupied |
| No Vehicle | 3,641 (1.9%) | 5,035 (7.2%) |
| 1 Vehicle | 31,763 (16.5%) | 25,050 (36.0%) |
| 2 Vehicles | 74,980 (39.0%) | 26,065 (37.5%) |
| 3 or more Vehicles | 81,947 (42.6%) | 13,391 (19.3%) |
| Total | 192,331 (100.0%) | 69,541 (100.0%) |
Real Estate & Mortgages in Area Code 435
Real Estate and Mortgage Overview in Area Code 435
| Characteristic | Without Mortgage | With Mortgage |
| Housing Units | 71,309 | 121,022 |
| Median Property Value | $50,177,000 | $55,554,800 |
| Median Household Income | $11,016,005 | $27,912 |
| Monthly Housing Costs | $74,001 | $10,422 |
| Real Estate Taxes | $247,821 | $3,055 |
Property Value by Mortgage Status in Area Code 435
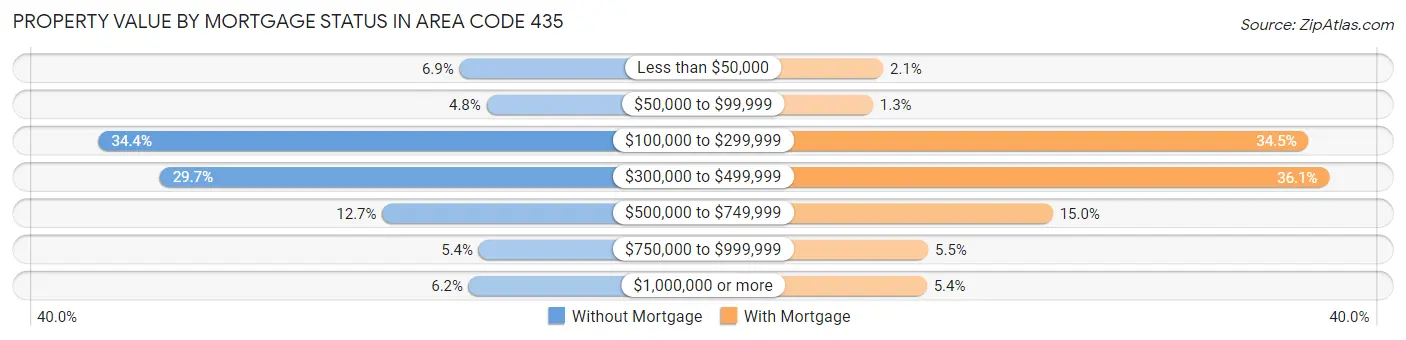
| Property Value | Without Mortgage | With Mortgage |
| Less than $50,000 | 4,894 (6.9%) | 2,545 (2.1%) |
| $50,000 to $99,999 | 3,420 (4.8%) | 1,599 (1.3%) |
| $100,000 to $299,999 | 24,503 (34.4%) | 41,767 (34.5%) |
| $300,000 to $499,999 | 21,177 (29.7%) | 43,690 (36.1%) |
| $500,000 to $749,999 | 9,084 (12.7%) | 18,172 (15.0%) |
| $750,000 to $999,999 | 3,844 (5.4%) | 6,695 (5.5%) |
| $1,000,000 or more | 4,387 (6.1%) | 6,554 (5.4%) |
| Total | 71,309 (100.0%) | 121,022 (100.0%) |
Household Income by Mortgage Status in Area Code 435
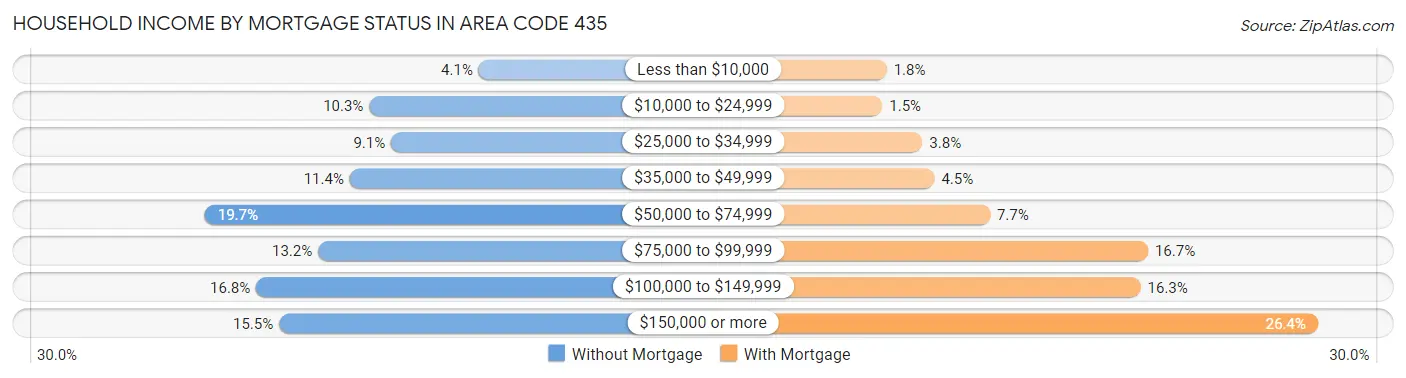
| Household Income | Without Mortgage | With Mortgage |
| Less than $10,000 | 2,885 (4.1%) | 2,159 (1.8%) |
| $10,000 to $24,999 | 7,354 (10.3%) | 1,847 (1.5%) |
| $25,000 to $34,999 | 6,461 (9.1%) | 4,624 (3.8%) |
| $35,000 to $49,999 | 8,146 (11.4%) | 5,457 (4.5%) |
| $50,000 to $74,999 | 14,046 (19.7%) | 9,291 (7.7%) |
| $75,000 to $99,999 | 9,435 (13.2%) | 20,223 (16.7%) |
| $100,000 to $149,999 | 11,956 (16.8%) | 19,712 (16.3%) |
| $150,000 or more | 11,026 (15.5%) | 31,956 (26.4%) |
| Total | 71,309 (100.0%) | 121,022 (100.0%) |
Property Value to Household Income Ratio in Area Code 435
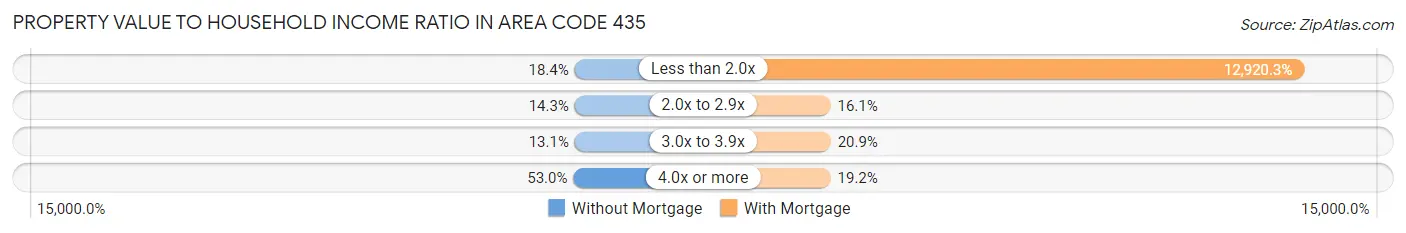
| Value-to-Income Ratio | Without Mortgage | With Mortgage |
| Less than 2.0x | 13,140 (18.4%) | 15,636,439 (12,920.3%) |
| 2.0x to 2.9x | 10,179 (14.3%) | 19,509 (16.1%) |
| 3.0x to 3.9x | 9,372 (13.1%) | 25,339 (20.9%) |
| 4.0x or more | 37,808 (53.0%) | 23,215 (19.2%) |
| Total | 71,309 (100.0%) | 121,022 (100.0%) |
Real Estate Taxes by Mortgage Status in Area Code 435
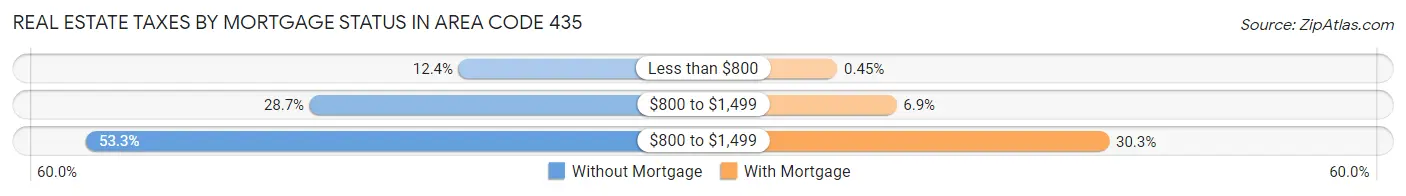
| Property Taxes | Without Mortgage | With Mortgage |
| Less than $800 | 8,850 (12.4%) | 539 (0.4%) |
| $800 to $1,499 | 20,487 (28.7%) | 8,396 (6.9%) |
| $800 to $1,499 | 37,978 (53.3%) | 36,605 (30.2%) |
| Total | 71,309 (100.0%) | 121,022 (100.0%) |
Health & Disability in Area Code 435
Health Insurance Coverage by Age in Area Code 435
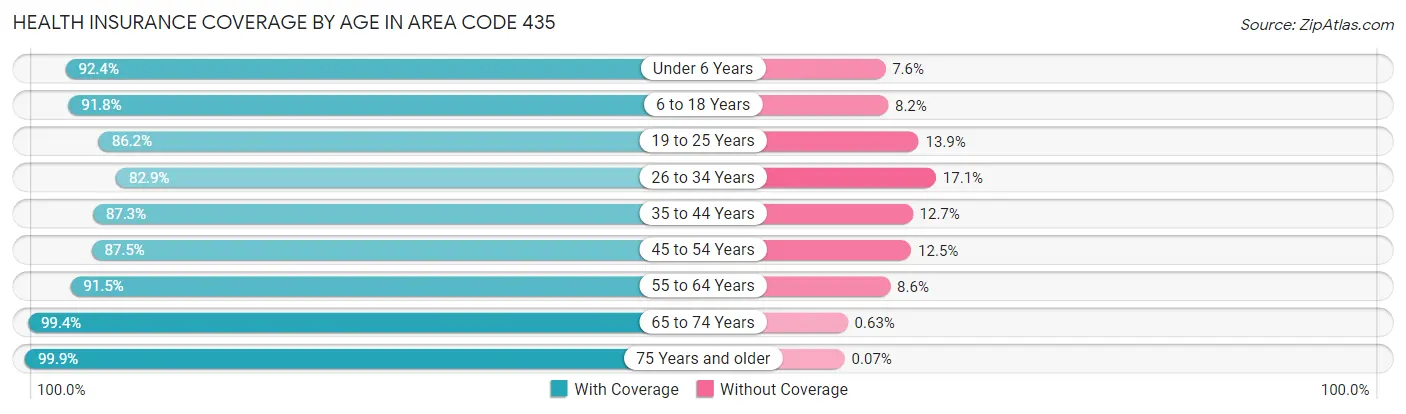
| Age Bracket | With Coverage | Without Coverage |
| Under 6 Years | 61,805 (92.4%) | 5,102 (7.6%) |
| 6 to 18 Years | 157,337 (91.8%) | 13,985 (8.2%) |
| 19 to 25 Years | 73,793 (86.2%) | 11,867 (13.9%) |
| 26 to 34 Years | 71,900 (82.9%) | 14,805 (17.1%) |
| 35 to 44 Years | 87,153 (87.3%) | 12,726 (12.7%) |
| 45 to 54 Years | 70,809 (87.5%) | 10,090 (12.5%) |
| 55 to 64 Years | 74,343 (91.4%) | 6,949 (8.6%) |
| 65 to 74 Years | 69,443 (99.4%) | 437 (0.6%) |
| 75 Years and older | 46,513 (99.9%) | 33 (0.1%) |
| Total | 713,096 (90.4%) | 75,994 (9.6%) |
Health Insurance Coverage by Citizenship Status in Area Code 435
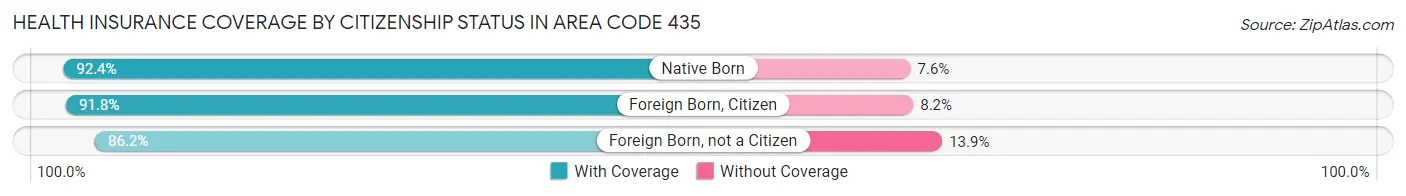
| Citizenship Status | With Coverage | Without Coverage |
| Native Born | 61,805 (92.4%) | 5,102 (7.6%) |
| Foreign Born, Citizen | 157,337 (91.8%) | 13,985 (8.2%) |
| Foreign Born, not a Citizen | 73,793 (86.2%) | 11,867 (13.9%) |
Health Insurance Coverage by Household Income in Area Code 435
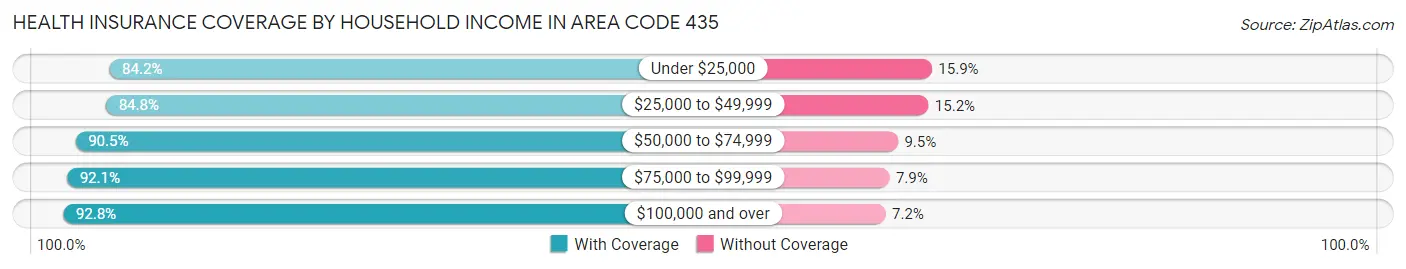
| Household Income | With Coverage | Without Coverage |
| Under $25,000 | 50,530 (84.2%) | 9,517 (15.9%) |
| $25,000 to $49,999 | 101,944 (84.8%) | 18,273 (15.2%) |
| $50,000 to $74,999 | 124,233 (90.5%) | 13,027 (9.5%) |
| $75,000 to $99,999 | 109,886 (92.1%) | 9,424 (7.9%) |
| $100,000 and over | 320,968 (92.8%) | 24,839 (7.2%) |
Public vs Private Health Insurance Coverage by Age in Area Code 435
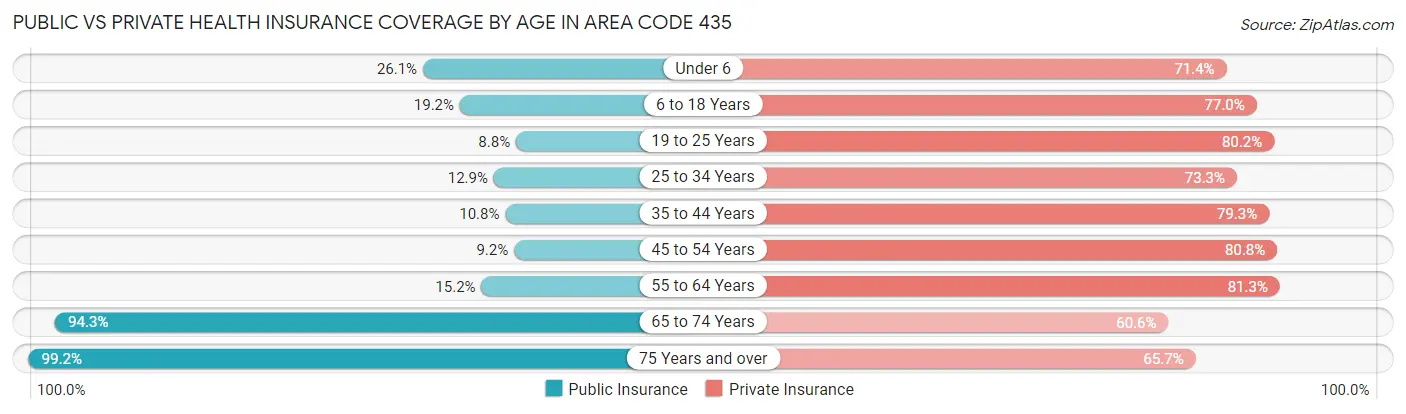
| Age Bracket | Public Insurance | Private Insurance |
| Under 6 | 17,436 (26.1%) | 47,768 (71.4%) |
| 6 to 18 Years | 32,907 (19.2%) | 131,897 (77.0%) |
| 19 to 25 Years | 7,532 (8.8%) | 68,727 (80.2%) |
| 25 to 34 Years | 11,190 (12.9%) | 63,569 (73.3%) |
| 35 to 44 Years | 10,758 (10.8%) | 79,197 (79.3%) |
| 45 to 54 Years | 7,401 (9.1%) | 65,364 (80.8%) |
| 55 to 64 Years | 12,362 (15.2%) | 66,077 (81.3%) |
| 65 to 74 Years | 65,920 (94.3%) | 42,347 (60.6%) |
| 75 Years and over | 46,191 (99.2%) | 30,559 (65.6%) |
| Total | 211,697 (26.8%) | 595,505 (75.5%) |
Disability Status by Sex by Age in Area Code 435
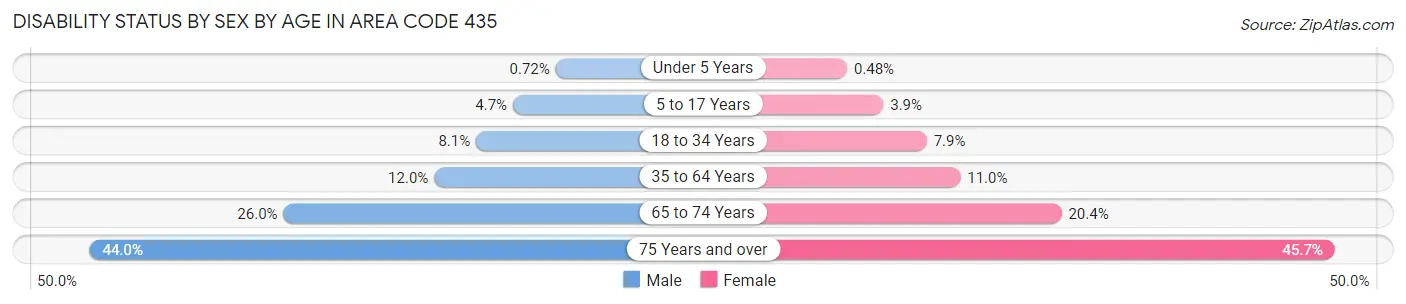
| Age Bracket | Male | Female |
| Under 5 Years | 202 (0.7%) | 127 (0.5%) |
| 5 to 17 Years | 4,071 (4.7%) | 3,138 (3.8%) |
| 18 to 34 Years | 7,666 (8.1%) | 7,318 (7.9%) |
| 35 to 64 Years | 15,760 (12.0%) | 14,369 (11.0%) |
| 65 to 74 Years | 8,975 (26.0%) | 7,204 (20.4%) |
| 75 Years and over | 9,781 (44.0%) | 11,115 (45.7%) |
Disability Class by Sex by Age in Area Code 435
Disability Class: Hearing Difficulty
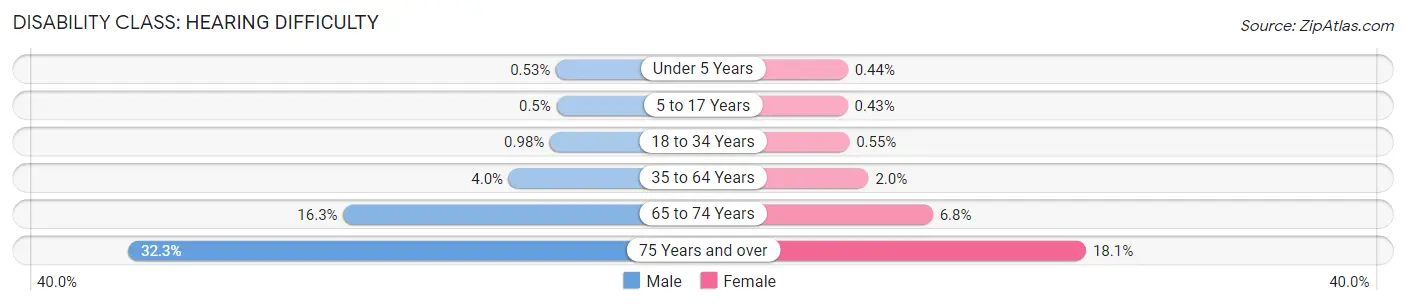
| Age Bracket | Male | Female |
| Under 5 Years | 150 (0.5%) | 116 (0.4%) |
| 5 to 17 Years | 432 (0.5%) | 350 (0.4%) |
| 18 to 34 Years | 928 (1.0%) | 507 (0.5%) |
| 35 to 64 Years | 5,309 (4.0%) | 2,593 (2.0%) |
| 65 to 74 Years | 5,640 (16.3%) | 2,385 (6.8%) |
| 75 Years and over | 7,188 (32.3%) | 4,407 (18.1%) |
Disability Class: Vision Difficulty
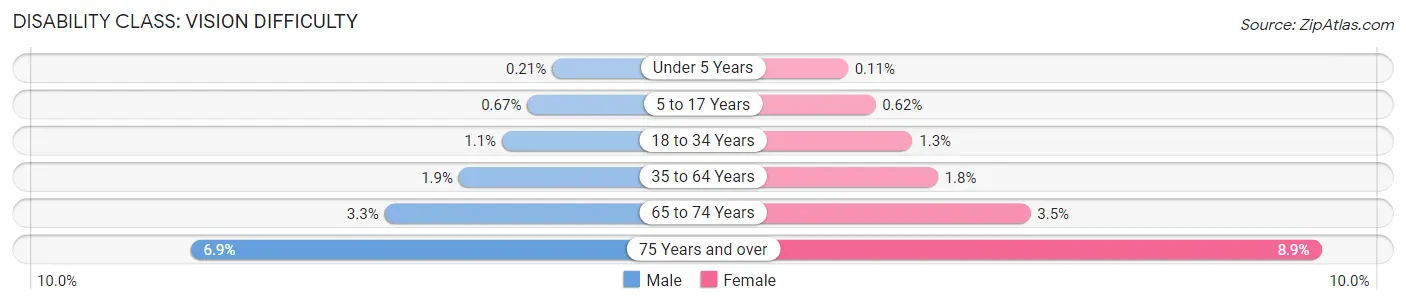
| Age Bracket | Male | Female |
| Under 5 Years | 58 (0.2%) | 29 (0.1%) |
| 5 to 17 Years | 580 (0.7%) | 505 (0.6%) |
| 18 to 34 Years | 1,080 (1.1%) | 1,220 (1.3%) |
| 35 to 64 Years | 2,551 (1.9%) | 2,329 (1.8%) |
| 65 to 74 Years | 1,147 (3.3%) | 1,238 (3.5%) |
| 75 Years and over | 1,540 (6.9%) | 2,163 (8.9%) |
Disability Class: Cognitive Difficulty
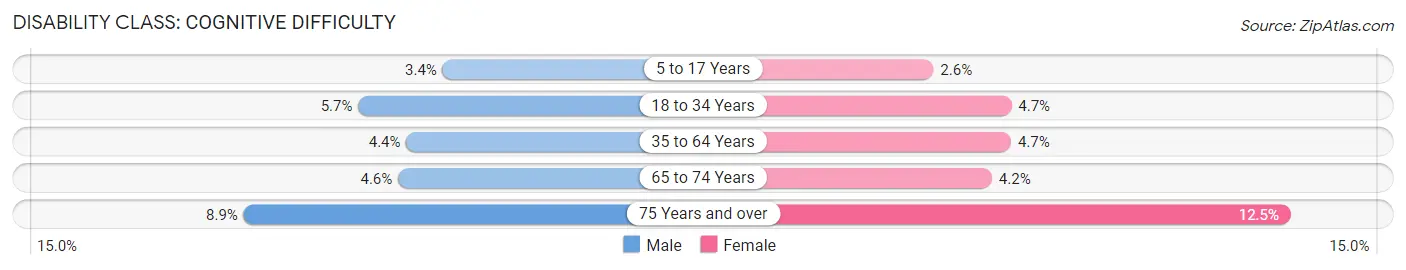
| Age Bracket | Male | Female |
| 5 to 17 Years | 2,923 (3.4%) | 2,080 (2.5%) |
| 18 to 34 Years | 5,404 (5.7%) | 4,382 (4.7%) |
| 35 to 64 Years | 5,741 (4.4%) | 6,148 (4.7%) |
| 65 to 74 Years | 1,589 (4.6%) | 1,476 (4.2%) |
| 75 Years and over | 1,979 (8.9%) | 3,038 (12.5%) |
Disability Class: Ambulatory Difficulty
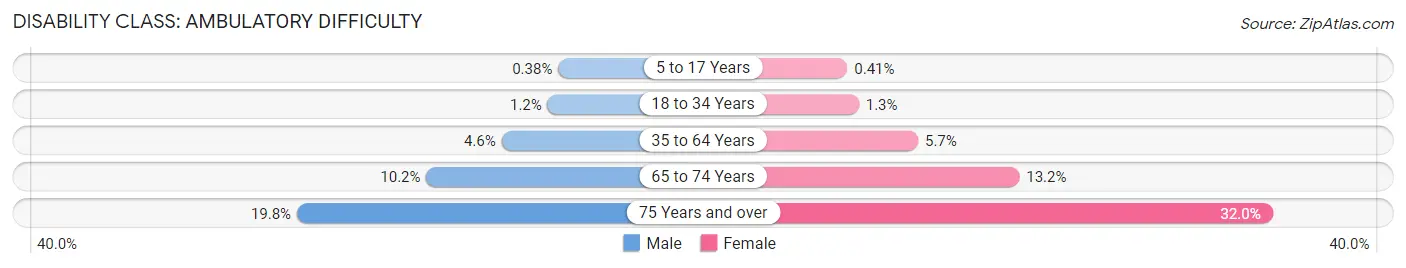
| Age Bracket | Male | Female |
| 5 to 17 Years | 330 (0.4%) | 333 (0.4%) |
| 18 to 34 Years | 1,105 (1.2%) | 1,169 (1.3%) |
| 35 to 64 Years | 6,032 (4.6%) | 7,396 (5.7%) |
| 65 to 74 Years | 3,512 (10.2%) | 4,658 (13.2%) |
| 75 Years and over | 4,399 (19.8%) | 7,771 (32.0%) |
Disability Class: Self-Care Difficulty
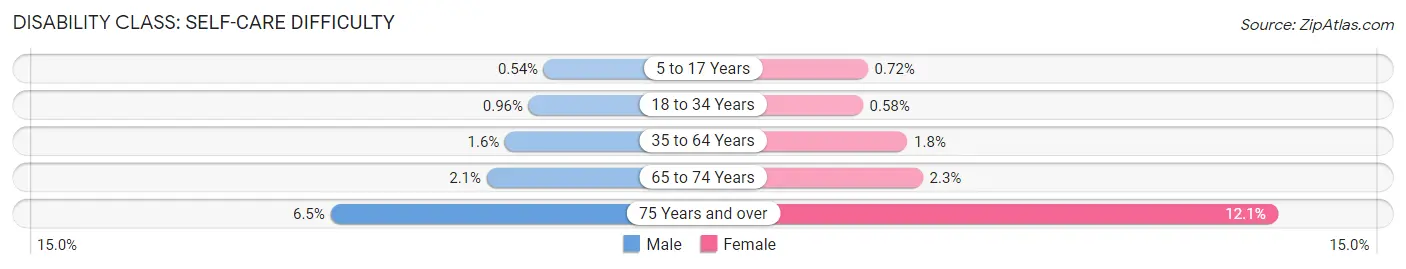
| Age Bracket | Male | Female |
| 5 to 17 Years | 473 (0.5%) | 591 (0.7%) |
| 18 to 34 Years | 910 (1.0%) | 543 (0.6%) |
| 35 to 64 Years | 2,129 (1.6%) | 2,381 (1.8%) |
| 65 to 74 Years | 737 (2.1%) | 795 (2.2%) |
| 75 Years and over | 1,441 (6.5%) | 2,948 (12.1%) |
Technology Access in Area Code 435
Computing Device Access in Area Code 435
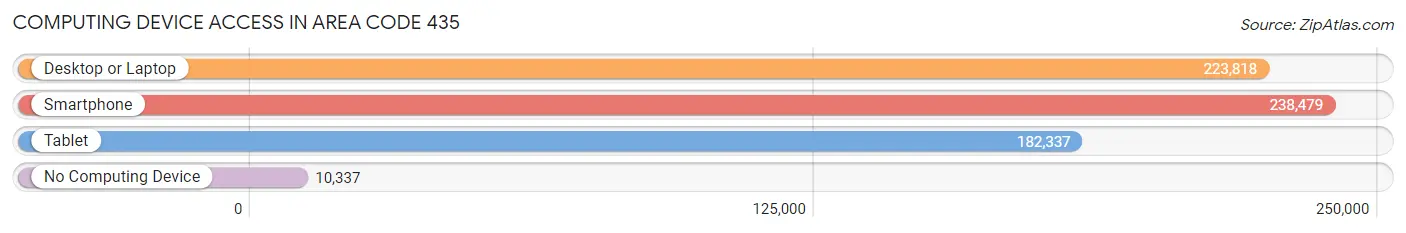
| Device Type | # Households | % Households |
| Desktop or Laptop | 223,818 | 85.5% |
| Smartphone | 238,479 | 91.1% |
| Tablet | 182,337 | 69.6% |
| No Computing Device | 10,337 | 4.0% |
| Total | 261,872 | 100.0% |
Internet Access in Area Code 435
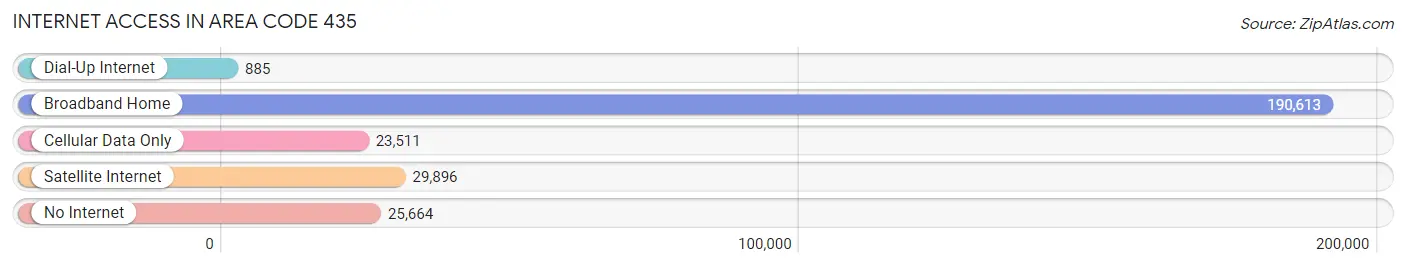
| Internet Type | # Households | % Households |
| Dial-Up Internet | 885 | 0.3% |
| Broadband Home | 190,613 | 72.8% |
| Cellular Data Only | 23,511 | 9.0% |
| Satellite Internet | 29,896 | 11.4% |
| No Internet | 25,664 | 9.8% |
| Total | 261,872 | 100.0% |
Area Code 435 Summary
Geography
Area code 435 is located in the state of Utah. It covers the southeastern portion of the state, including the cities of St. George, Cedar City, Logan, and Park City.
Social
Area code 435 is home to a variety of cultures and lifestyles. The area is known for its outdoor recreation opportunities, including skiing, hiking, and camping. It is also home to several universities and colleges, including Utah State University and Southern Utah University.
Economics
Area code 435 is a major economic hub in Utah. It is home to several large companies, including Intermountain Healthcare, Smith's Food and Drug, and Zions Bank. The area also has a thriving tourism industry, with many visitors coming to enjoy the outdoor recreation opportunities.
Demographics
Area code 435 is home to a diverse population. According to the U.S. Census Bureau, the population of the area is approximately 590,000. The median age is 30.7 years, and the median household income is $60,000. The area is predominantly white, with a large Hispanic population.
Common Questions
What is Per Capita Income in Area Code 435?
Per Capita income in Area Code 435 is $31,989.
What is the Median Family Income in Area Code 435?
Median Family Income in Area Code 435 is $86,021.
What is the Median Household income in Area Code 435?
Median Household Income in Area Code 435 is $72,937.
What is Income or Wage Gap in Area Code 435?
Income or Wage Gap in Area Code 435 is 47.7%.
Women in Area Code 435 earn 52.3 cents for every dollar earned by a man.
What is Family Income Deficit in Area Code 435?
Family Income Deficit in Area Code 435 is $11,415.
Families that are below poverty line in Area Code 435 earn $11,415 less on average than the poverty threshold level.
What is Inequality or Gini Index in Area Code 435?
Inequality or Gini Index in Area Code 435 is 77.12.
What is the Total Population of Area Code 435?
Total Population of Area Code 435 is 797,397.
What is the Total Male Population of Area Code 435?
Total Male Population of Area Code 435 is 404,211.
What is the Total Female Population of Area Code 435?
Total Female Population of Area Code 435 is 393,186.
What is the Ratio of Males per 100 Females in Area Code 435?
There are 102.80 Males per 100 Females in Area Code 435.
What is the Ratio of Females per 100 Males in Area Code 435?
There are 97.27 Females per 100 Males in Area Code 435.
What is the Median Population Age in Area Code 435?
Median Population Age in Area Code 435 is 39.0 Years.
What is the Average Family Size in Area Code 435
Average Family Size in Area Code 435 is 3.5 People.
What is the Average Household Size in Area Code 435
Average Household Size in Area Code 435 is 3.0 People.
How Large is the Labor Force in Area Code 435?
There are 353,348 People in the Labor Forcein in Area Code 435.
What is the Percentage of People in the Labor Force in Area Code 435?
58.9% of People are in the Labor Force in Area Code 435.
What is the Unemployment Rate in Area Code 435?
Unemployment Rate in Area Code 435 is 5.6%.