Area Code 385 Map & Demographics
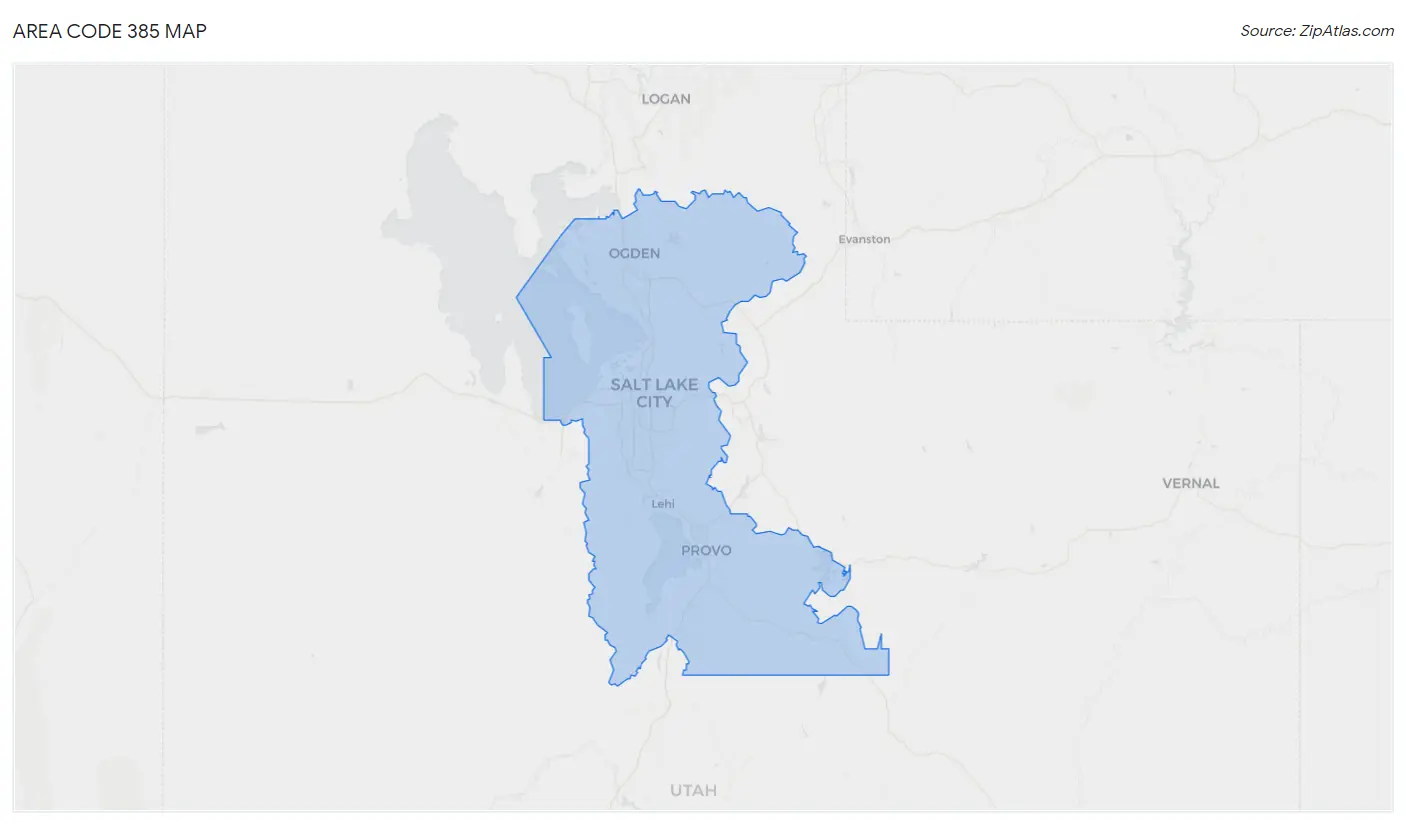
Area Code 385 Map
Area Code 385 Overview
$36,322
PER CAPITA INCOME
$100,640
AVG FAMILY INCOME
$87,737
AVG HOUSEHOLD INCOME
39.5%
WAGE / INCOME GAP [ % ]
60.5¢/ $1
WAGE / INCOME GAP [ $ ]
$10,800
FAMILY INCOME DEFICIT
14.21
INEQUALITY / GINI INDEX
1,323,881
TOTAL POPULATION
673,090
MALE POPULATION
650,791
FEMALE POPULATION
103.43
MALES / 100 FEMALES
96.69
FEMALES / 100 MALES
30.4
MEDIAN AGE
3.5
AVG FAMILY SIZE
3.1
AVG HOUSEHOLD SIZE
690,812
LABOR FORCE [ PEOPLE ]
70.7%
PERCENT IN LABOR FORCE
3.8%
UNEMPLOYMENT RATE
Income in Area Code 385
Income Overview in Area Code 385
Per Capita Income in Area Code 385 is $36,322, while median incomes of families and households are $100,640 and $87,737 respectively.
| Characteristic | Number | Measure |
| Per Capita Income | 1,323,881 | $36,322 |
| Median Family Income | 303,657 | $100,640 |
| Mean Family Income | 303,657 | $4,253,819 |
| Median Household Income | 420,429 | $87,737 |
| Mean Household Income | 420,429 | $3,771,671 |
| Income Deficit | 303,657 | $10,800 |
| Wage / Income Gap (%) | 1,323,881 | 39.51% |
| Wage / Income Gap ($) | 1,323,881 | 60.49¢ per $1 |
| Gini / Inequality Index | 1,323,881 | 14.21 |
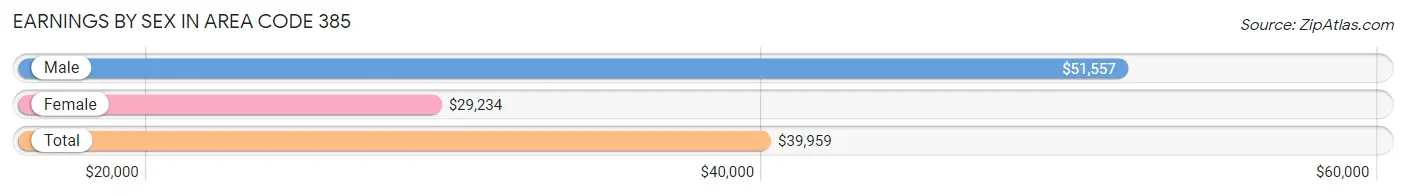
Earnings by Sex in Area Code 385
Average Earnings in Area Code 385 are $39,959, $51,557 for men and $29,234 for women, a difference of 43.3%.
| Sex | Number | Average Earnings |
| Male | 407,332 (55.4%) | $51,557 |
| Female | 327,824 (44.6%) | $29,234 |
| Total | 735,156 (100.0%) | $39,959 |
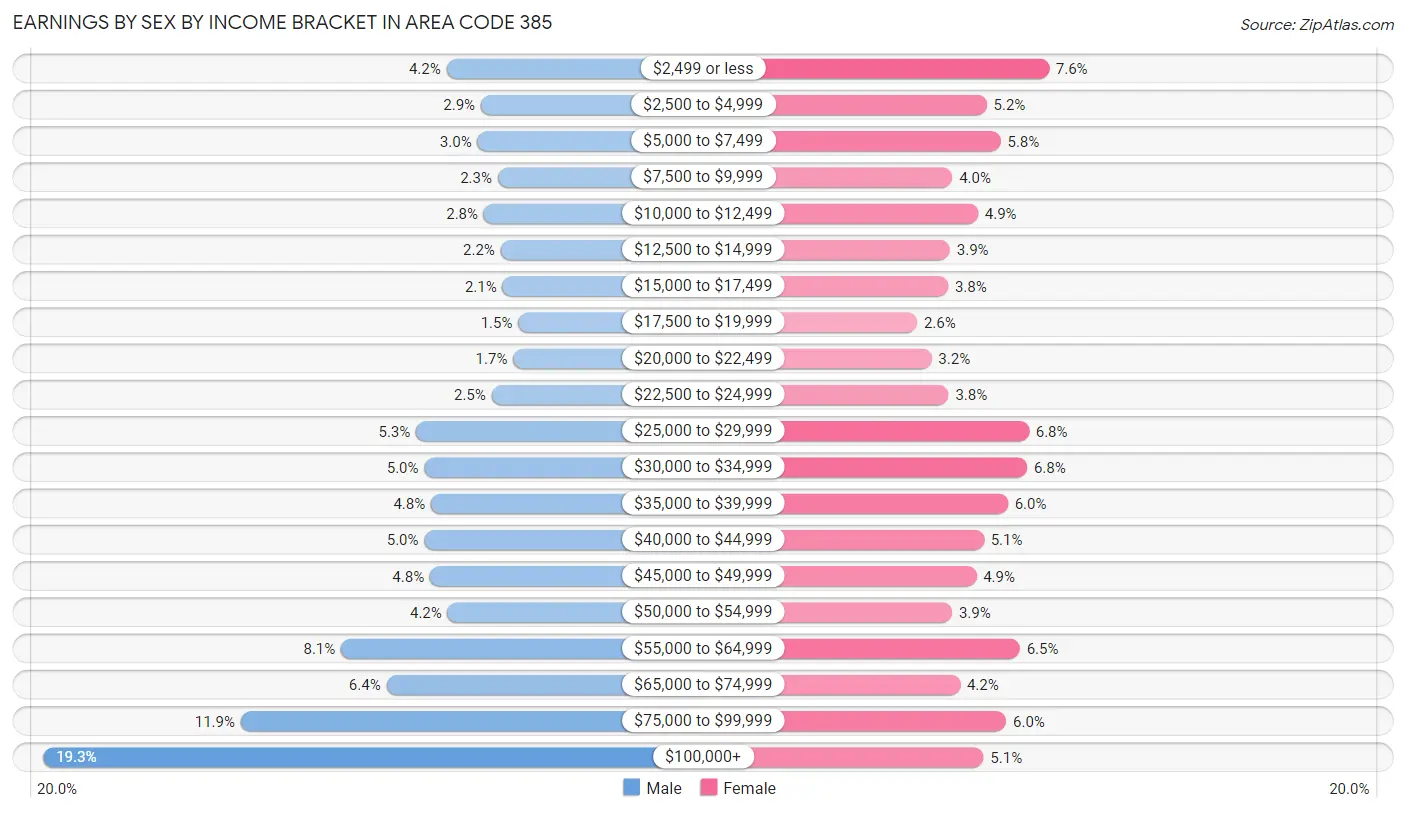
Earnings by Sex by Income Bracket in Area Code 385
The most common earnings brackets in Area Code 385 are $100,000+ for men (78,599 | 19.3%) and $2,499 or less for women (24,814 | 7.6%).
| Income | Male | Female |
| $2,499 or less | 17,056 (4.2%) | 24,814 (7.6%) |
| $2,500 to $4,999 | 11,821 (2.9%) | 17,166 (5.2%) |
| $5,000 to $7,499 | 12,323 (3.0%) | 18,875 (5.8%) |
| $7,500 to $9,999 | 9,261 (2.3%) | 12,937 (4.0%) |
| $10,000 to $12,499 | 11,384 (2.8%) | 16,080 (4.9%) |
| $12,500 to $14,999 | 8,786 (2.2%) | 12,644 (3.9%) |
| $15,000 to $17,499 | 8,527 (2.1%) | 12,423 (3.8%) |
| $17,500 to $19,999 | 6,126 (1.5%) | 8,607 (2.6%) |
| $20,000 to $22,499 | 6,878 (1.7%) | 10,397 (3.2%) |
| $22,500 to $24,999 | 10,173 (2.5%) | 12,487 (3.8%) |
| $25,000 to $29,999 | 21,692 (5.3%) | 22,371 (6.8%) |
| $30,000 to $34,999 | 20,449 (5.0%) | 22,132 (6.8%) |
| $35,000 to $39,999 | 19,440 (4.8%) | 19,760 (6.0%) |
| $40,000 to $44,999 | 20,449 (5.0%) | 16,804 (5.1%) |
| $45,000 to $49,999 | 19,587 (4.8%) | 15,914 (4.9%) |
| $50,000 to $54,999 | 16,902 (4.2%) | 12,917 (3.9%) |
| $55,000 to $64,999 | 33,161 (8.1%) | 21,229 (6.5%) |
| $65,000 to $74,999 | 26,241 (6.4%) | 13,906 (4.2%) |
| $75,000 to $99,999 | 48,477 (11.9%) | 19,570 (6.0%) |
| $100,000+ | 78,599 (19.3%) | 16,791 (5.1%) |
| Total | 407,332 (100.0%) | 327,824 (100.0%) |
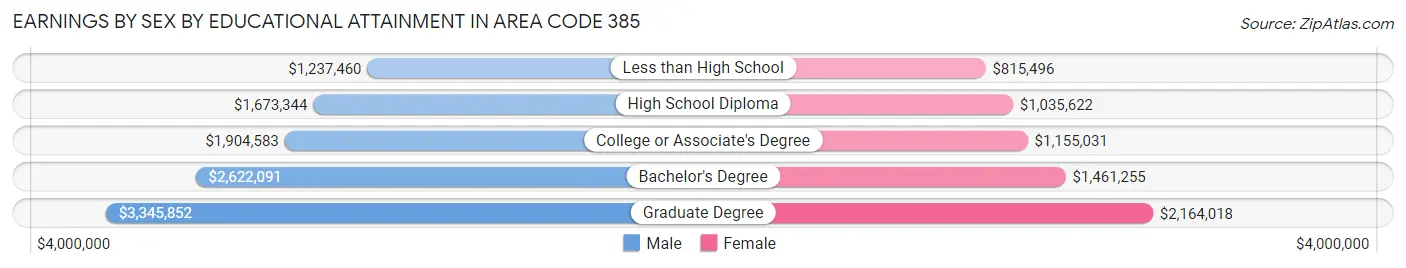
Earnings by Sex by Educational Attainment in Area Code 385
Average earnings in Area Code 385 are $2,167,488 for men and $1,296,009 for women, a difference of 40.2%. Men with an educational attainment of graduate degree enjoy the highest average annual earnings of $3,345,852, while those with less than high school education earn the least with $1,237,460. Women with an educational attainment of graduate degree earn the most with the average annual earnings of $2,164,018, while those with less than high school education have the smallest earnings of $815,496.
| Educational Attainment | Male Income | Female Income |
| Less than High School | $1,237,460 | $815,496 |
| High School Diploma | $1,673,344 | $1,035,622 |
| College or Associate's Degree | $1,904,583 | $1,155,031 |
| Bachelor's Degree | $2,622,091 | $1,461,255 |
| Graduate Degree | $3,345,852 | $2,164,018 |
| Total | $2,167,488 | $1,296,009 |
Family Income in Area Code 385
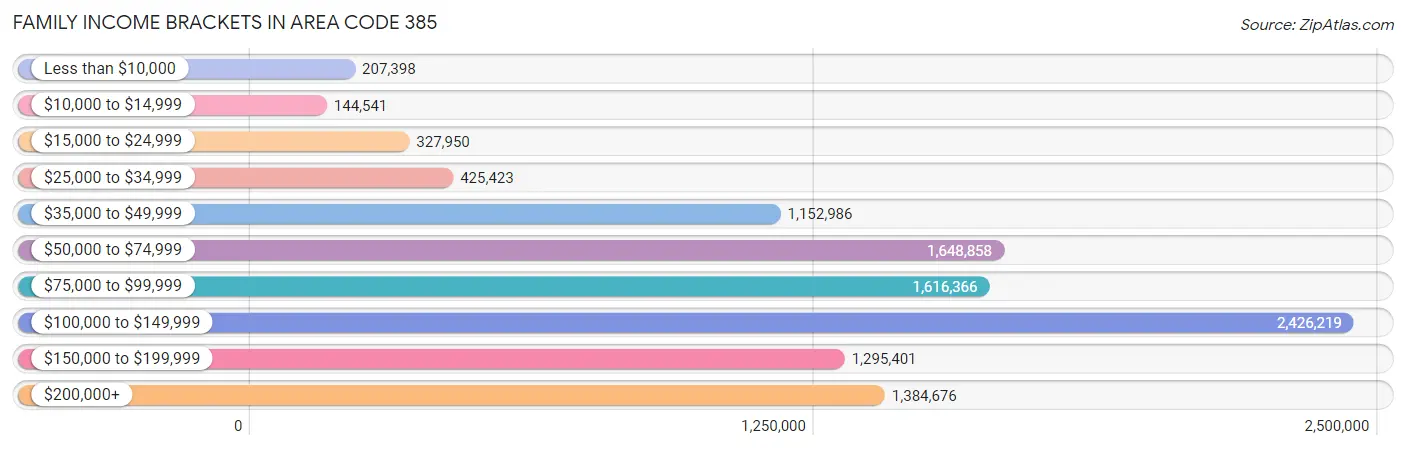
Family Income Brackets in Area Code 385
According to the Area Code 385 family income data, there are 2,426,219 families falling into the $100,000 to $149,999 income range, which is the most common income bracket and makes up 799.0% of all families. Conversely, the $10,000 to $14,999 income bracket is the least frequent group with only 144,541 families (47.6%) belonging to this category.
| Income Bracket | # Families | % Families |
| Less than $10,000 | 207,398 | 68.3% |
| $10,000 to $14,999 | 144,541 | 47.6% |
| $15,000 to $24,999 | 327,950 | 108.0% |
| $25,000 to $34,999 | 425,423 | 140.1% |
| $35,000 to $49,999 | 1,152,986 | 379.7% |
| $50,000 to $74,999 | 1,648,858 | 543.0% |
| $75,000 to $99,999 | 1,616,366 | 532.3% |
| $100,000 to $149,999 | 2,426,219 | 799.0% |
| $150,000 to $199,999 | 1,295,401 | 426.6% |
| $200,000+ | 1,384,676 | 456.0% |
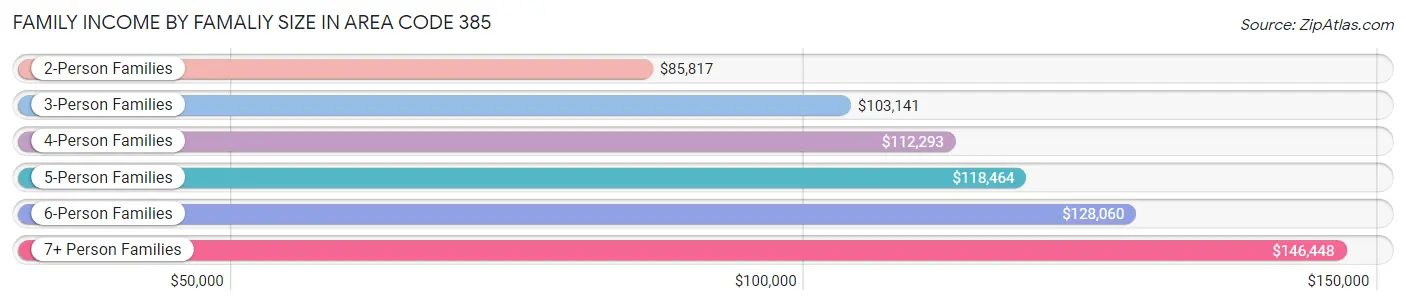
Family Income by Famaliy Size in Area Code 385
7+ person families (15,366 | 5.1%) account for the highest median family income in Area Code 385 with $146,448 per family, while 2-person families (111,402 | 36.7%) have the highest median income of $42,908 per family member.
| Income Bracket | # Families | Median Income |
| 2-Person Families | 111,402 (36.7%) | $85,817 |
| 3-Person Families | 57,007 (18.8%) | $103,141 |
| 4-Person Families | 56,375 (18.6%) | $112,293 |
| 5-Person Families | 39,313 (13.0%) | $118,464 |
| 6-Person Families | 24,194 (8.0%) | $128,060 |
| 7+ Person Families | 15,366 (5.1%) | $146,448 |
| Total | 303,657 (100.0%) | $100,640 |
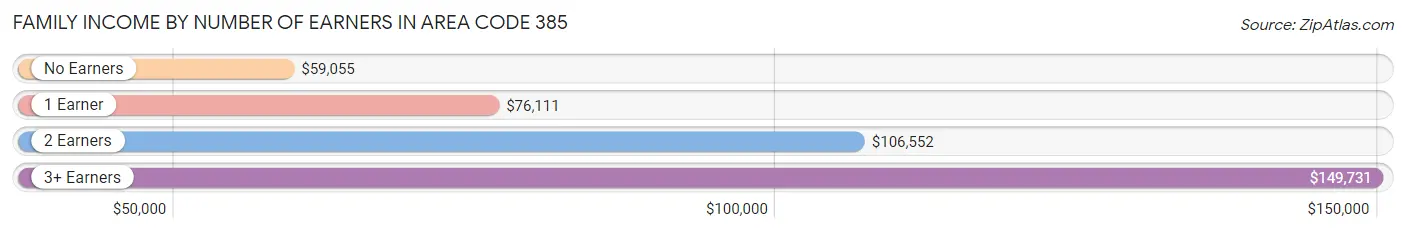
Family Income by Number of Earners in Area Code 385
The median family income in Area Code 385 is $100,640, with families comprising 3+ earners (56,659) having the highest median family income of $149,731, while families with no earners (25,362) have the lowest median family income of $59,055, accounting for 18.7% and 8.4% of families, respectively.
| Number of Earners | # Families | Median Income |
| No Earners | 25,362 (8.4%) | $59,055 |
| 1 Earner | 84,507 (27.8%) | $76,111 |
| 2 Earners | 137,129 (45.2%) | $106,552 |
| 3+ Earners | 56,659 (18.7%) | $149,731 |
| Total | 303,657 (100.0%) | $100,640 |
Household Income in Area Code 385
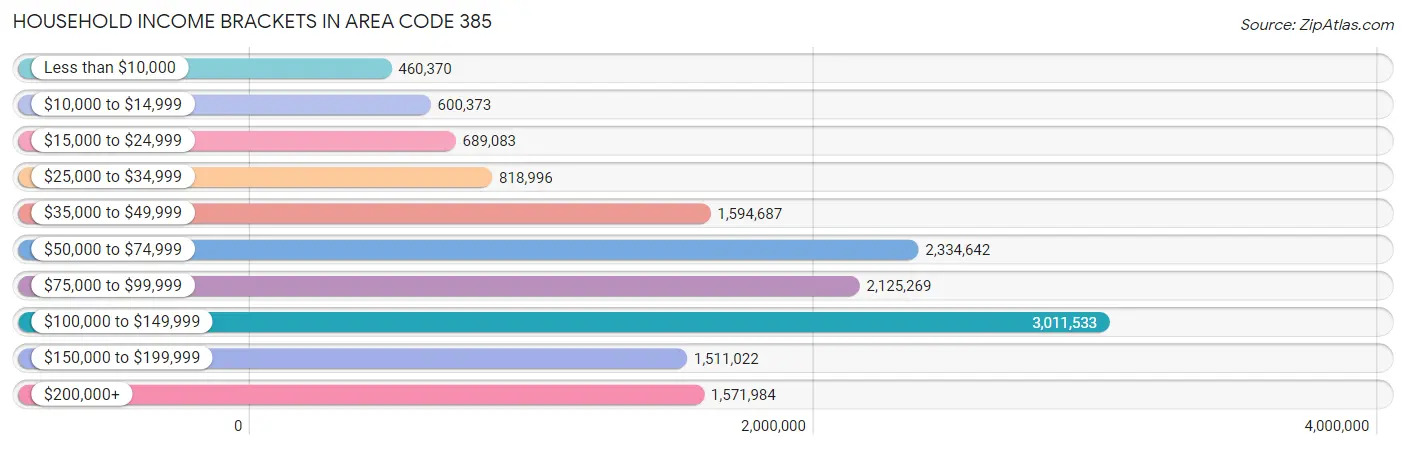
Household Income Brackets in Area Code 385
With 3,011,533 households falling in the category, the $100,000 to $149,999 income range is the most frequent in Area Code 385, accounting for 716.3% of all households. In contrast, only 460,370 households (109.5%) fall into the less than $10,000 income bracket, making it the least populous group.
| Income Bracket | # Households | % Households |
| Less than $10,000 | 460,370 | 109.5% |
| $10,000 to $14,999 | 600,373 | 142.8% |
| $15,000 to $24,999 | 689,083 | 163.9% |
| $25,000 to $34,999 | 818,996 | 194.8% |
| $35,000 to $49,999 | 1,594,687 | 379.3% |
| $50,000 to $74,999 | 2,334,642 | 555.3% |
| $75,000 to $99,999 | 2,125,269 | 505.5% |
| $100,000 to $149,999 | 3,011,533 | 716.3% |
| $150,000 to $199,999 | 1,511,022 | 359.4% |
| $200,000+ | 1,571,984 | 373.9% |
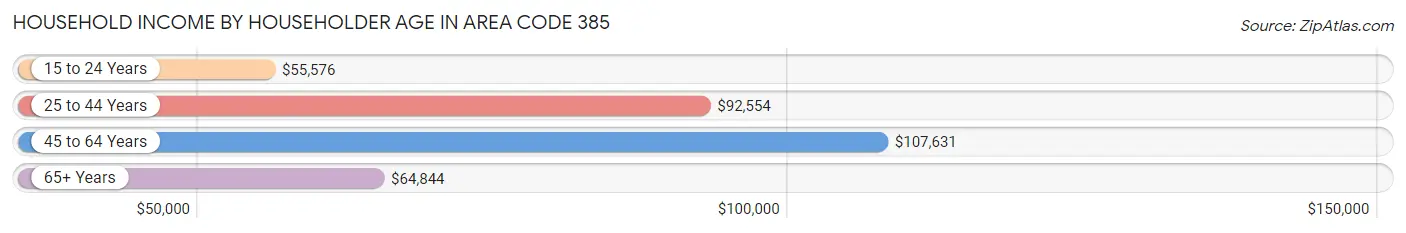
Household Income by Householder Age in Area Code 385
The median household income in Area Code 385 is $87,737, with the highest median household income of $107,631 found in the 45 to 64 years age bracket for the primary householder. A total of 132,078 households (31.4%) fall into this category. Meanwhile, the 15 to 24 years age bracket for the primary householder has the lowest median household income of $55,576, with 30,504 households (7.3%) in this group.
| Income Bracket | # Households | Median Income |
| 15 to 24 Years | 30,504 (7.3%) | $55,576 |
| 25 to 44 Years | 182,773 (43.5%) | $92,554 |
| 45 to 64 Years | 132,078 (31.4%) | $107,631 |
| 65+ Years | 75,074 (17.9%) | $64,844 |
| Total | 420,429 (100.0%) | $87,737 |
Poverty in Area Code 385
Income Below Poverty by Sex and Age in Area Code 385
With 8.2% poverty level for males and 9.7% for females among the residents of Area Code 385, 18 to 24 year old males and 18 to 24 year old females are the most vulnerable to poverty, with 13,025 males (16.3%) and 15,875 females (20.3%) in their respective age groups living below the poverty level.
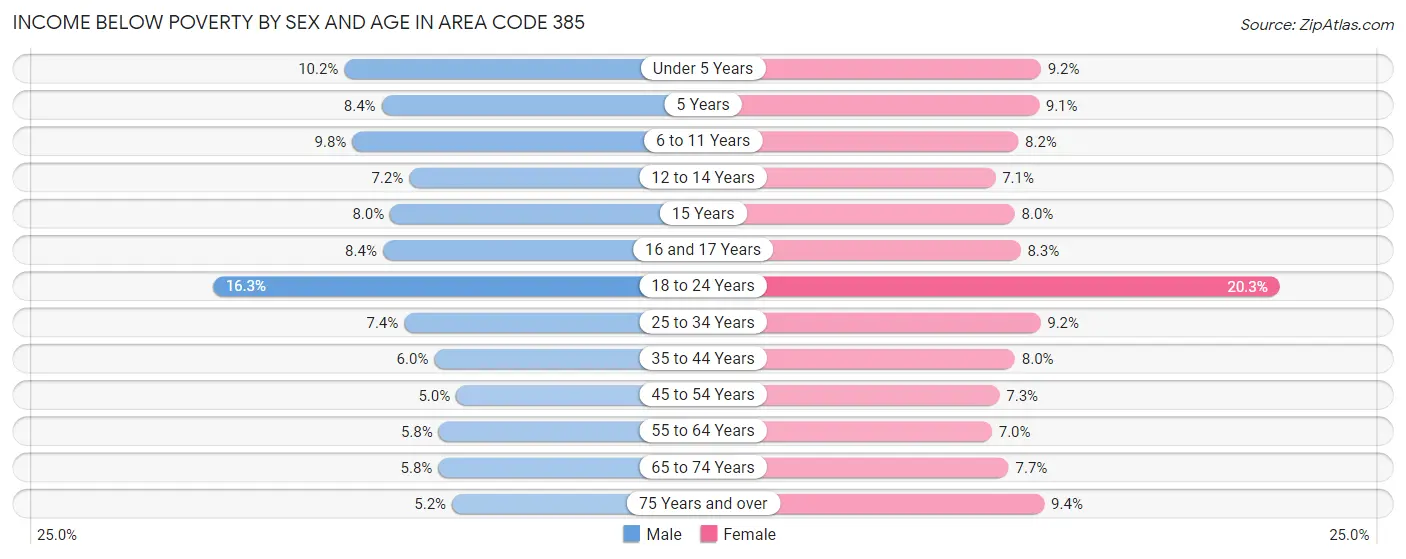
| Age Bracket | Male | Female |
| Under 5 Years | 5,402 (10.2%) | 4,594 (9.2%) |
| 5 Years | 946 (8.4%) | 921 (9.1%) |
| 6 to 11 Years | 6,673 (9.8%) | 5,211 (8.2%) |
| 12 to 14 Years | 2,355 (7.2%) | 2,204 (7.1%) |
| 15 Years | 943 (8.0%) | 868 (8.0%) |
| 16 and 17 Years | 1,808 (8.4%) | 1,706 (8.3%) |
| 18 to 24 Years | 13,025 (16.3%) | 15,875 (20.3%) |
| 25 to 34 Years | 7,760 (7.4%) | 9,187 (9.2%) |
| 35 to 44 Years | 5,696 (6.0%) | 7,167 (8.0%) |
| 45 to 54 Years | 3,497 (5.0%) | 4,743 (7.3%) |
| 55 to 64 Years | 3,264 (5.8%) | 3,856 (7.0%) |
| 65 to 74 Years | 2,110 (5.8%) | 2,976 (7.7%) |
| 75 Years and over | 1,003 (5.2%) | 2,593 (9.4%) |
| Total | 54,482 (8.2%) | 61,901 (9.7%) |
Income Above Poverty by Sex and Age in Area Code 385
According to the poverty statistics in Area Code 385, males aged 45 to 54 years and females aged 55 to 64 years are the age groups that are most secure financially, with 95.0% of males and 93.0% of females in these age groups living above the poverty line.
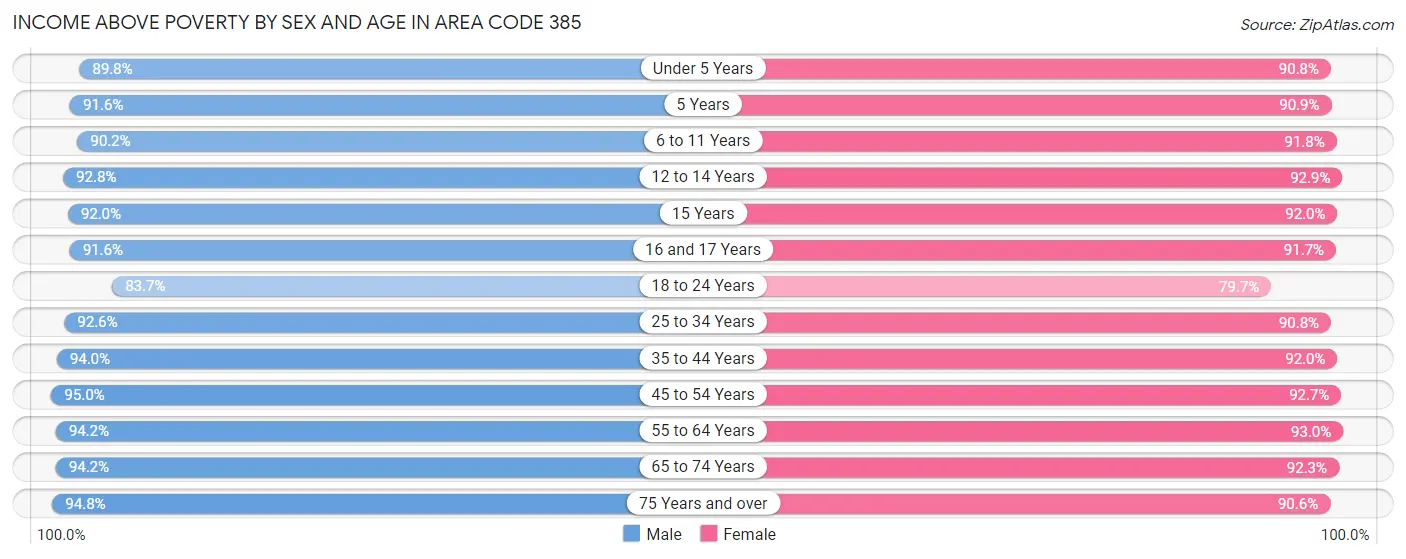
| Age Bracket | Male | Female |
| Under 5 Years | 47,689 (89.8%) | 45,152 (90.8%) |
| 5 Years | 10,264 (91.6%) | 9,154 (90.9%) |
| 6 to 11 Years | 61,397 (90.2%) | 58,516 (91.8%) |
| 12 to 14 Years | 30,526 (92.8%) | 28,736 (92.9%) |
| 15 Years | 10,784 (92.0%) | 9,959 (92.0%) |
| 16 and 17 Years | 19,762 (91.6%) | 18,875 (91.7%) |
| 18 to 24 Years | 67,050 (83.7%) | 62,301 (79.7%) |
| 25 to 34 Years | 97,200 (92.6%) | 90,562 (90.8%) |
| 35 to 44 Years | 89,358 (94.0%) | 82,079 (92.0%) |
| 45 to 54 Years | 66,744 (95.0%) | 60,159 (92.7%) |
| 55 to 64 Years | 53,093 (94.2%) | 51,524 (93.0%) |
| 65 to 74 Years | 34,195 (94.2%) | 35,478 (92.3%) |
| 75 Years and over | 18,380 (94.8%) | 25,022 (90.6%) |
| Total | 606,442 (91.8%) | 577,517 (90.3%) |
Income Below Poverty Among Married-Couple Families in Area Code 385
The poverty statistics for married-couple families in Area Code 385 show that 3.9% or 9,466 of the total 244,336 families live below the poverty line. Families with 5 or more children have the highest poverty rate of 7.5%, comprising of 596 families. On the other hand, families with no children have the lowest poverty rate of 3.3%, which includes 3,672 families.
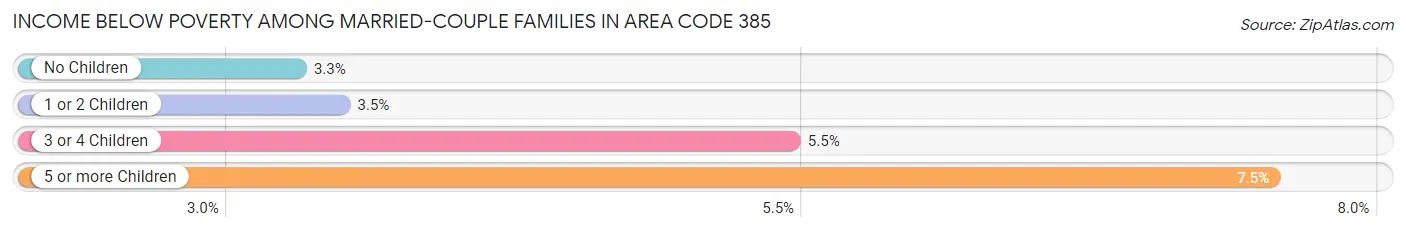
| Children | Above Poverty | Below Poverty |
| No Children | 107,498 (96.7%) | 3,672 (3.3%) |
| 1 or 2 Children | 80,063 (96.5%) | 2,893 (3.5%) |
| 3 or 4 Children | 40,005 (94.6%) | 2,305 (5.4%) |
| 5 or more Children | 7,304 (92.5%) | 596 (7.5%) |
| Total | 234,870 (96.1%) | 9,466 (3.9%) |
Income Below Poverty Among Single-Parent Households in Area Code 385
According to the poverty data in Area Code 385, 8.4% or 1,770 single-father households and 18.2% or 6,969 single-mother households are living below the poverty line. Among single-father households, those with 3 or 4 children have the highest poverty rate, with 338 households (14.0%) experiencing poverty. Likewise, among single-mother households, those with 5 or more children have the highest poverty rate, with 506 households (61.3%) falling below the poverty line.
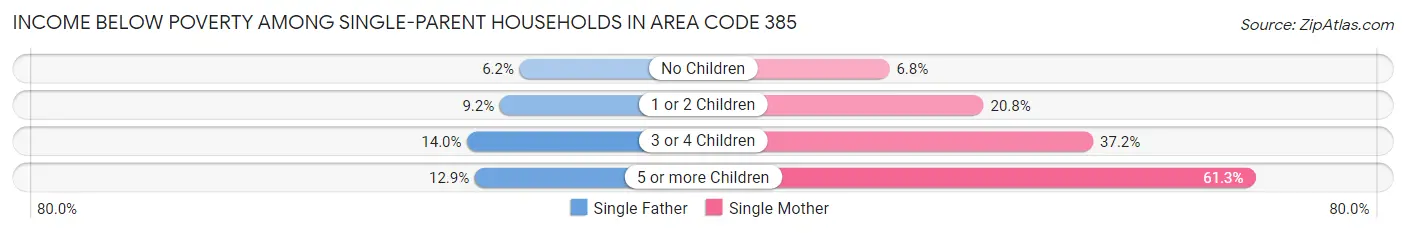
| Children | Single Father | Single Mother |
| No Children | 608 (6.2%) | 999 (6.8%) |
| 1 or 2 Children | 790 (9.1%) | 3,825 (20.8%) |
| 3 or 4 Children | 338 (14.0%) | 1,639 (37.2%) |
| 5 or more Children | 34 (12.9%) | 506 (61.3%) |
| Total | 1,770 (8.4%) | 6,969 (18.2%) |
Income Below Poverty Among Married-Couple vs Single-Parent Households in Area Code 385
The poverty data for Area Code 385 shows that 9,466 of the married-couple family households (3.9%) and 8,739 of the single-parent households (14.7%) are living below the poverty level. Within the married-couple family households, those with 5 or more children have the highest poverty rate, with 596 households (7.5%) falling below the poverty line. Among the single-parent households, those with 5 or more children have the highest poverty rate, with 540 household (49.6%) living below poverty.
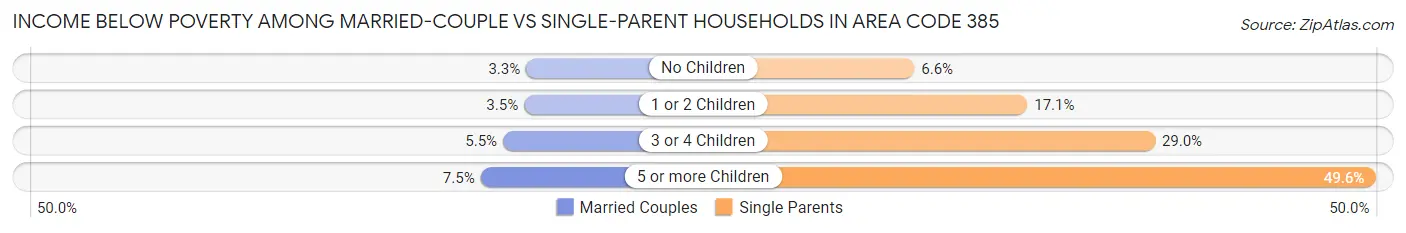
| Children | Married-Couple Families | Single-Parent Households |
| No Children | 3,672 (3.3%) | 1,607 (6.6%) |
| 1 or 2 Children | 2,893 (3.5%) | 4,615 (17.1%) |
| 3 or 4 Children | 2,305 (5.4%) | 1,977 (29.0%) |
| 5 or more Children | 596 (7.5%) | 540 (49.6%) |
| Total | 9,466 (3.9%) | 8,739 (14.7%) |
Race in Area Code 385
The most populous races in Area Code 385 are White / Caucasian (1,050,894 | 79.4%), Hispanic or Latino (232,101 | 17.5%), and Two or more Races (98,751 | 7.5%).
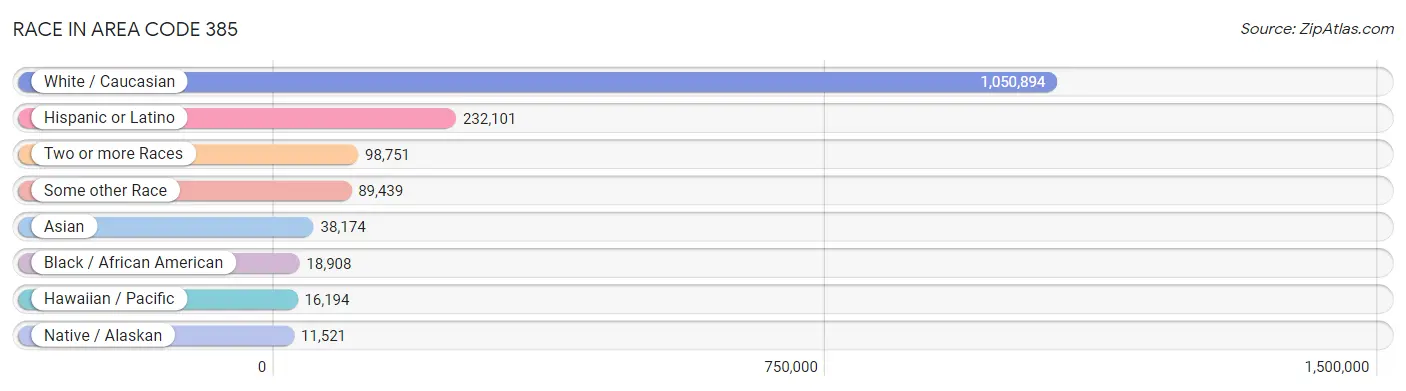
| Race | # Population | % Population |
| Asian | 38,174 | 2.9% |
| Black / African American | 18,908 | 1.4% |
| Hawaiian / Pacific | 16,194 | 1.2% |
| Hispanic or Latino | 232,101 | 17.5% |
| Native / Alaskan | 11,521 | 0.9% |
| White / Caucasian | 1,050,894 | 79.4% |
| Two or more Races | 98,751 | 7.5% |
| Some other Race | 89,439 | 6.8% |
| Total | 1,323,881 | 100.0% |
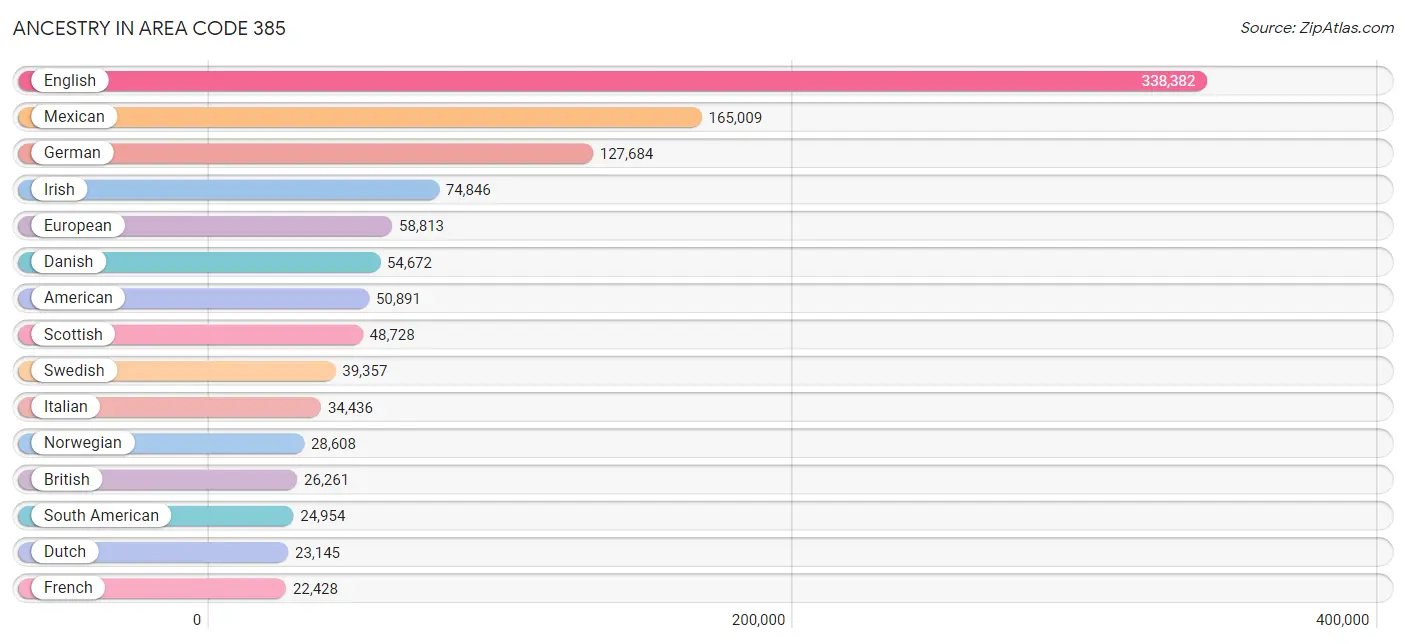
Ancestry in Area Code 385
The most populous ancestries reported in Area Code 385 are English (338,382 | 25.6%), Mexican (165,009 | 12.5%), German (127,684 | 9.6%), Irish (74,846 | 5.7%), and European (58,813 | 4.4%), together accounting for 57.8% of all Area Code 385 residents.
| Ancestry | # Population | % Population |
| Afghan | 178 | 0.0% |
| African | 3,392 | 0.3% |
| Alaska Native | 64 | 0.0% |
| Alaskan Athabascan | 27 | 0.0% |
| Albanian | 131 | 0.0% |
| Aleut | 21 | 0.0% |
| American | 50,891 | 3.8% |
| Apache | 744 | 0.1% |
| Arab | 4,103 | 0.3% |
| Arapaho | 181 | 0.0% |
| Argentinean | 2,939 | 0.2% |
| Armenian | 859 | 0.1% |
| Assyrian / Chaldean / Syriac | 6 | 0.0% |
| Australian | 653 | 0.1% |
| Austrian | 1,272 | 0.1% |
| Bahamian | 1 | 0.0% |
| Bangladeshi | 433 | 0.0% |
| Basque | 746 | 0.1% |
| Belgian | 1,037 | 0.1% |
| Belizean | 125 | 0.0% |
| Bermudan | 15 | 0.0% |
| Bhutanese | 9,782 | 0.7% |
| Blackfeet | 1,089 | 0.1% |
| Bolivian | 897 | 0.1% |
| Brazilian | 3,197 | 0.2% |
| British | 26,261 | 2.0% |
| Bulgarian | 60 | 0.0% |
| Burmese | 4,752 | 0.4% |
| Cajun | 244 | 0.0% |
| Cambodian | 270 | 0.0% |
| Canadian | 3,904 | 0.3% |
| Celtic | 133 | 0.0% |
| Central American | 14,871 | 1.1% |
| Central American Indian | 1,109 | 0.1% |
| Cherokee | 2,426 | 0.2% |
| Cheyenne | 139 | 0.0% |
| Chickasaw | 239 | 0.0% |
| Chilean | 2,961 | 0.2% |
| Chinese | 275 | 0.0% |
| Chippewa | 298 | 0.0% |
| Choctaw | 357 | 0.0% |
| Colombian | 3,737 | 0.3% |
| Comanche | 46 | 0.0% |
| Costa Rican | 659 | 0.1% |
| Cree | 13 | 0.0% |
| Creek | 107 | 0.0% |
| Croatian | 1,223 | 0.1% |
| Crow | 86 | 0.0% |
| Cuban | 1,719 | 0.1% |
| Cypriot | 38 | 0.0% |
| Czech | 2,317 | 0.2% |
| Czechoslovakian | 478 | 0.0% |
| Danish | 54,672 | 4.1% |
| Delaware | 63 | 0.0% |
| Dominican | 2,232 | 0.2% |
| Dutch | 23,145 | 1.8% |
| Dutch West Indian | 11 | 0.0% |
| Eastern European | 1,812 | 0.1% |
| Ecuadorian | 2,010 | 0.2% |
| Egyptian | 548 | 0.0% |
| English | 338,382 | 25.6% |
| Estonian | 61 | 0.0% |
| Ethiopian | 756 | 0.1% |
| European | 58,813 | 4.4% |
| Fijian | 394 | 0.0% |
| Filipino | 441 | 0.0% |
| Finnish | 2,301 | 0.2% |
| French | 22,428 | 1.7% |
| French American Indian | 154 | 0.0% |
| French Canadian | 2,765 | 0.2% |
| German | 127,684 | 9.6% |
| Ghanaian | 284 | 0.0% |
| Greek | 4,733 | 0.4% |
| Guamanian / Chamorro | 767 | 0.1% |
| Guatemalan | 5,143 | 0.4% |
| Guyanese | 33 | 0.0% |
| Haitian | 204 | 0.0% |
| Honduran | 2,256 | 0.2% |
| Hopi | 107 | 0.0% |
| Hungarian | 1,996 | 0.2% |
| Icelander | 2,034 | 0.2% |
| Indian (Asian) | 11,873 | 0.9% |
| Indonesian | 1,789 | 0.1% |
| Inupiat | 378 | 0.0% |
| Iranian | 1,237 | 0.1% |
| Iraqi | 888 | 0.1% |
| Irish | 74,846 | 5.7% |
| Iroquois | 414 | 0.0% |
| Israeli | 285 | 0.0% |
| Italian | 34,436 | 2.6% |
| Jamaican | 359 | 0.0% |
| Japanese | 2,123 | 0.2% |
| Jordanian | 204 | 0.0% |
| Kenyan | 691 | 0.1% |
| Kiowa | 31 | 0.0% |
| Korean | 8,879 | 0.7% |
| Laotian | 923 | 0.1% |
| Latvian | 108 | 0.0% |
| Lebanese | 949 | 0.1% |
| Liberian | 130 | 0.0% |
| Lithuanian | 731 | 0.1% |
| Lumbee | 3 | 0.0% |
| Luxembourger | 31 | 0.0% |
| Macedonian | 97 | 0.0% |
| Malaysian | 1,162 | 0.1% |
| Maltese | 42 | 0.0% |
| Marshallese | 137 | 0.0% |
| Mexican | 165,009 | 12.5% |
| Mexican American Indian | 3,495 | 0.3% |
| Mongolian | 240 | 0.0% |
| Moroccan | 277 | 0.0% |
| Native Hawaiian | 6,492 | 0.5% |
| Navajo | 4,778 | 0.4% |
| New Zealander | 178 | 0.0% |
| Nicaraguan | 361 | 0.0% |
| Nigerian | 574 | 0.0% |
| Northern European | 4,158 | 0.3% |
| Norwegian | 28,608 | 2.2% |
| Okinawan | 155 | 0.0% |
| Osage | 28 | 0.0% |
| Paiute | 149 | 0.0% |
| Pakistani | 1,727 | 0.1% |
| Palestinian | 191 | 0.0% |
| Panamanian | 303 | 0.0% |
| Paraguayan | 130 | 0.0% |
| Pennsylvania German | 38 | 0.0% |
| Peruvian | 6,473 | 0.5% |
| Pima | 223 | 0.0% |
| Polish | 8,971 | 0.7% |
| Portuguese | 2,826 | 0.2% |
| Potawatomi | 42 | 0.0% |
| Pueblo | 392 | 0.0% |
| Puerto Rican | 5,452 | 0.4% |
| Puget Sound Salish | 11 | 0.0% |
| Romanian | 521 | 0.0% |
| Russian | 3,774 | 0.3% |
| Salvadoran | 5,908 | 0.4% |
| Samoan | 9,388 | 0.7% |
| Scandinavian | 20,741 | 1.6% |
| Scotch-Irish | 11,064 | 0.8% |
| Scottish | 48,728 | 3.7% |
| Senegalese | 6 | 0.0% |
| Serbian | 462 | 0.0% |
| Shoshone | 770 | 0.1% |
| Sierra Leonean | 118 | 0.0% |
| Sioux | 861 | 0.1% |
| Slavic | 320 | 0.0% |
| Slovak | 513 | 0.0% |
| Slovene | 233 | 0.0% |
| Somali | 1,583 | 0.1% |
| South African | 152 | 0.0% |
| South American | 24,954 | 1.9% |
| South American Indian | 1,183 | 0.1% |
| Spaniard | 4,681 | 0.4% |
| Spanish | 5,912 | 0.4% |
| Spanish American | 225 | 0.0% |
| Spanish American Indian | 204 | 0.0% |
| Sri Lankan | 7,249 | 0.5% |
| Subsaharan African | 10,071 | 0.8% |
| Sudanese | 1,310 | 0.1% |
| Swedish | 39,357 | 3.0% |
| Swiss | 12,142 | 0.9% |
| Syrian | 403 | 0.0% |
| Thai | 7,641 | 0.6% |
| Tlingit-Haida | 22 | 0.0% |
| Tohono O'Odham | 8 | 0.0% |
| Tongan | 9,986 | 0.7% |
| Trinidadian and Tobagonian | 167 | 0.0% |
| Tsimshian | 21 | 0.0% |
| Turkish | 208 | 0.0% |
| Ugandan | 207 | 0.0% |
| Ukrainian | 1,121 | 0.1% |
| Uruguayan | 554 | 0.0% |
| Ute | 551 | 0.0% |
| Venezuelan | 5,139 | 0.4% |
| Vietnamese | 51 | 0.0% |
| Welsh | 21,973 | 1.7% |
| West Indian | 95 | 0.0% |
| Yaqui | 81 | 0.0% |
| Yugoslavian | 2,452 | 0.2% |
| Yup'ik | 26 | 0.0% |
| Zimbabwean | 13 | 0.0% | View All 182 Rows |
Immigrants in Area Code 385
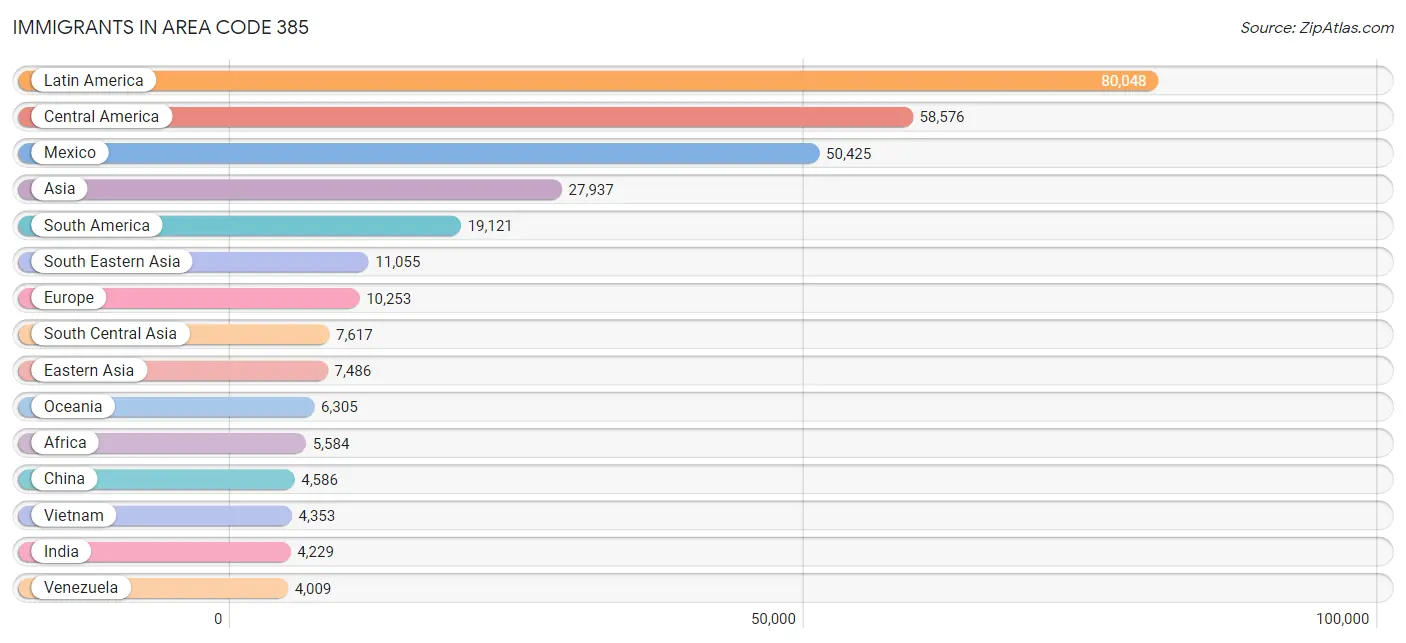
The most numerous immigrant groups reported in Area Code 385 came from Latin America (80,048 | 6.0%), Central America (58,576 | 4.4%), Mexico (50,425 | 3.8%), Asia (27,937 | 2.1%), and South America (19,121 | 1.4%), together accounting for 17.8% of all Area Code 385 residents.
| Immigration Origin | # Population | % Population |
| Afghanistan | 109 | 0.0% |
| Africa | 5,584 | 0.4% |
| Argentina | 1,840 | 0.1% |
| Armenia | 109 | 0.0% |
| Asia | 27,937 | 2.1% |
| Australia | 500 | 0.0% |
| Austria | 80 | 0.0% |
| Bangladesh | 81 | 0.0% |
| Belarus | 109 | 0.0% |
| Belgium | 212 | 0.0% |
| Belize | 104 | 0.0% |
| Bolivia | 489 | 0.0% |
| Bosnia and Herzegovina | 1,152 | 0.1% |
| Brazil | 3,291 | 0.3% |
| Bulgaria | 106 | 0.0% |
| Cambodia | 1,066 | 0.1% |
| Canada | 3,419 | 0.3% |
| Caribbean | 2,351 | 0.2% |
| Central America | 58,576 | 4.4% |
| Chile | 1,774 | 0.1% |
| China | 4,586 | 0.4% |
| Colombia | 2,449 | 0.2% |
| Congo | 403 | 0.0% |
| Costa Rica | 244 | 0.0% |
| Croatia | 156 | 0.0% |
| Cuba | 475 | 0.0% |
| Czechoslovakia | 172 | 0.0% |
| Denmark | 122 | 0.0% |
| Dominican Republic | 1,413 | 0.1% |
| Eastern Africa | 2,135 | 0.2% |
| Eastern Asia | 7,486 | 0.6% |
| Eastern Europe | 3,970 | 0.3% |
| Ecuador | 834 | 0.1% |
| Egypt | 420 | 0.0% |
| El Salvador | 3,117 | 0.2% |
| England | 975 | 0.1% |
| Eritrea | 194 | 0.0% |
| Ethiopia | 457 | 0.0% |
| Europe | 10,253 | 0.8% |
| Fiji | 131 | 0.0% |
| France | 378 | 0.0% |
| Germany | 1,645 | 0.1% |
| Ghana | 135 | 0.0% |
| Greece | 183 | 0.0% |
| Guatemala | 2,924 | 0.2% |
| Haiti | 152 | 0.0% |
| Honduras | 1,334 | 0.1% |
| Hong Kong | 757 | 0.1% |
| Hungary | 167 | 0.0% |
| India | 4,229 | 0.3% |
| Indonesia | 126 | 0.0% |
| Iran | 779 | 0.1% |
| Iraq | 872 | 0.1% |
| Ireland | 70 | 0.0% |
| Israel | 120 | 0.0% |
| Italy | 192 | 0.0% |
| Jamaica | 196 | 0.0% |
| Japan | 937 | 0.1% |
| Jordan | 99 | 0.0% |
| Kazakhstan | 44 | 0.0% |
| Kenya | 212 | 0.0% |
| Korea | 1,830 | 0.1% |
| Kuwait | 87 | 0.0% |
| Laos | 506 | 0.0% |
| Latin America | 80,048 | 6.0% |
| Latvia | 9 | 0.0% |
| Lebanon | 36 | 0.0% |
| Liberia | 127 | 0.0% |
| Lithuania | 8 | 0.0% |
| Malaysia | 320 | 0.0% |
| Mexico | 50,425 | 3.8% |
| Micronesia | 194 | 0.0% |
| Middle Africa | 607 | 0.1% |
| Moldova | 62 | 0.0% |
| Morocco | 18 | 0.0% |
| Nepal | 579 | 0.0% |
| Netherlands | 566 | 0.0% |
| Nicaragua | 268 | 0.0% |
| Nigeria | 203 | 0.0% |
| North Macedonia | 11 | 0.0% |
| Northern Africa | 1,155 | 0.1% |
| Northern Europe | 2,103 | 0.2% |
| Norway | 68 | 0.0% |
| Oceania | 6,305 | 0.5% |
| Pakistan | 1,069 | 0.1% |
| Panama | 160 | 0.0% |
| Peru | 3,959 | 0.3% |
| Philippines | 2,374 | 0.2% |
| Poland | 375 | 0.0% |
| Portugal | 33 | 0.0% |
| Romania | 243 | 0.0% |
| Russia | 553 | 0.0% |
| Saudi Arabia | 145 | 0.0% |
| Scotland | 105 | 0.0% |
| Senegal | 6 | 0.0% |
| Serbia | 95 | 0.0% |
| Sierra Leone | 129 | 0.0% |
| Singapore | 226 | 0.0% |
| Somalia | 476 | 0.0% |
| South Africa | 406 | 0.0% |
| South America | 19,121 | 1.4% |
| South Central Asia | 7,617 | 0.6% |
| South Eastern Asia | 11,055 | 0.8% |
| Southern Europe | 1,169 | 0.1% |
| Spain | 761 | 0.1% |
| Sri Lanka | 123 | 0.0% |
| Sudan | 704 | 0.1% |
| Sweden | 151 | 0.0% |
| Switzerland | 76 | 0.0% |
| Syria | 108 | 0.0% |
| Taiwan | 267 | 0.0% |
| Thailand | 1,239 | 0.1% |
| Trinidad and Tobago | 93 | 0.0% |
| Turkey | 131 | 0.0% |
| Uganda | 124 | 0.0% |
| Ukraine | 292 | 0.0% |
| Uruguay | 357 | 0.0% |
| Uzbekistan | 85 | 0.0% |
| Venezuela | 4,009 | 0.3% |
| Vietnam | 4,353 | 0.3% |
| Western Africa | 946 | 0.1% |
| Western Asia | 1,761 | 0.1% |
| Western Europe | 2,965 | 0.2% |
| Zaire | 199 | 0.0% |
| Zimbabwe | 117 | 0.0% | View All 125 Rows |
Sex and Age in Area Code 385
Sex and Age in Area Code 385
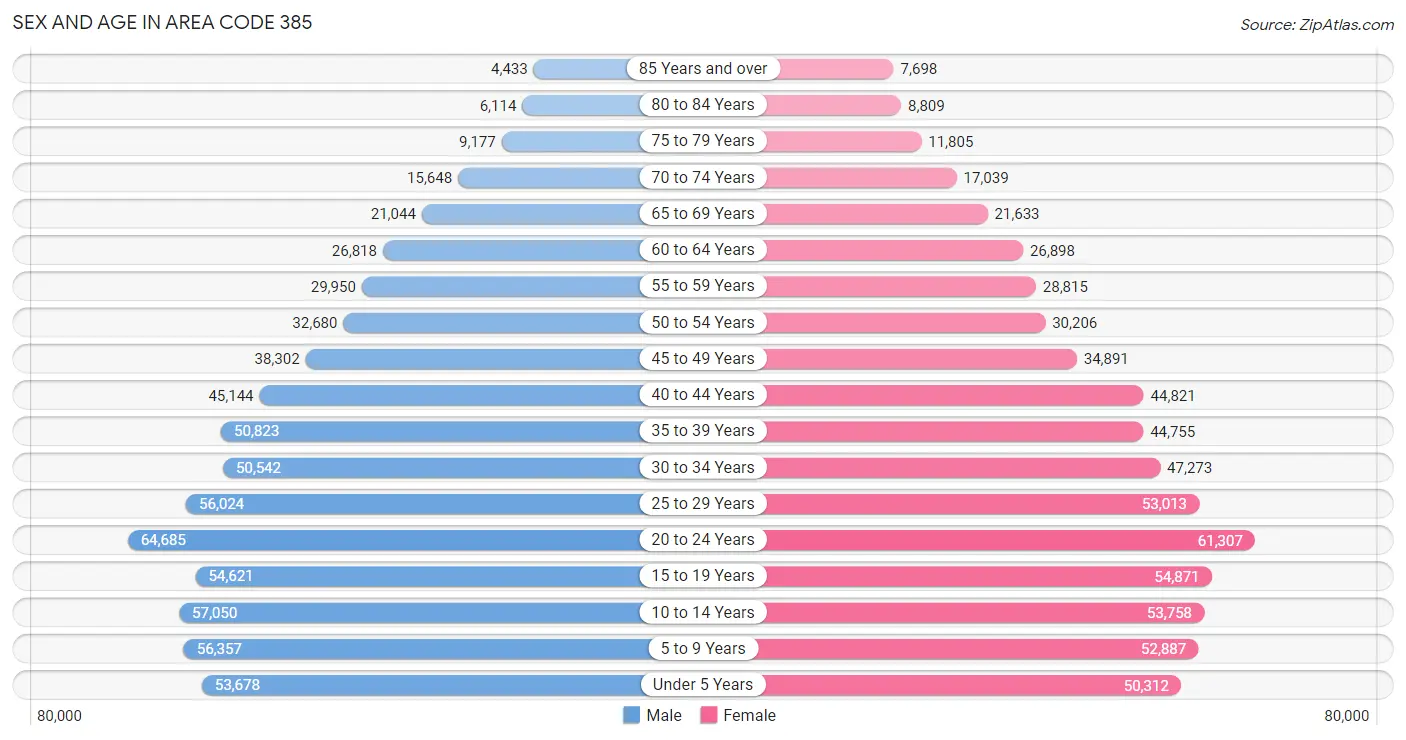
The most populous age groups in Area Code 385 are 20 to 24 Years (64,685 | 9.6%) for men and 20 to 24 Years (61,307 | 9.4%) for women.
| Age Bracket | Male | Female |
| Under 5 Years | 53,678 (8.0%) | 50,312 (7.7%) |
| 5 to 9 Years | 56,357 (8.4%) | 52,887 (8.1%) |
| 10 to 14 Years | 57,050 (8.5%) | 53,758 (8.3%) |
| 15 to 19 Years | 54,621 (8.1%) | 54,871 (8.4%) |
| 20 to 24 Years | 64,685 (9.6%) | 61,307 (9.4%) |
| 25 to 29 Years | 56,024 (8.3%) | 53,013 (8.2%) |
| 30 to 34 Years | 50,542 (7.5%) | 47,273 (7.3%) |
| 35 to 39 Years | 50,823 (7.5%) | 44,755 (6.9%) |
| 40 to 44 Years | 45,144 (6.7%) | 44,821 (6.9%) |
| 45 to 49 Years | 38,302 (5.7%) | 34,891 (5.4%) |
| 50 to 54 Years | 32,680 (4.9%) | 30,206 (4.6%) |
| 55 to 59 Years | 29,950 (4.4%) | 28,815 (4.4%) |
| 60 to 64 Years | 26,818 (4.0%) | 26,898 (4.1%) |
| 65 to 69 Years | 21,044 (3.1%) | 21,633 (3.3%) |
| 70 to 74 Years | 15,648 (2.3%) | 17,039 (2.6%) |
| 75 to 79 Years | 9,177 (1.4%) | 11,805 (1.8%) |
| 80 to 84 Years | 6,114 (0.9%) | 8,809 (1.3%) |
| 85 Years and over | 4,433 (0.7%) | 7,698 (1.2%) |
| Total | 673,090 (100.0%) | 650,791 (100.0%) |
Families and Households in Area Code 385
Median Family Size in Area Code 385
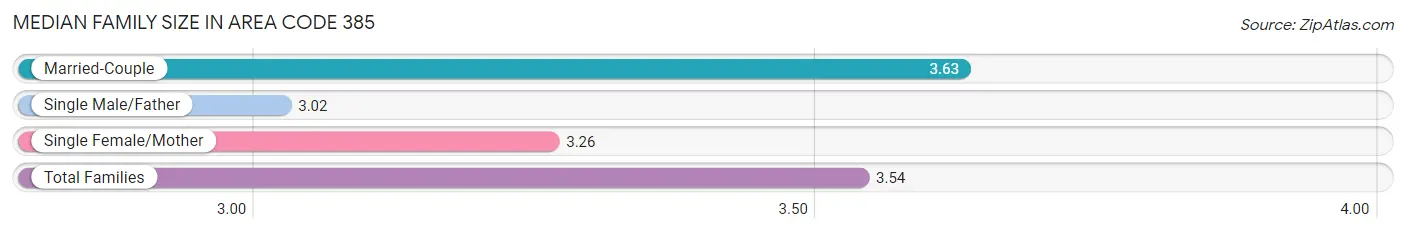
The median family size in Area Code 385 is 3.54 persons per family, with married-couple families (244,336 | 80.5%) accounting for the largest median family size of 3.62882 persons per family. On the other hand, single male/father families (21,103 | 7.0%) represent the smallest median family size with 3.02 persons per family.
| Family Type | # Families | Family Size |
| Married-Couple | 244,336 (80.5%) | 3.63 |
| Single Male/Father | 21,103 (7.0%) | 3.02 |
| Single Female/Mother | 38,218 (12.6%) | 3.26 |
| Total Families | 303,657 (100.0%) | 3.54 |
Median Household Size in Area Code 385
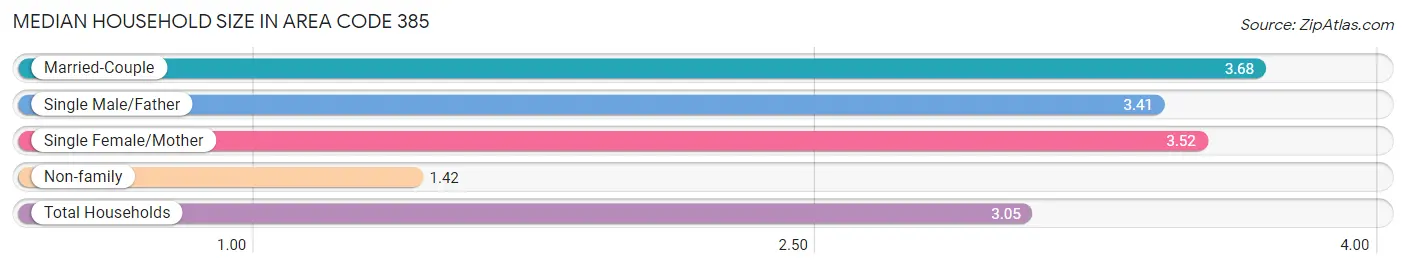
The median household size in Area Code 385 is 3.05 persons per household, with married-couple households (244,336 | 58.1%) accounting for the largest median household size of 3.67617 persons per household. non-family households (116,772 | 27.8%) represent the smallest median household size with 1.42 persons per household.
| Household Type | # Households | Household Size |
| Married-Couple | 244,336 (58.1%) | 3.68 |
| Single Male/Father | 21,103 (5.0%) | 3.41 |
| Single Female/Mother | 38,218 (9.1%) | 3.52 |
| Non-family | 116,772 (27.8%) | 1.42 |
| Total Households | 420,429 (100.0%) | 3.05 |
Household Size by Marriage Status in Area Code 385
Out of a total of 420,429 households in Area Code 385, 303,657 (72.2%) are family households, while 116,772 (27.8%) are nonfamily households. The most numerous type of family households are 2-person households, comprising 102,462, and the most common type of nonfamily households are 1-person households, comprising 86,184.
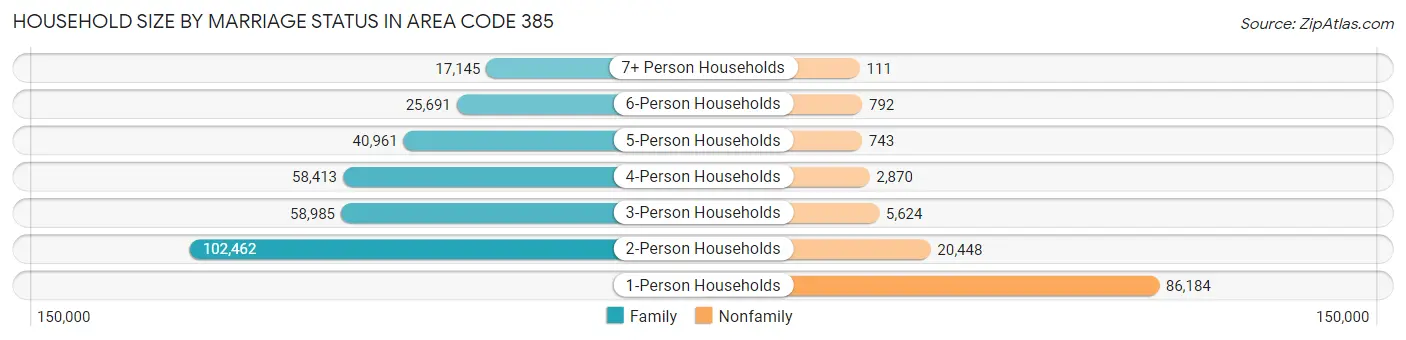
| Household Size | Family Households | Nonfamily Households |
| 1-Person Households | - | 86,184 (20.5%) |
| 2-Person Households | 102,462 (24.4%) | 20,448 (4.9%) |
| 3-Person Households | 58,985 (14.0%) | 5,624 (1.3%) |
| 4-Person Households | 58,413 (13.9%) | 2,870 (0.7%) |
| 5-Person Households | 40,961 (9.7%) | 743 (0.2%) |
| 6-Person Households | 25,691 (6.1%) | 792 (0.2%) |
| 7+ Person Households | 17,145 (4.1%) | 111 (0.0%) |
| Total | 303,657 (72.2%) | 116,772 (27.8%) |
Female Fertility in Area Code 385
Fertility by Age in Area Code 385
Average fertility rate in Area Code 385 is 60.4 births per 1,000 women. Women in the age bracket of 20 to 34 years have the highest fertility rate with 108.0 births per 1,000 women. Women in the age bracket of 20 to 34 years acount for 78.9% of all women with births.
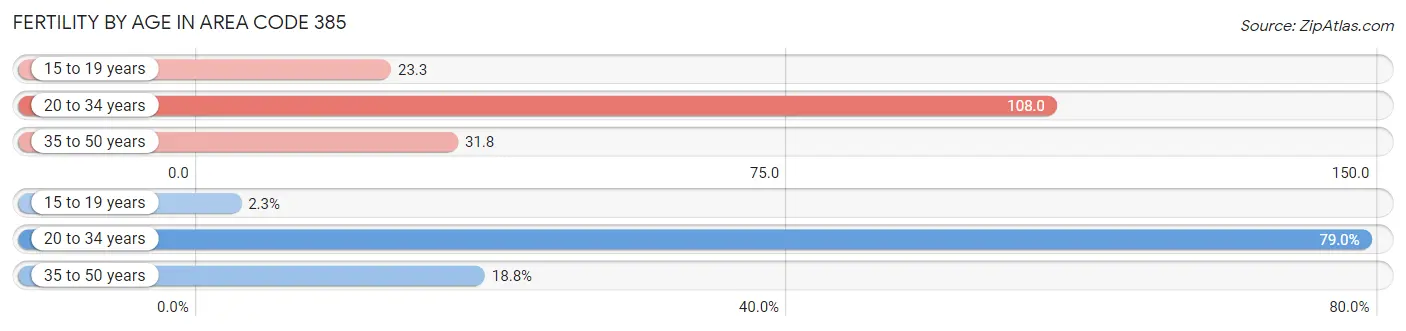
| Age Bracket | Women with Births | Births / 1,000 Women |
| 15 to 19 years | 489 (2.2%) | 23.3 |
| 20 to 34 years | 17,136 (78.9%) | 108.0 |
| 35 to 50 years | 4,079 (18.8%) | 31.8 |
| Total | 21,704 (100.0%) | 60.4 |
Fertility by Age by Marriage Status in Area Code 385
83.8% of women with births (21,704) in Area Code 385 are married. The highest percentage of unmarried women with births falls into 15 to 19 years age bracket with 95.5% of them unmarried at the time of birth, while the lowest percentage of unmarried women with births belong to 20 to 34 years age bracket with 17.3% of them unmarried.
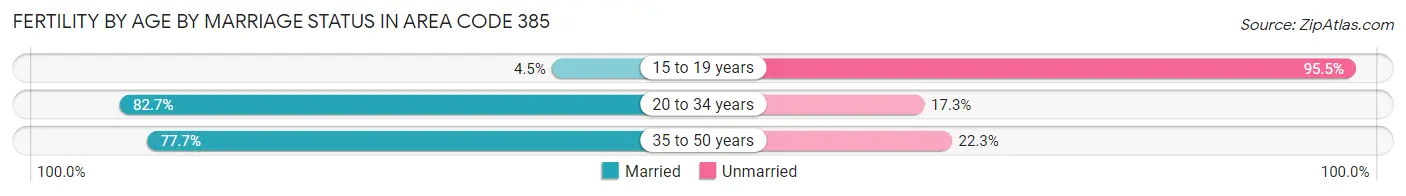
| Age Bracket | Married | Unmarried |
| 15 to 19 years | 22 (4.5%) | 467 (95.5%) |
| 20 to 34 years | 14,171 (82.7%) | 2,965 (17.3%) |
| 35 to 50 years | 3,170 (77.7%) | 909 (22.3%) |
| Total | 18,191 (83.8%) | 3,513 (16.2%) |
Fertility by Education in Area Code 385
Average fertility rate in Area Code 385 is 60.4 births per 1,000 women. Women with the education attainment of bachelor's degree have the highest fertility rate of 84.8 births per 1,000 women, while women with the education attainment of less than high school have the lowest fertility at 36.5 births per 1,000 women. Women with the education attainment of bachelor's degree represent 32.6% of all women with births.
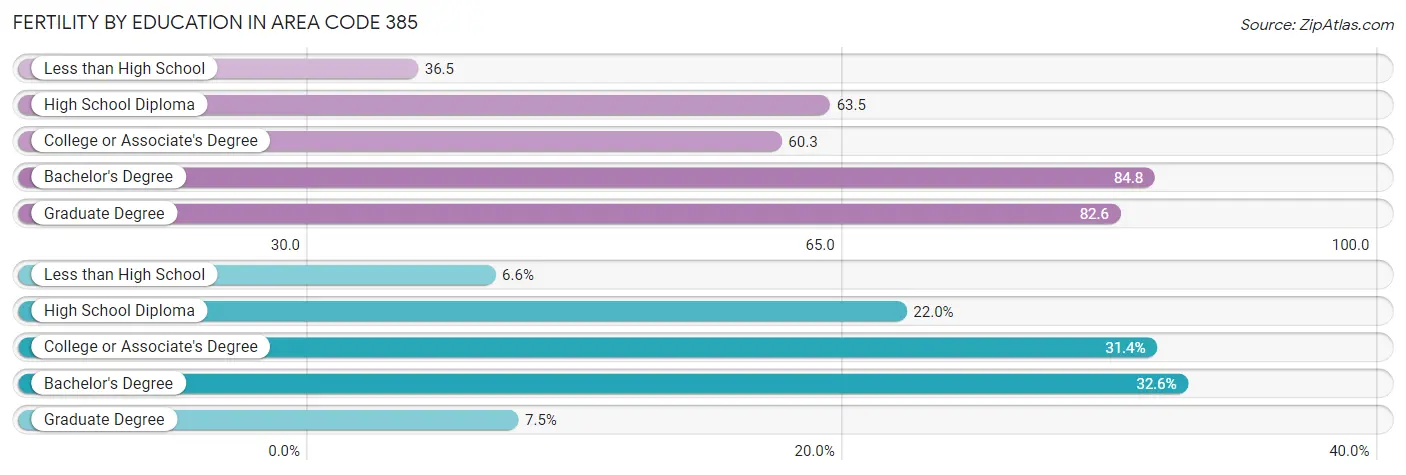
| Educational Attainment | Women with Births | Births / 1,000 Women |
| Less than High School | 1,431 (6.6%) | 36.5 |
| High School Diploma | 4,774 (22.0%) | 63.5 |
| College or Associate's Degree | 6,815 (31.4%) | 60.3 |
| Bachelor's Degree | 7,067 (32.6%) | 84.8 |
| Graduate Degree | 1,617 (7.4%) | 82.6 |
| Total | 21,704 (100.0%) | 60.4 |
Fertility by Education by Marriage Status in Area Code 385
16.2% of women with births in Area Code 385 are unmarried. Women with the educational attainment of graduate degree are most likely to be married with 84.8% of them married at childbirth, while women with the educational attainment of less than high school are least likely to be married with 56.1% of them unmarried at childbirth.
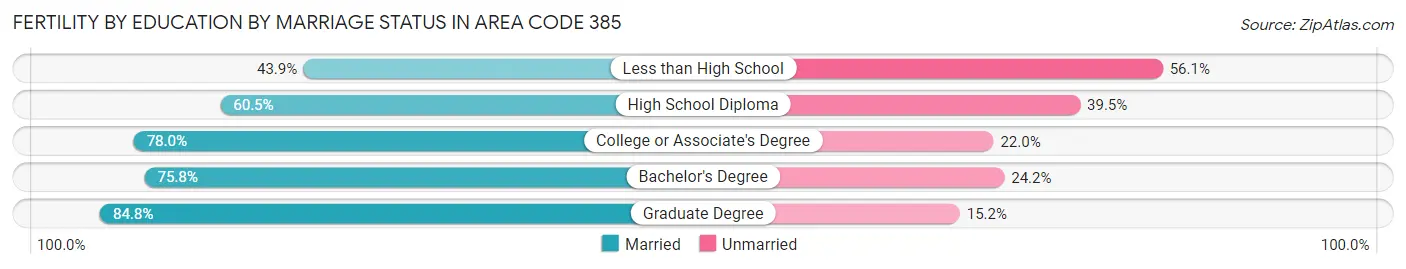
| Educational Attainment | Married | Unmarried |
| Less than High School | 628 (43.9%) | 803 (56.1%) |
| High School Diploma | 2,890 (60.5%) | 1,884 (39.5%) |
| College or Associate's Degree | 5,316 (78.0%) | 1,499 (22.0%) |
| Bachelor's Degree | 5,358 (75.8%) | 1,709 (24.2%) |
| Graduate Degree | 1,371 (84.8%) | 246 (15.2%) |
| Total | 18,191 (83.8%) | 3,513 (16.2%) |
Employment Characteristics in Area Code 385
Employment by Class of Employer in Area Code 385
Among the 661,240 employed individuals in Area Code 385, private company employees (460,272 | 69.6%), not-for-profit organizations (49,191 | 7.4%), and local government employees (40,434 | 6.1%) make up the most common classes of employment.
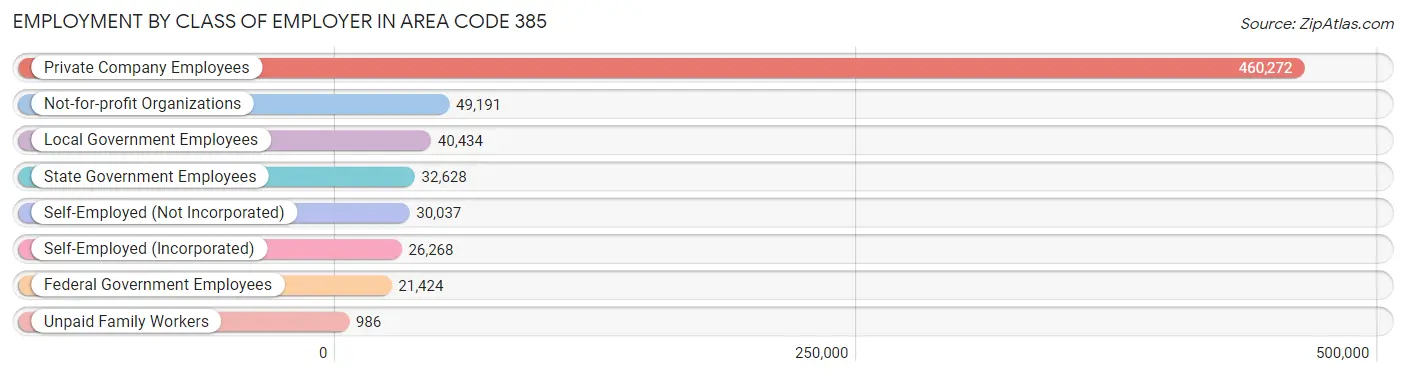
| Employer Class | # Employees | % Employees |
| Private Company Employees | 460,272 | 69.6% |
| Self-Employed (Incorporated) | 26,268 | 4.0% |
| Self-Employed (Not Incorporated) | 30,037 | 4.5% |
| Not-for-profit Organizations | 49,191 | 7.4% |
| Local Government Employees | 40,434 | 6.1% |
| State Government Employees | 32,628 | 4.9% |
| Federal Government Employees | 21,424 | 3.2% |
| Unpaid Family Workers | 986 | 0.2% |
| Total | 661,240 | 100.0% |
Employment Status by Age in Area Code 385
According to the labor force statistics for Area Code 385, out of the total population over 16 years of age (977,103), 70.7% or 690,812 individuals are in the labor force, with 3.8% or 26,458 of them unemployed. The age group with the highest labor force participation rate is 25 to 29 years, with 84.4% or 92,049 individuals in the labor force. Within the labor force, the 16 to 19 years age range has the highest percentage of unemployed individuals, with 330.9% or 154,448 of them being unemployed.
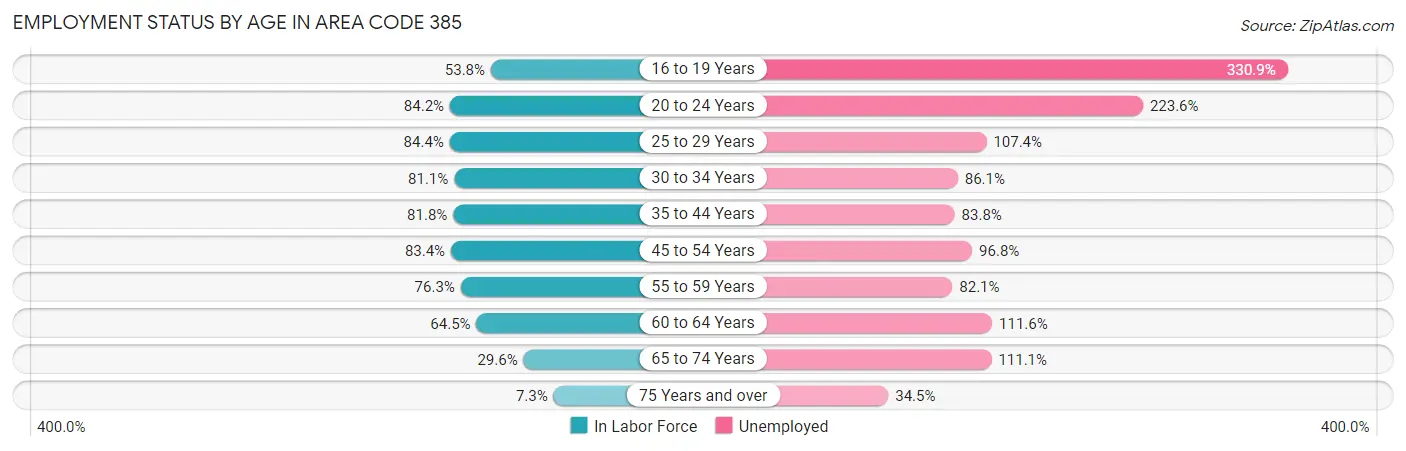
| Age Bracket | In Labor Force | Unemployed |
| 16 to 19 Years | 46,675 (53.8%) | 154,448 (330.9%) |
| 20 to 24 Years | 106,100 (84.2%) | 237,235 (223.6%) |
| 25 to 29 Years | 92,049 (84.4%) | 98,861 (107.4%) |
| 30 to 34 Years | 79,325 (81.1%) | 68,301 (86.1%) |
| 35 to 44 Years | 151,812 (81.8%) | 127,218 (83.8%) |
| 45 to 54 Years | 113,548 (83.4%) | 109,911 (96.8%) |
| 55 to 59 Years | 44,810 (76.2%) | 36,787 (82.1%) |
| 60 to 64 Years | 34,669 (64.5%) | 38,689 (111.6%) |
| 65 to 74 Years | 22,317 (29.6%) | 24,792 (111.1%) |
| 75 Years and over | 3,491 (7.3%) | 1,205 (34.5%) |
| Total | 690,812 (70.7%) | 26,428 (3.8%) |
Employment Status by Educational Attainment in Area Code 385
According to labor force statistics for Area Code 385, 80.8% of individuals (517,699) out of the total population between 25 and 64 years of age (640,955) are in the labor force, with 93.8% or 485,602 of them being unemployed. The group with the highest labor force participation rate are those with the educational attainment of bachelor's degree or higher, with 86.5% or 206,253 individuals in the labor force. Within the labor force, individuals with less than high school education have the highest percentage of unemployment, with 119.0% or 38,142 of them being unemployed.
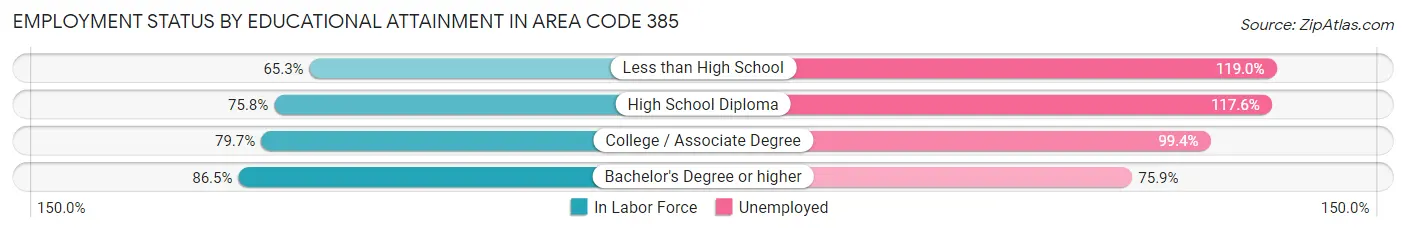
| Educational Attainment | In Labor Force | Unemployed |
| Less than High School | 32,051 (65.3%) | 58,418 (119.0%) |
| High School Diploma | 104,437 (75.8%) | 162,061 (117.6%) |
| College / Associate Degree | 171,707 (79.7%) | 214,211 (99.4%) |
| Bachelor's Degree or higher | 206,246 (86.5%) | 181,062 (75.9%) |
| Total | 517,708 (80.8%) | 601,216 (93.8%) |
Employment Occupations by Sex in Area Code 385
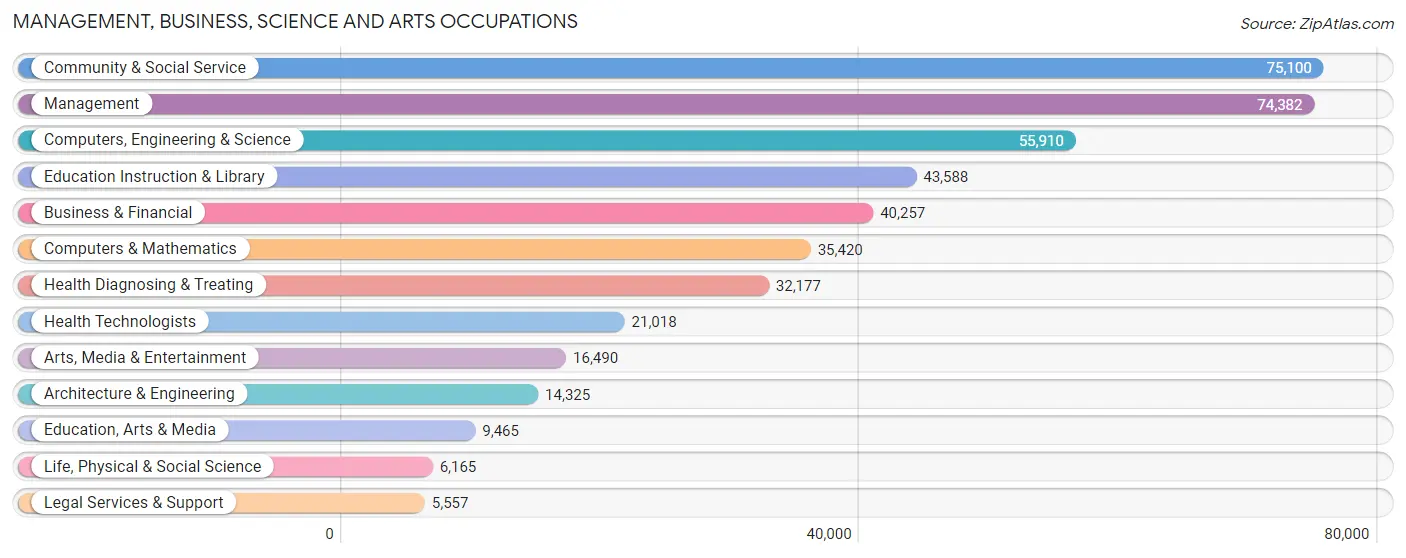
Management, Business, Science and Arts Occupations
The most common Management, Business, Science and Arts occupations in Area Code 385 are Community & Social Service (75,100 | 11.2%), Management (74,382 | 11.1%), Computers, Engineering & Science (55,910 | 8.3%), Education Instruction & Library (43,588 | 6.5%), and Business & Financial (40,257 | 6.0%).
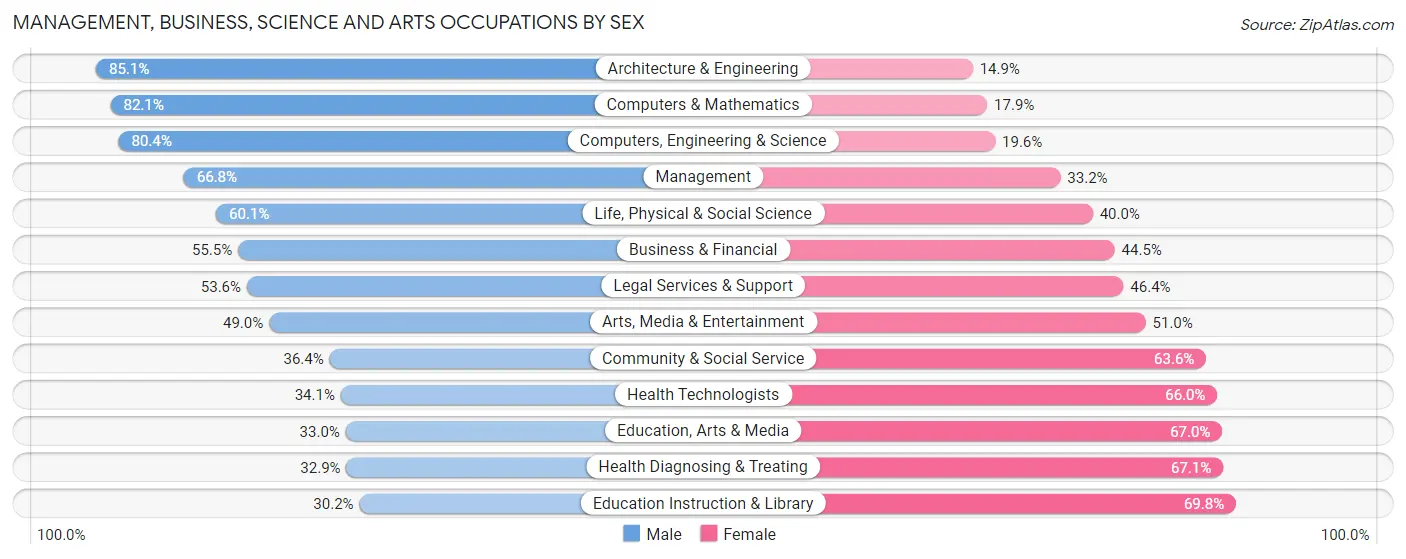
Management, Business, Science and Arts Occupations by Sex
Within the Management, Business, Science and Arts occupations in Area Code 385, the most male-oriented occupations are Architecture & Engineering (85.1%), Computers & Mathematics (82.1%), and Computers, Engineering & Science (80.4%), while the most female-oriented occupations are Education Instruction & Library (69.8%), Health Diagnosing & Treating (67.1%), and Education, Arts & Media (67.0%).
| Occupation | Male | Female |
| Management | 49,669 (66.8%) | 24,713 (33.2%) |
| Business & Financial | 22,332 (55.5%) | 17,925 (44.5%) |
| Computers, Engineering & Science | 44,955 (80.4%) | 10,955 (19.6%) |
| Computers & Mathematics | 29,065 (82.1%) | 6,355 (17.9%) |
| Architecture & Engineering | 12,188 (85.1%) | 2,137 (14.9%) |
| Life, Physical & Social Science | 3,702 (60.1%) | 2,463 (40.0%) |
| Community & Social Service | 27,332 (36.4%) | 47,768 (63.6%) |
| Education, Arts & Media | 3,126 (33.0%) | 6,339 (67.0%) |
| Legal Services & Support | 2,981 (53.6%) | 2,576 (46.4%) |
| Education Instruction & Library | 13,144 (30.2%) | 30,444 (69.8%) |
| Arts, Media & Entertainment | 8,081 (49.0%) | 8,409 (51.0%) |
| Health Diagnosing & Treating | 10,577 (32.9%) | 21,600 (67.1%) |
| Health Technologists | 7,156 (34.1%) | 13,862 (65.9%) |
| Total (Category) | 154,865 (55.7%) | 122,961 (44.3%) |
| Total (Overall) | 376,319 (56.1%) | 294,533 (43.9%) |
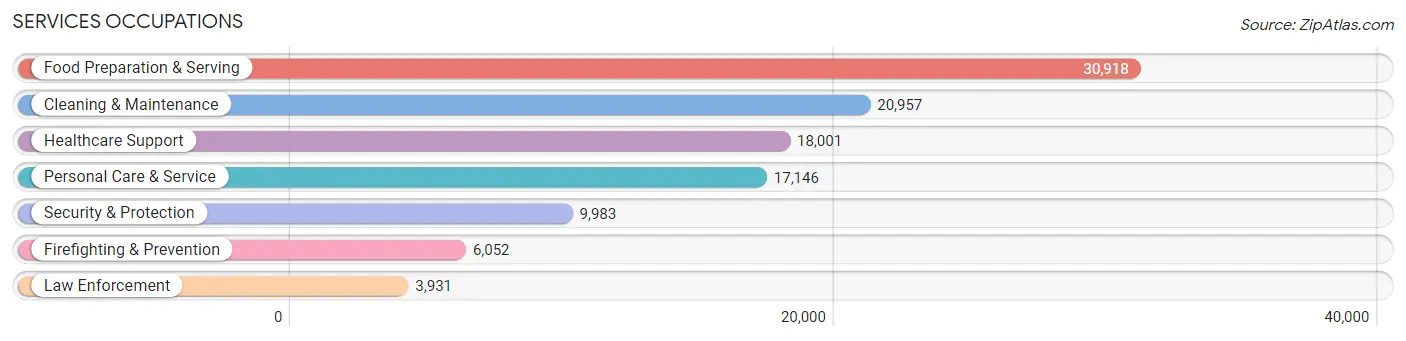
Services Occupations
The most common Services occupations in Area Code 385 are Food Preparation & Serving (30,918 | 4.6%), Cleaning & Maintenance (20,957 | 3.1%), Healthcare Support (18,001 | 2.7%), Personal Care & Service (17,146 | 2.6%), and Security & Protection (9,983 | 1.5%).
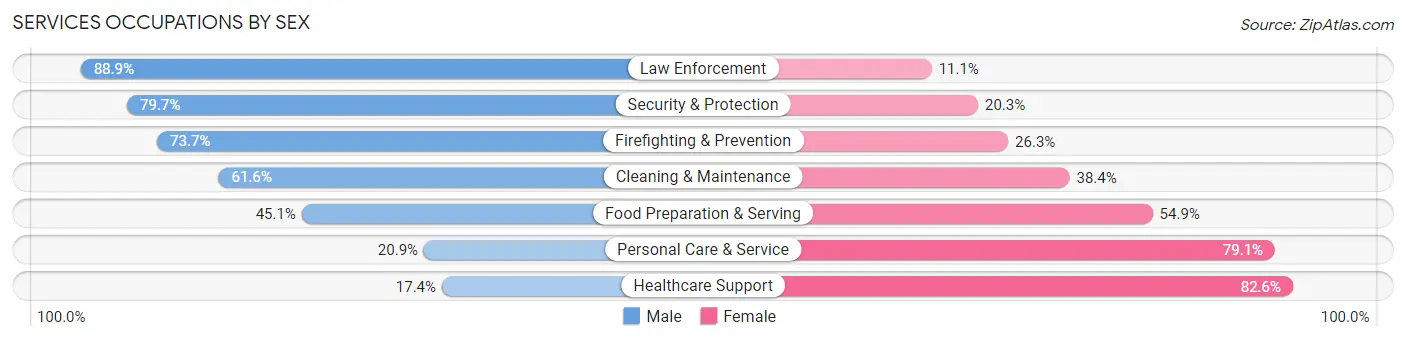
Services Occupations by Sex
Within the Services occupations in Area Code 385, the most male-oriented occupations are Law Enforcement (88.9%), Security & Protection (79.7%), and Firefighting & Prevention (73.7%), while the most female-oriented occupations are Healthcare Support (82.6%), Personal Care & Service (79.1%), and Food Preparation & Serving (54.9%).
| Occupation | Male | Female |
| Healthcare Support | 3,128 (17.4%) | 14,873 (82.6%) |
| Security & Protection | 7,957 (79.7%) | 2,026 (20.3%) |
| Firefighting & Prevention | 4,463 (73.7%) | 1,589 (26.3%) |
| Law Enforcement | 3,494 (88.9%) | 437 (11.1%) |
| Food Preparation & Serving | 13,954 (45.1%) | 16,964 (54.9%) |
| Cleaning & Maintenance | 12,907 (61.6%) | 8,050 (38.4%) |
| Personal Care & Service | 3,588 (20.9%) | 13,558 (79.1%) |
| Total (Category) | 41,534 (42.8%) | 55,471 (57.2%) |
| Total (Overall) | 376,319 (56.1%) | 294,533 (43.9%) |
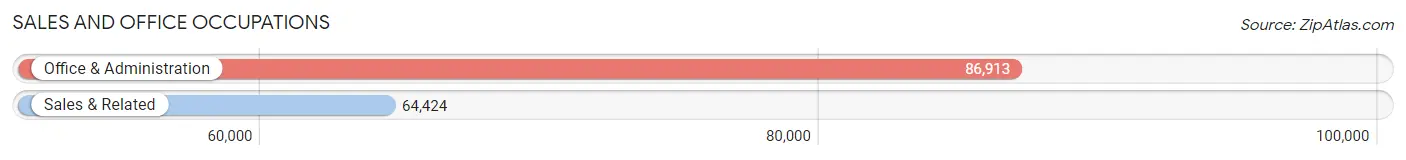
Sales and Office Occupations
The most common Sales and Office occupations in Area Code 385 are Office & Administration (86,913 | 13.0%), and Sales & Related (64,424 | 9.6%).
Sales and Office Occupations by Sex
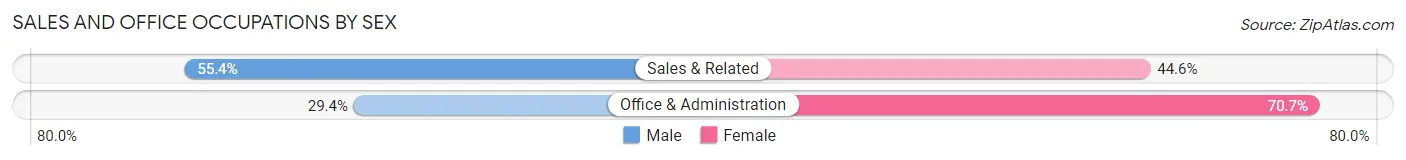
| Occupation | Male | Female |
| Sales & Related | 35,705 (55.4%) | 28,719 (44.6%) |
| Office & Administration | 25,507 (29.3%) | 61,406 (70.7%) |
| Total (Category) | 61,212 (40.5%) | 90,125 (59.6%) |
| Total (Overall) | 376,319 (56.1%) | 294,533 (43.9%) |
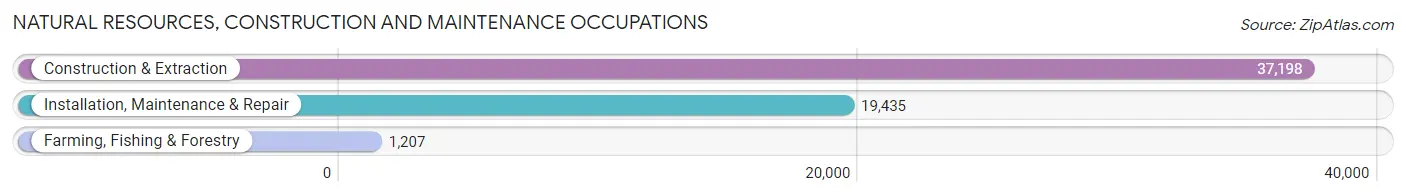
Natural Resources, Construction and Maintenance Occupations
The most common Natural Resources, Construction and Maintenance occupations in Area Code 385 are Construction & Extraction (37,198 | 5.5%), Installation, Maintenance & Repair (19,435 | 2.9%), and Farming, Fishing & Forestry (1,207 | 0.2%).
Natural Resources, Construction and Maintenance Occupations by Sex
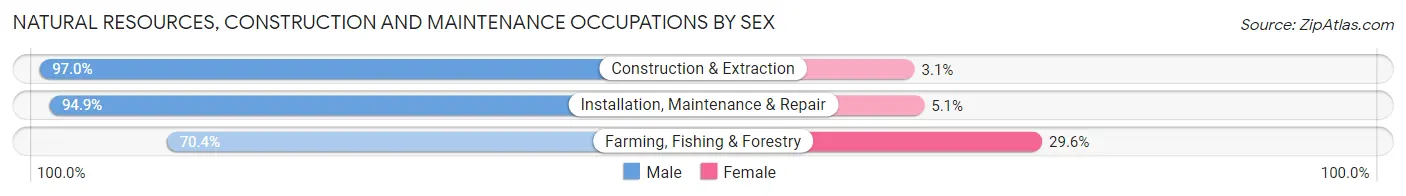
| Occupation | Male | Female |
| Farming, Fishing & Forestry | 850 (70.4%) | 357 (29.6%) |
| Construction & Extraction | 36,064 (97.0%) | 1,134 (3.0%) |
| Installation, Maintenance & Repair | 18,449 (94.9%) | 986 (5.1%) |
| Total (Category) | 55,363 (95.7%) | 2,477 (4.3%) |
| Total (Overall) | 376,319 (56.1%) | 294,533 (43.9%) |
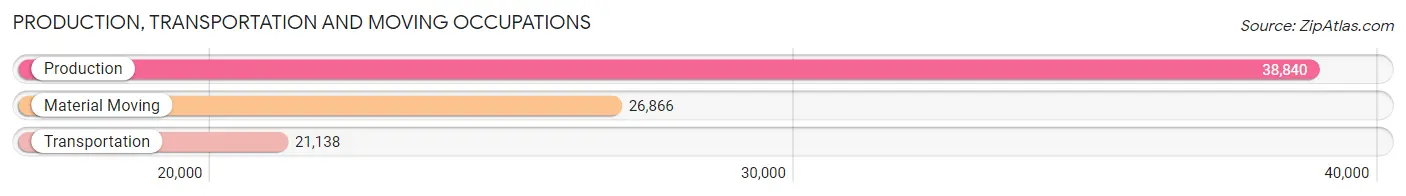
Production, Transportation and Moving Occupations
The most common Production, Transportation and Moving occupations in Area Code 385 are Production (38,840 | 5.8%), Material Moving (26,866 | 4.0%), and Transportation (21,138 | 3.2%).
Production, Transportation and Moving Occupations by Sex
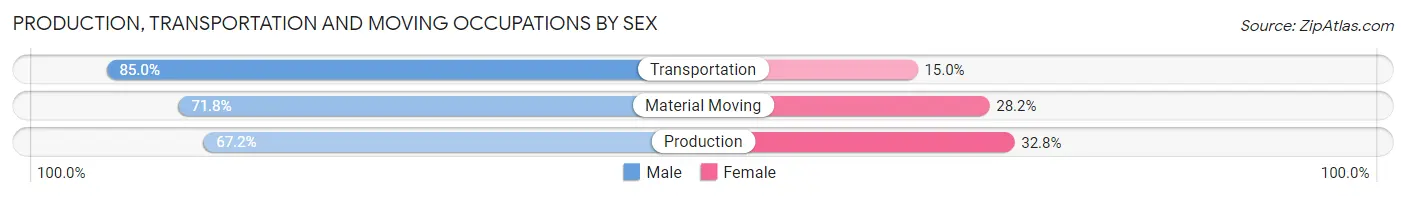
| Occupation | Male | Female |
| Production | 26,099 (67.2%) | 12,741 (32.8%) |
| Transportation | 17,960 (85.0%) | 3,178 (15.0%) |
| Material Moving | 19,286 (71.8%) | 7,580 (28.2%) |
| Total (Category) | 63,345 (72.9%) | 23,499 (27.1%) |
| Total (Overall) | 376,319 (56.1%) | 294,533 (43.9%) |
Employment Industries by Sex in Area Code 385
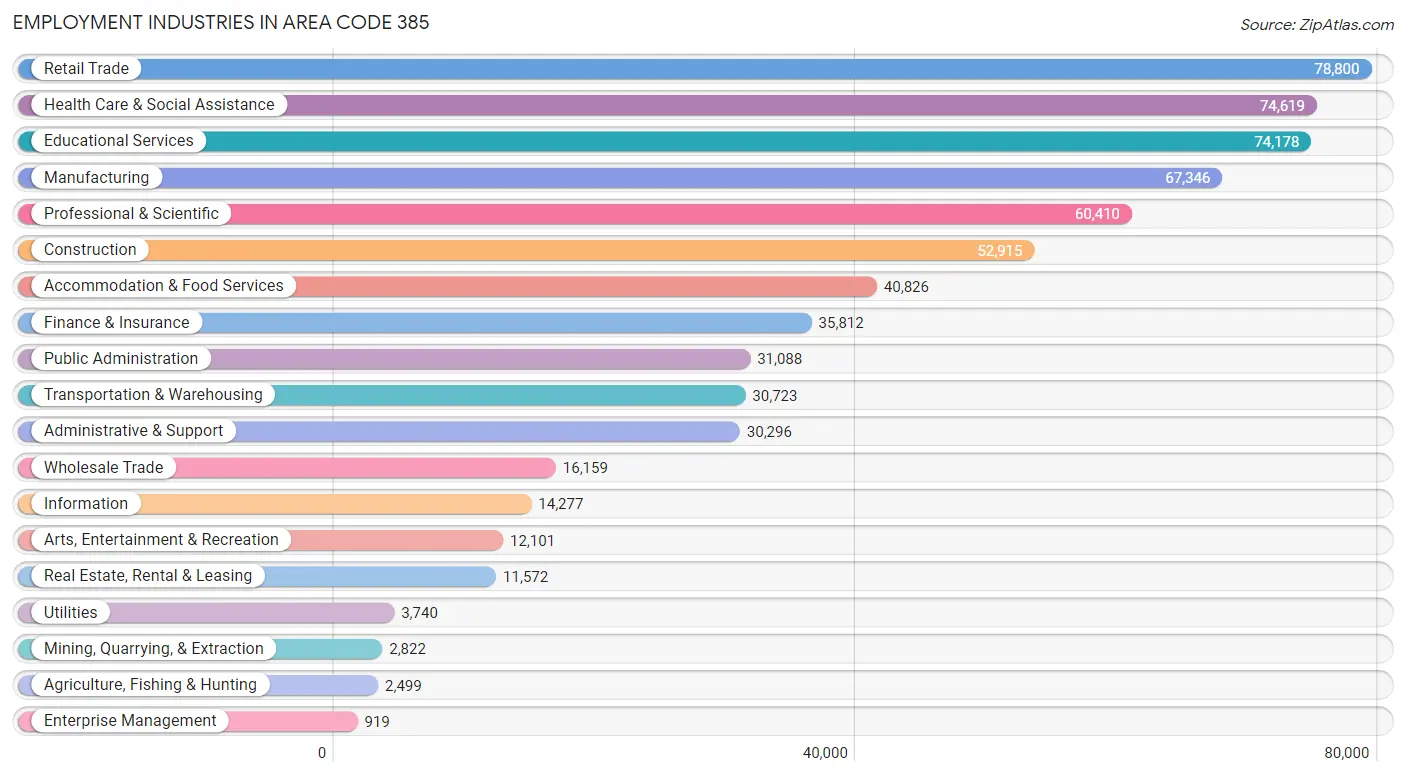
Employment Industries in Area Code 385
The major employment industries in Area Code 385 include Retail Trade (78,800 | 11.7%), Health Care & Social Assistance (74,619 | 11.1%), Educational Services (74,178 | 11.1%), Manufacturing (67,346 | 10.0%), and Professional & Scientific (60,410 | 9.0%).
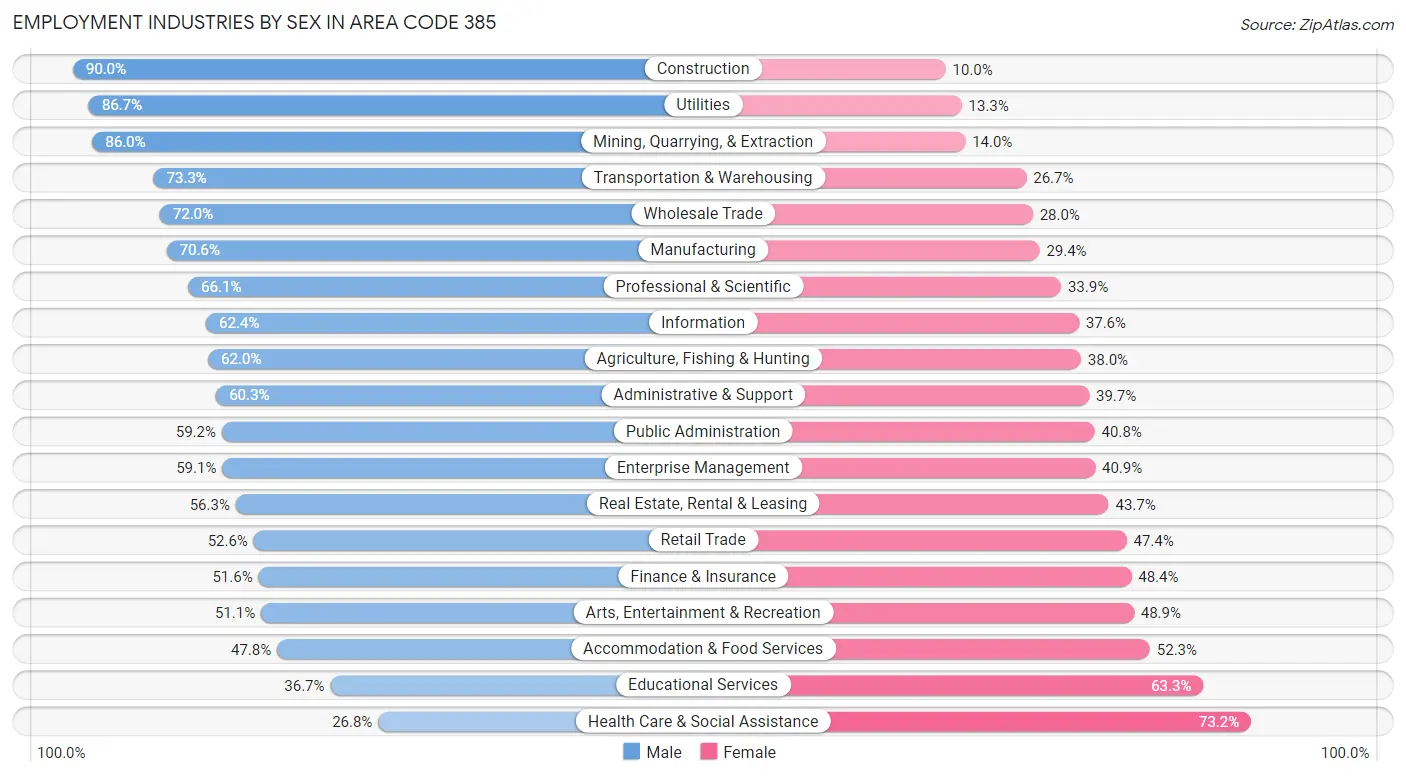
Employment Industries by Sex in Area Code 385
The Area Code 385 industries that see more men than women are Construction (90.0%), Utilities (86.7%), and Mining, Quarrying, & Extraction (86.0%), whereas the industries that tend to have a higher number of women are Health Care & Social Assistance (73.2%), Educational Services (63.3%), and Accommodation & Food Services (52.2%).
| Industry | Male | Female |
| Agriculture, Fishing & Hunting | 1,550 (62.0%) | 949 (38.0%) |
| Mining, Quarrying, & Extraction | 2,426 (86.0%) | 396 (14.0%) |
| Construction | 47,636 (90.0%) | 5,279 (10.0%) |
| Manufacturing | 47,549 (70.6%) | 19,797 (29.4%) |
| Wholesale Trade | 11,635 (72.0%) | 4,524 (28.0%) |
| Retail Trade | 41,435 (52.6%) | 37,365 (47.4%) |
| Transportation & Warehousing | 22,526 (73.3%) | 8,197 (26.7%) |
| Utilities | 3,243 (86.7%) | 497 (13.3%) |
| Information | 8,915 (62.4%) | 5,362 (37.6%) |
| Finance & Insurance | 18,477 (51.6%) | 17,335 (48.4%) |
| Real Estate, Rental & Leasing | 6,515 (56.3%) | 5,057 (43.7%) |
| Professional & Scientific | 39,954 (66.1%) | 20,456 (33.9%) |
| Enterprise Management | 543 (59.1%) | 376 (40.9%) |
| Administrative & Support | 18,277 (60.3%) | 12,019 (39.7%) |
| Educational Services | 27,233 (36.7%) | 46,945 (63.3%) |
| Health Care & Social Assistance | 20,008 (26.8%) | 54,611 (73.2%) |
| Arts, Entertainment & Recreation | 6,180 (51.1%) | 5,921 (48.9%) |
| Accommodation & Food Services | 19,495 (47.7%) | 21,331 (52.2%) |
| Public Administration | 18,398 (59.2%) | 12,690 (40.8%) |
| Total | 376,319 (56.1%) | 294,533 (43.9%) |
Education in Area Code 385
School Enrollment in Area Code 385
The most common levels of schooling among the 428,730 students in Area Code 385 are college / undergraduate (106,345 | 24.8%), high school (87,855 | 20.5%), and middle school (86,778 | 20.2%).
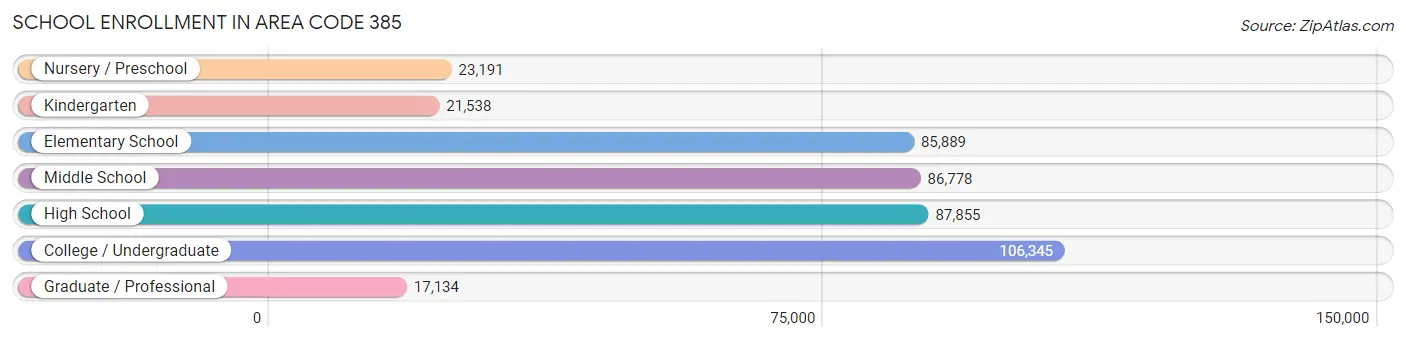
| School Level | # Students | % Students |
| Nursery / Preschool | 23,191 | 5.4% |
| Kindergarten | 21,538 | 5.0% |
| Elementary School | 85,889 | 20.0% |
| Middle School | 86,778 | 20.2% |
| High School | 87,855 | 20.5% |
| College / Undergraduate | 106,345 | 24.8% |
| Graduate / Professional | 17,134 | 4.0% |
| Total | 428,730 | 100.0% |
School Enrollment by Age by Funding Source in Area Code 385
Out of a total of 428,730 students who are enrolled in schools in Area Code 385, 77,078 (18.0%) attend a private institution, while the remaining 351,652 (82.0%) are enrolled in public schools. The age group of 20 to 24 year olds has the highest likelihood of being enrolled in private schools, with 28,500 (47.5% in the age bracket) enrolled. Conversely, the age group of 15 to 17 year olds has the lowest likelihood of being enrolled in a private school, with 59,915 (94.9% in the age bracket) attending a public institution.
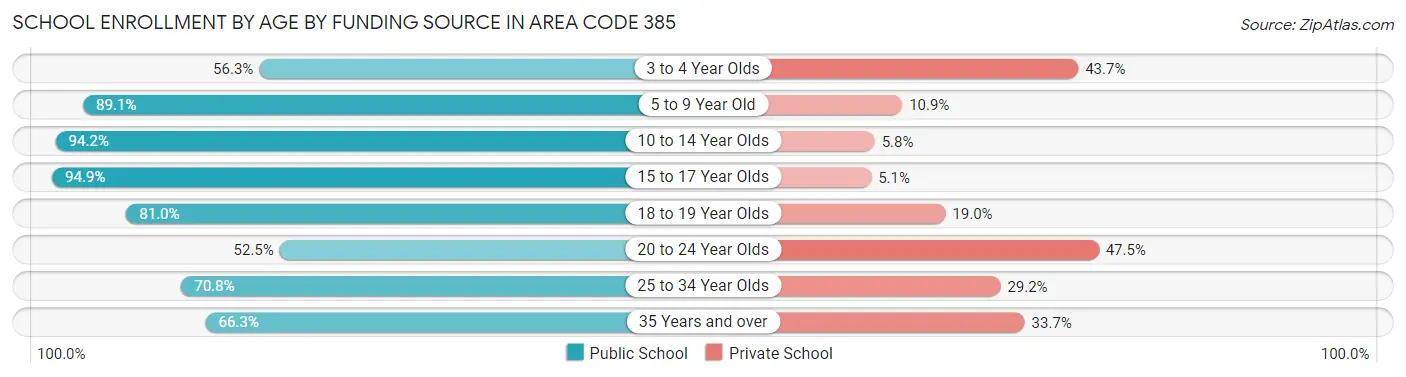
| Age Bracket | Public School | Private School |
| 3 to 4 Year Olds | 9,456 (56.3%) | 7,338 (43.7%) |
| 5 to 9 Year Old | 91,557 (89.1%) | 11,203 (10.9%) |
| 10 to 14 Year Olds | 102,202 (94.2%) | 6,269 (5.8%) |
| 15 to 17 Year Olds | 59,915 (94.9%) | 3,240 (5.1%) |
| 18 to 19 Year Olds | 23,273 (81.0%) | 5,444 (19.0%) |
| 20 to 24 Year Olds | 31,496 (52.5%) | 28,500 (47.5%) |
| 25 to 34 Year Olds | 21,698 (70.8%) | 8,948 (29.2%) |
| 35 Years and over | 12,058 (66.3%) | 6,133 (33.7%) |
| Total | 351,652 (82.0%) | 77,078 (18.0%) |
Educational Attainment by Field of Study in Area Code 385
Business (55,199 | 18.2%), education (35,519 | 11.7%), science & technology (31,422 | 10.4%), arts & humanities (24,814 | 8.2%), and social sciences (21,982 | 7.3%) are the most common fields of study among 302,935 individuals in Area Code 385 who have obtained a bachelor's degree or higher.
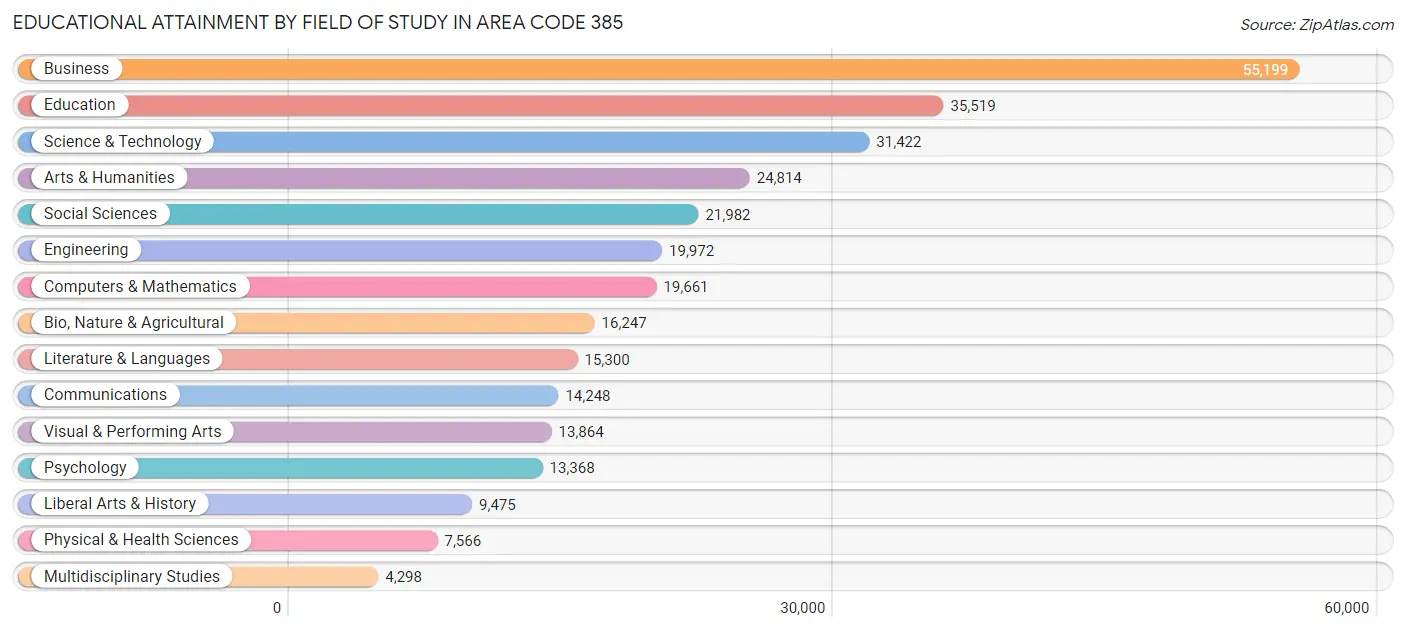
| Field of Study | # Graduates | % Graduates |
| Computers & Mathematics | 19,661 | 6.5% |
| Bio, Nature & Agricultural | 16,247 | 5.4% |
| Physical & Health Sciences | 7,566 | 2.5% |
| Psychology | 13,368 | 4.4% |
| Social Sciences | 21,982 | 7.3% |
| Engineering | 19,972 | 6.6% |
| Multidisciplinary Studies | 4,298 | 1.4% |
| Science & Technology | 31,422 | 10.4% |
| Business | 55,199 | 18.2% |
| Education | 35,519 | 11.7% |
| Literature & Languages | 15,300 | 5.1% |
| Liberal Arts & History | 9,475 | 3.1% |
| Visual & Performing Arts | 13,864 | 4.6% |
| Communications | 14,248 | 4.7% |
| Arts & Humanities | 24,814 | 8.2% |
| Total | 302,935 | 100.0% |
Transportation & Commute in Area Code 385
Vehicle Availability by Sex in Area Code 385
The most prevalent vehicle ownership categories in Area Code 385 are males with 2 vehicles (140,182, accounting for 38.0%) and females with 2 vehicles (103,775, making up 49.4%).
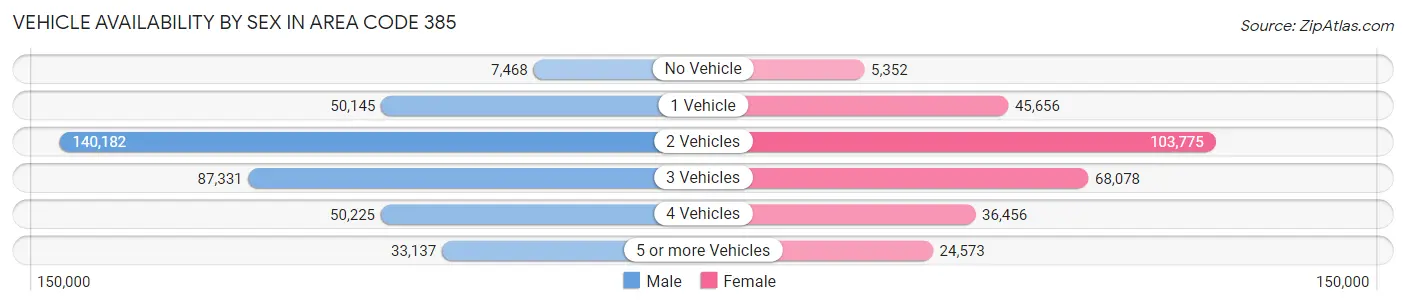
| Vehicles Available | Male | Female |
| No Vehicle | 7,468 (2.0%) | 5,352 (1.9%) |
| 1 Vehicle | 50,145 (13.6%) | 45,656 (16.1%) |
| 2 Vehicles | 140,182 (38.0%) | 103,775 (36.5%) |
| 3 Vehicles | 87,331 (23.7%) | 68,078 (24.0%) |
| 4 Vehicles | 50,225 (13.6%) | 36,456 (12.8%) |
| 5 or more Vehicles | 33,137 (9.0%) | 24,573 (8.7%) |
| Total | 368,488 (100.0%) | 283,890 (100.0%) |
Commute Time in Area Code 385
The most frequently occuring commute durations in Area Code 385 are 15 to 19 minutes (110,016 commuters, 19.4%), 10 to 14 minutes (94,214 commuters, 16.6%), and 20 to 24 minutes (93,505 commuters, 16.5%).
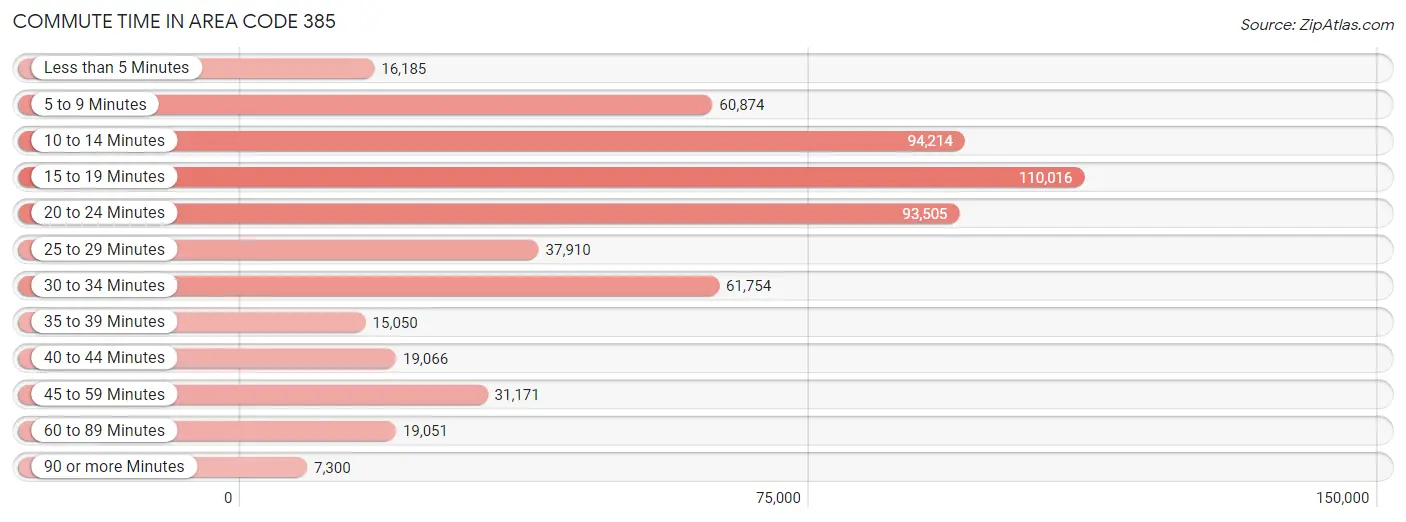
| Commute Time | # Commuters | % Commuters |
| Less than 5 Minutes | 16,185 | 2.9% |
| 5 to 9 Minutes | 60,874 | 10.7% |
| 10 to 14 Minutes | 94,214 | 16.6% |
| 15 to 19 Minutes | 110,016 | 19.4% |
| 20 to 24 Minutes | 93,505 | 16.5% |
| 25 to 29 Minutes | 37,910 | 6.7% |
| 30 to 34 Minutes | 61,754 | 10.9% |
| 35 to 39 Minutes | 15,050 | 2.7% |
| 40 to 44 Minutes | 19,066 | 3.4% |
| 45 to 59 Minutes | 31,171 | 5.5% |
| 60 to 89 Minutes | 19,051 | 3.4% |
| 90 or more Minutes | 7,300 | 1.3% |
Commute Time by Sex in Area Code 385
The most common commute times in Area Code 385 are 15 to 19 minutes (61,332 commuters, 19.0%) for males and 15 to 19 minutes (48,684 commuters, 20.1%) for females.
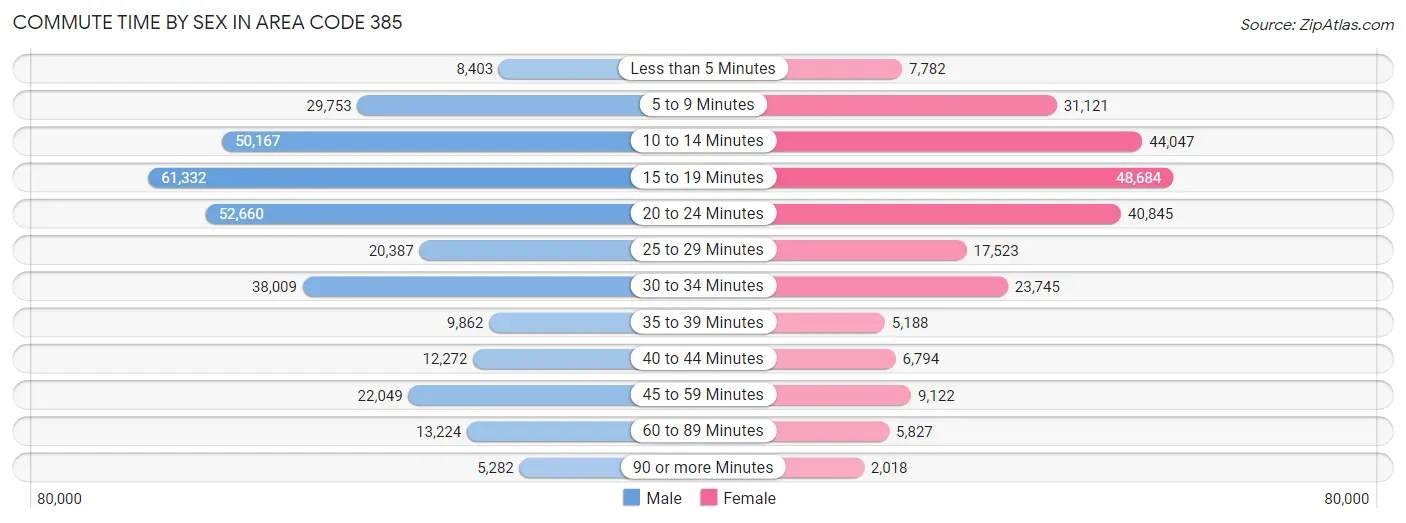
| Commute Time | Male | Female |
| Less than 5 Minutes | 8,403 (2.6%) | 7,782 (3.2%) |
| 5 to 9 Minutes | 29,753 (9.2%) | 31,121 (12.8%) |
| 10 to 14 Minutes | 50,167 (15.5%) | 44,047 (18.1%) |
| 15 to 19 Minutes | 61,332 (19.0%) | 48,684 (20.1%) |
| 20 to 24 Minutes | 52,660 (16.3%) | 40,845 (16.8%) |
| 25 to 29 Minutes | 20,387 (6.3%) | 17,523 (7.2%) |
| 30 to 34 Minutes | 38,009 (11.7%) | 23,745 (9.8%) |
| 35 to 39 Minutes | 9,862 (3.0%) | 5,188 (2.1%) |
| 40 to 44 Minutes | 12,272 (3.8%) | 6,794 (2.8%) |
| 45 to 59 Minutes | 22,049 (6.8%) | 9,122 (3.8%) |
| 60 to 89 Minutes | 13,224 (4.1%) | 5,827 (2.4%) |
| 90 or more Minutes | 5,282 (1.6%) | 2,018 (0.8%) |
Time of Departure to Work by Sex in Area Code 385
The most frequent times of departure to work in Area Code 385 are 7:00 AM to 7:29 AM (38,851, 12.0%) for males and 7:30 AM to 7:59 AM (32,758, 13.5%) for females.
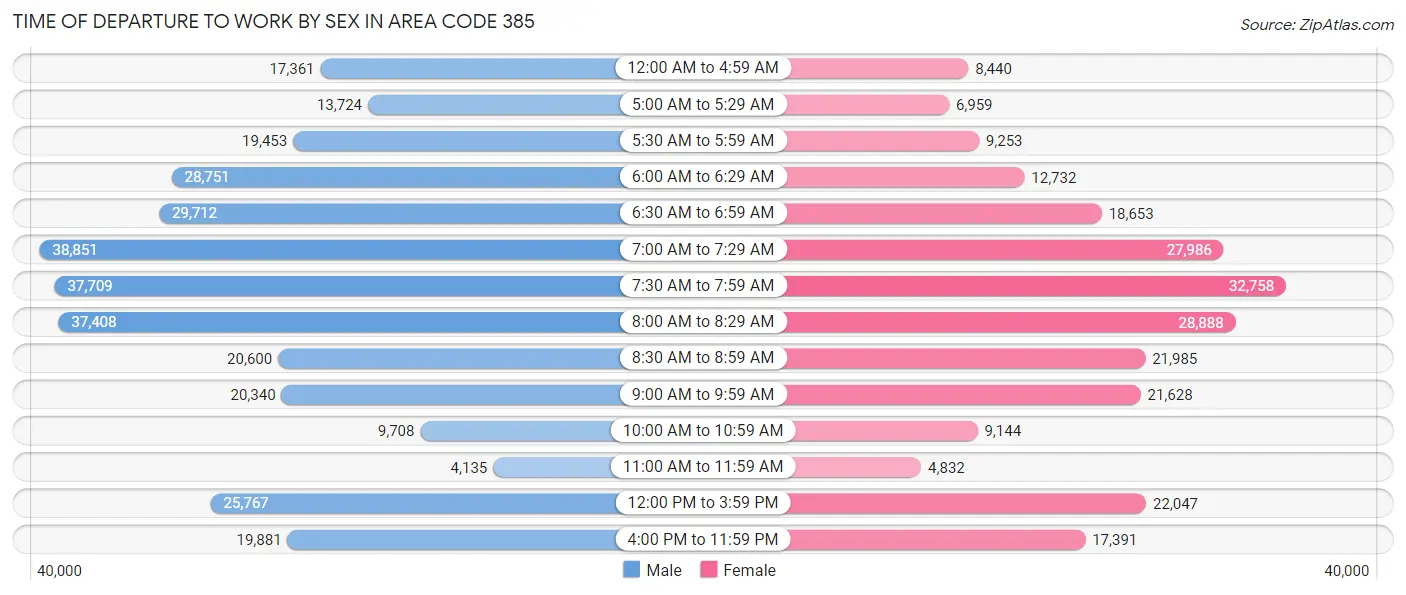
| Time of Departure | Male | Female |
| 12:00 AM to 4:59 AM | 17,361 (5.4%) | 8,440 (3.5%) |
| 5:00 AM to 5:29 AM | 13,724 (4.2%) | 6,959 (2.9%) |
| 5:30 AM to 5:59 AM | 19,453 (6.0%) | 9,253 (3.8%) |
| 6:00 AM to 6:29 AM | 28,751 (8.9%) | 12,732 (5.2%) |
| 6:30 AM to 6:59 AM | 29,712 (9.2%) | 18,653 (7.7%) |
| 7:00 AM to 7:29 AM | 38,851 (12.0%) | 27,986 (11.5%) |
| 7:30 AM to 7:59 AM | 37,709 (11.7%) | 32,758 (13.5%) |
| 8:00 AM to 8:29 AM | 37,408 (11.6%) | 28,888 (11.9%) |
| 8:30 AM to 8:59 AM | 20,600 (6.4%) | 21,985 (9.1%) |
| 9:00 AM to 9:59 AM | 20,340 (6.3%) | 21,628 (8.9%) |
| 10:00 AM to 10:59 AM | 9,708 (3.0%) | 9,144 (3.8%) |
| 11:00 AM to 11:59 AM | 4,135 (1.3%) | 4,832 (2.0%) |
| 12:00 PM to 3:59 PM | 25,767 (8.0%) | 22,047 (9.1%) |
| 4:00 PM to 11:59 PM | 19,881 (6.1%) | 17,391 (7.2%) |
| Total | 323,400 (100.0%) | 242,696 (100.0%) |
Housing Occupancy in Area Code 385
Occupancy by Ownership in Area Code 385
Of the total 420,429 dwellings in Area Code 385, owner-occupied units account for 280,041 (66.6%), while renter-occupied units make up 140,388 (33.4%).
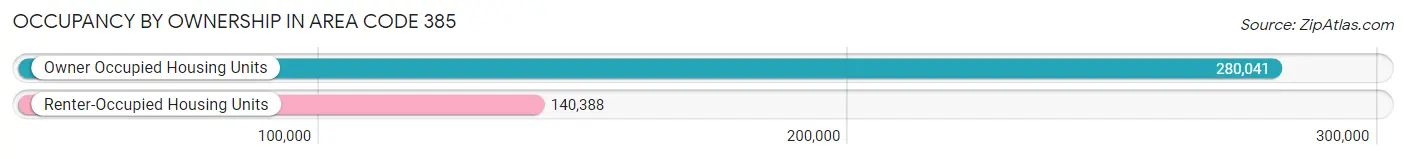
| Occupancy | # Housing Units | % Housing Units |
| Owner Occupied Housing Units | 280,041 | 66.6% |
| Renter-Occupied Housing Units | 140,388 | 33.4% |
| Total Occupied Housing Units | 420,429 | 100.0% |
Occupancy by Household Size in Area Code 385
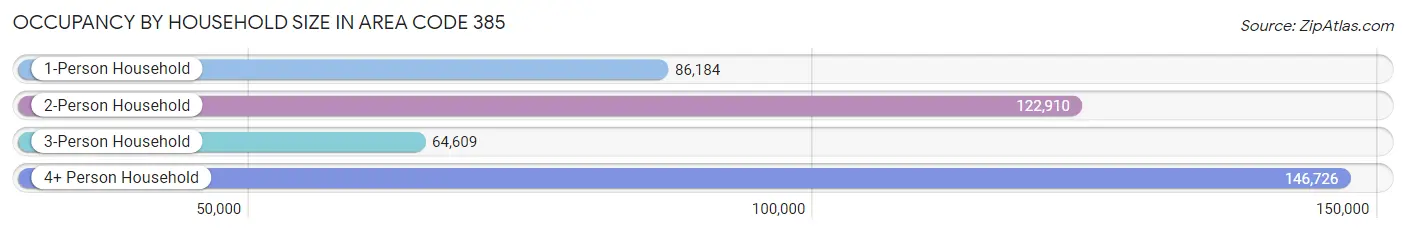
| Household Size | # Housing Units | % Housing Units |
| 1-Person Household | 86,184 | 20.5% |
| 2-Person Household | 122,910 | 29.2% |
| 3-Person Household | 64,609 | 15.4% |
| 4+ Person Household | 146,726 | 34.9% |
| Total Housing Units | 420,429 | 100.0% |
Occupancy by Ownership by Household Size in Area Code 385
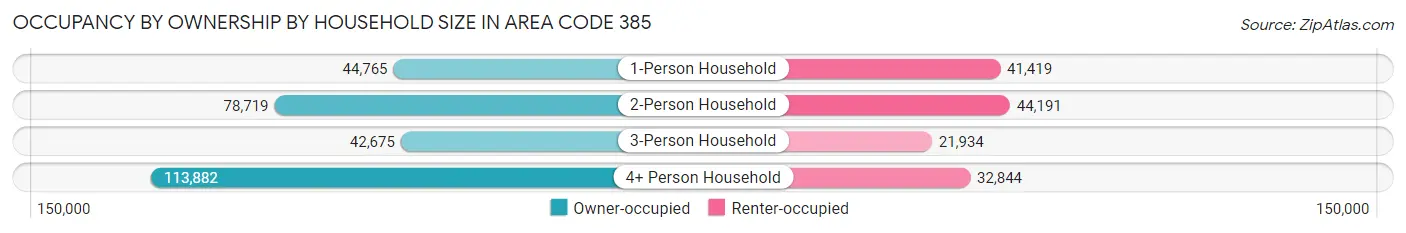
| Household Size | Owner-occupied | Renter-occupied |
| 1-Person Household | 44,765 (51.9%) | 41,419 (48.1%) |
| 2-Person Household | 78,719 (64.0%) | 44,191 (35.9%) |
| 3-Person Household | 42,675 (66.0%) | 21,934 (34.0%) |
| 4+ Person Household | 113,882 (77.6%) | 32,844 (22.4%) |
| Total Housing Units | 280,041 (66.6%) | 140,388 (33.4%) |
Occupancy by Educational Attainment in Area Code 385
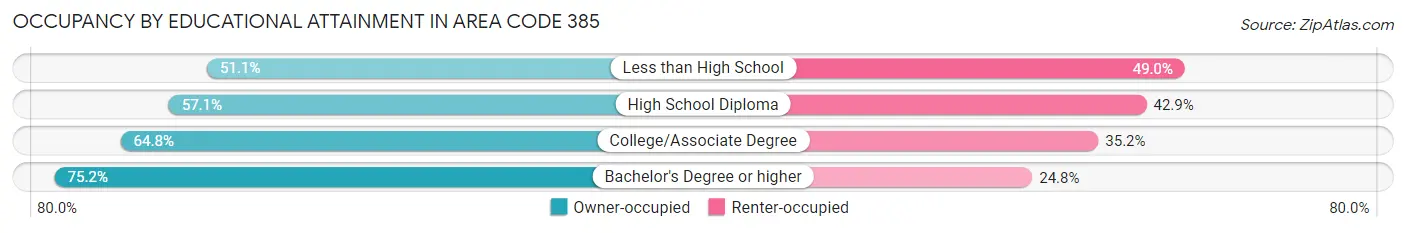
| Household Size | Owner-occupied | Renter-occupied |
| Less than High School | 12,887 (51.0%) | 12,357 (48.9%) |
| High School Diploma | 45,702 (57.1%) | 34,313 (42.9%) |
| College/Associate Degree | 96,838 (64.8%) | 52,698 (35.2%) |
| Bachelor's Degree or higher | 124,614 (75.2%) | 41,020 (24.8%) |
Occupancy by Age of Householder in Area Code 385
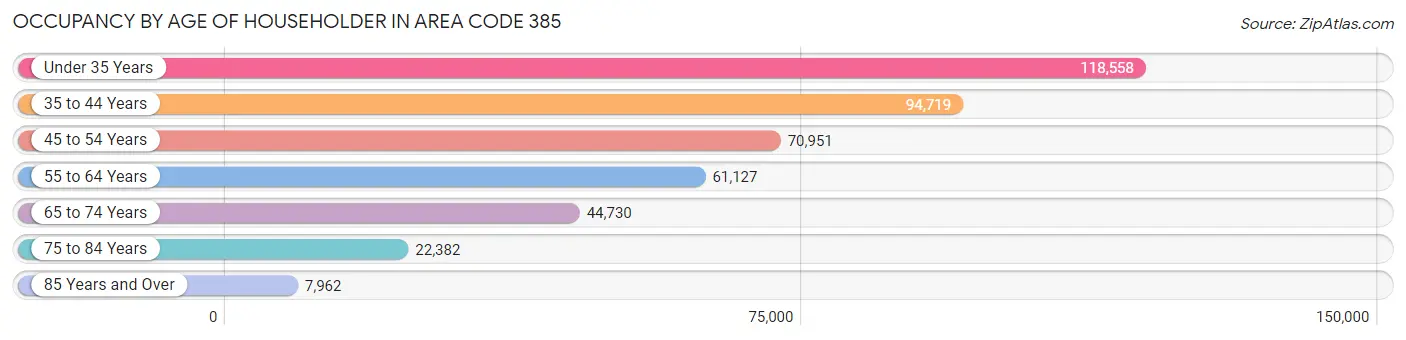
| Age Bracket | # Households | % Households |
| Under 35 Years | 118,558 | 28.2% |
| 35 to 44 Years | 94,719 | 22.5% |
| 45 to 54 Years | 70,951 | 16.9% |
| 55 to 64 Years | 61,127 | 14.5% |
| 65 to 74 Years | 44,730 | 10.6% |
| 75 to 84 Years | 22,382 | 5.3% |
| 85 Years and Over | 7,962 | 1.9% |
| Total | 420,429 | 100.0% |
Housing Finances in Area Code 385
Median Income by Occupancy in Area Code 385
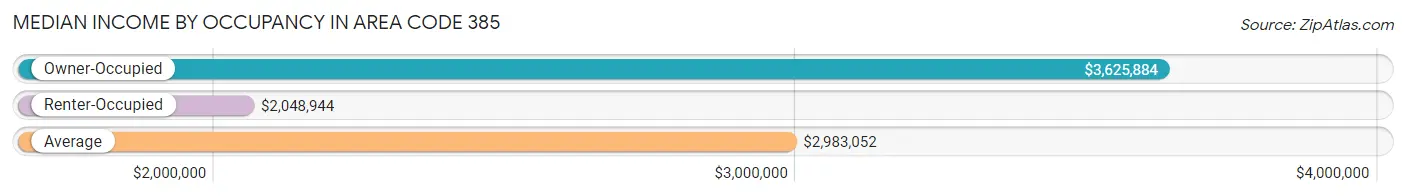
| Occupancy Type | # Households | Median Income |
| Owner-Occupied | 280,041 (66.6%) | $3,625,884 |
| Renter-Occupied | 140,388 (33.4%) | $2,048,944 |
| Average | 420,429 (100.0%) | $2,983,052 |
Occupancy by Householder Income Bracket in Area Code 385
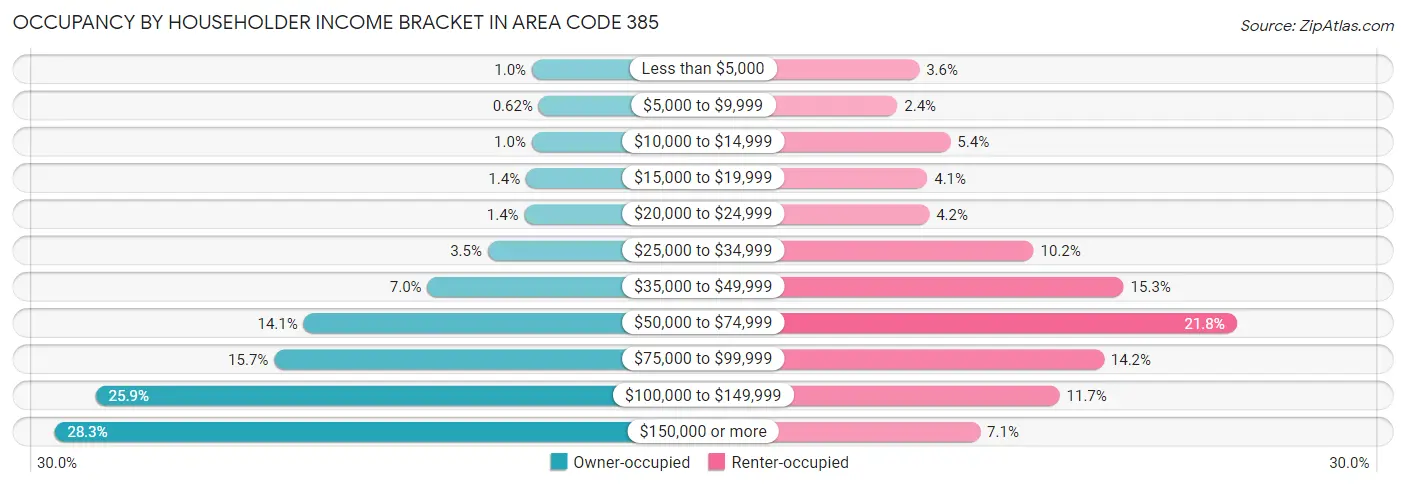
| Income Bracket | Owner-occupied | Renter-occupied |
| Less than $5,000 | 2,839 (1.0%) | 5,105 (3.6%) |
| $5,000 to $9,999 | 1,747 (0.6%) | 3,362 (2.4%) |
| $10,000 to $14,999 | 2,867 (1.0%) | 7,612 (5.4%) |
| $15,000 to $19,999 | 3,775 (1.3%) | 5,757 (4.1%) |
| $20,000 to $24,999 | 4,045 (1.4%) | 5,907 (4.2%) |
| $25,000 to $34,999 | 9,877 (3.5%) | 14,283 (10.2%) |
| $35,000 to $49,999 | 19,542 (7.0%) | 21,508 (15.3%) |
| $50,000 to $74,999 | 39,360 (14.1%) | 30,558 (21.8%) |
| $75,000 to $99,999 | 44,084 (15.7%) | 19,922 (14.2%) |
| $100,000 to $149,999 | 72,654 (25.9%) | 16,374 (11.7%) |
| $150,000 or more | 79,251 (28.3%) | 10,000 (7.1%) |
| Total | 280,041 (100.0%) | 140,388 (100.0%) |
Monthly Housing Cost Tiers in Area Code 385
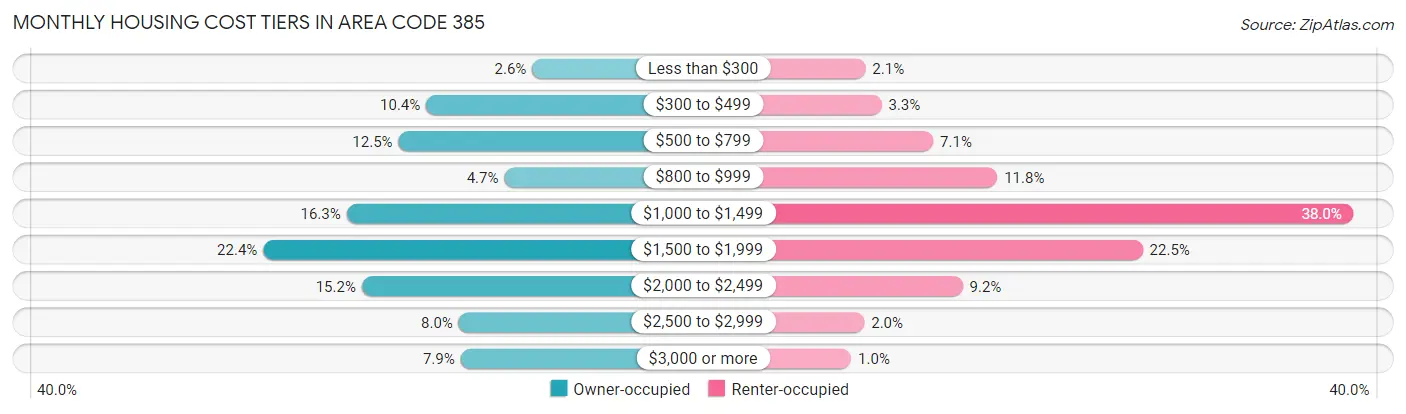
| Monthly Cost | Owner-occupied | Renter-occupied |
| Less than $300 | 7,346 (2.6%) | 2,894 (2.1%) |
| $300 to $499 | 29,206 (10.4%) | 4,568 (3.3%) |
| $500 to $799 | 34,911 (12.5%) | 9,894 (7.0%) |
| $800 to $999 | 13,077 (4.7%) | 16,530 (11.8%) |
| $1,000 to $1,499 | 45,624 (16.3%) | 53,380 (38.0%) |
| $1,500 to $1,999 | 62,819 (22.4%) | 31,555 (22.5%) |
| $2,000 to $2,499 | 42,490 (15.2%) | 12,947 (9.2%) |
| $2,500 to $2,999 | 22,478 (8.0%) | 2,774 (2.0%) |
| $3,000 or more | 22,090 (7.9%) | 1,424 (1.0%) |
| Total | 280,041 (100.0%) | 140,388 (100.0%) |
Physical Housing Characteristics in Area Code 385
Housing Structures in Area Code 385
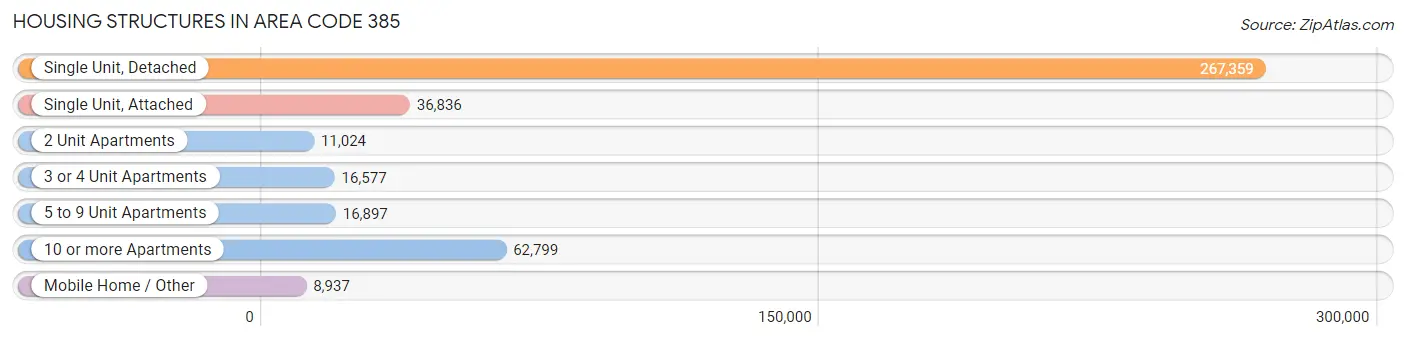
| Structure Type | # Housing Units | % Housing Units |
| Single Unit, Detached | 267,359 | 63.6% |
| Single Unit, Attached | 36,836 | 8.8% |
| 2 Unit Apartments | 11,024 | 2.6% |
| 3 or 4 Unit Apartments | 16,577 | 3.9% |
| 5 to 9 Unit Apartments | 16,897 | 4.0% |
| 10 or more Apartments | 62,799 | 14.9% |
| Mobile Home / Other | 8,937 | 2.1% |
| Total | 420,429 | 100.0% |
Housing Structures by Occupancy in Area Code 385
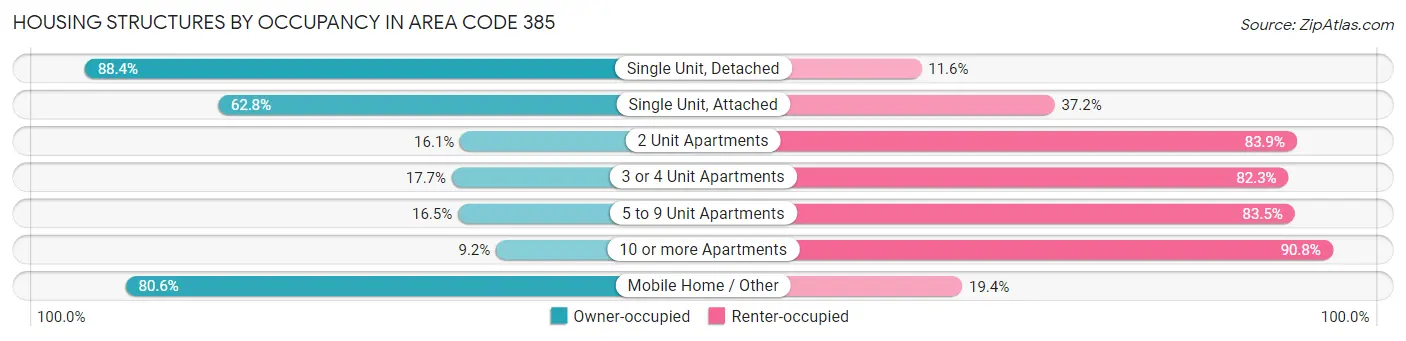
| Structure Type | Owner-occupied | Renter-occupied |
| Single Unit, Detached | 236,406 (88.4%) | 30,953 (11.6%) |
| Single Unit, Attached | 23,127 (62.8%) | 13,709 (37.2%) |
| 2 Unit Apartments | 1,779 (16.1%) | 9,245 (83.9%) |
| 3 or 4 Unit Apartments | 2,941 (17.7%) | 13,636 (82.3%) |
| 5 to 9 Unit Apartments | 2,794 (16.5%) | 14,103 (83.5%) |
| 10 or more Apartments | 5,793 (9.2%) | 57,006 (90.8%) |
| Mobile Home / Other | 7,201 (80.6%) | 1,736 (19.4%) |
| Total | 280,041 (66.6%) | 140,388 (33.4%) |
Housing Structures by Number of Rooms in Area Code 385
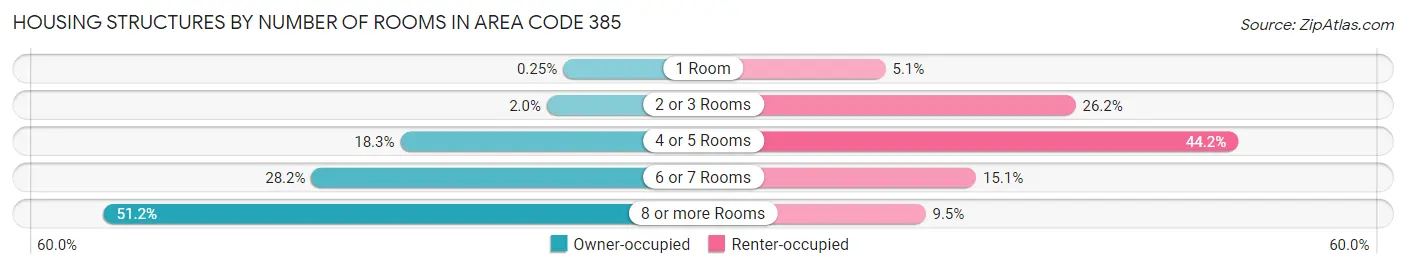
| Number of Rooms | Owner-occupied | Renter-occupied |
| 1 Room | 712 (0.3%) | 7,104 (5.1%) |
| 2 or 3 Rooms | 5,720 (2.0%) | 36,709 (26.2%) |
| 4 or 5 Rooms | 51,241 (18.3%) | 62,022 (44.2%) |
| 6 or 7 Rooms | 78,917 (28.2%) | 21,216 (15.1%) |
| 8 or more Rooms | 143,451 (51.2%) | 13,337 (9.5%) |
| Total | 280,041 (100.0%) | 140,388 (100.0%) |
Housing Structure by Heating Type in Area Code 385
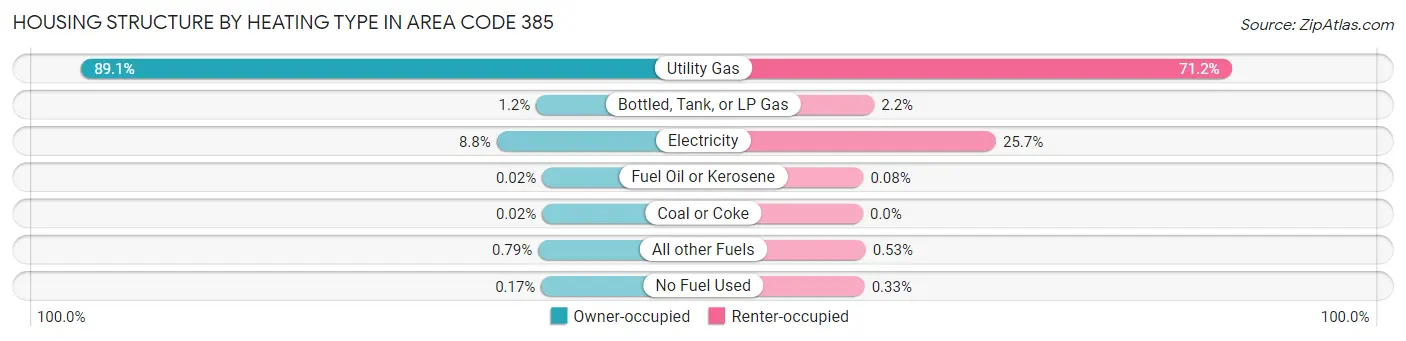
| Heating Type | Owner-occupied | Renter-occupied |
| Utility Gas | 249,382 (89.0%) | 99,911 (71.2%) |
| Bottled, Tank, or LP Gas | 3,243 (1.2%) | 3,073 (2.2%) |
| Electricity | 24,652 (8.8%) | 36,085 (25.7%) |
| Fuel Oil or Kerosene | 52 (0.0%) | 108 (0.1%) |
| Coal or Coke | 43 (0.0%) | 6 (0.0%) |
| All other Fuels | 2,205 (0.8%) | 742 (0.5%) |
| No Fuel Used | 464 (0.2%) | 463 (0.3%) |
| Total | 280,041 (100.0%) | 140,388 (100.0%) |
Household Vehicle Usage in Area Code 385
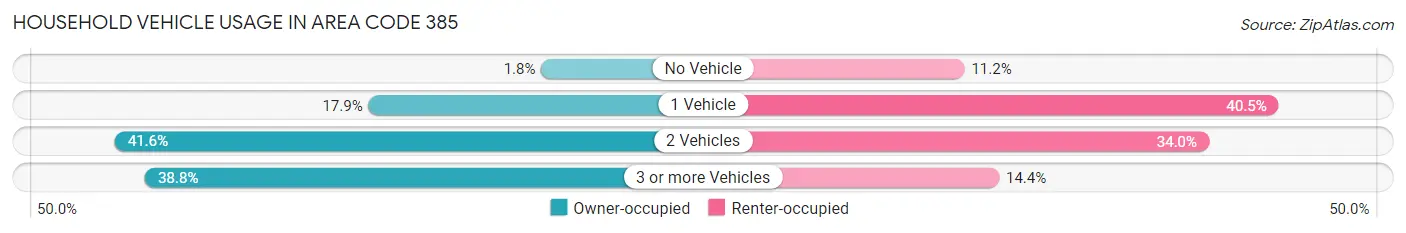
| Vehicles per Household | Owner-occupied | Renter-occupied |
| No Vehicle | 4,965 (1.8%) | 15,670 (11.2%) |
| 1 Vehicle | 50,117 (17.9%) | 56,831 (40.5%) |
| 2 Vehicles | 116,429 (41.6%) | 47,687 (34.0%) |
| 3 or more Vehicles | 108,530 (38.8%) | 20,200 (14.4%) |
| Total | 280,041 (100.0%) | 140,388 (100.0%) |
Real Estate & Mortgages in Area Code 385
Real Estate and Mortgage Overview in Area Code 385
| Characteristic | Without Mortgage | With Mortgage |
| Housing Units | 75,522 | 204,519 |
| Median Property Value | $14,371,700 | $15,003,200 |
| Median Household Income | $2,961,736 | $63,122 |
| Monthly Housing Costs | $18,105 | $21,849 |
| Real Estate Taxes | $80,500 | $4,794 |
Property Value by Mortgage Status in Area Code 385
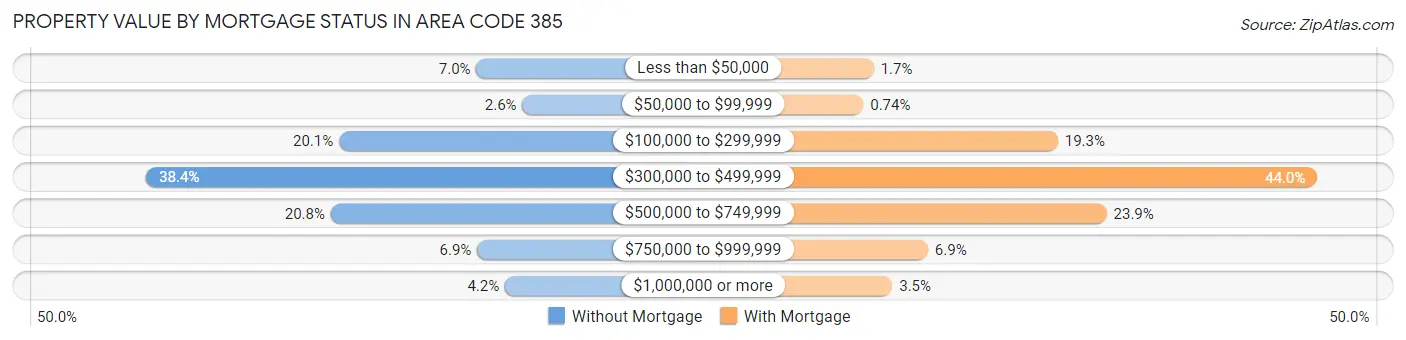
| Property Value | Without Mortgage | With Mortgage |
| Less than $50,000 | 5,265 (7.0%) | 3,535 (1.7%) |
| $50,000 to $99,999 | 1,953 (2.6%) | 1,522 (0.7%) |
| $100,000 to $299,999 | 15,143 (20.1%) | 39,392 (19.3%) |
| $300,000 to $499,999 | 29,016 (38.4%) | 89,921 (44.0%) |
| $500,000 to $749,999 | 15,736 (20.8%) | 48,902 (23.9%) |
| $750,000 to $999,999 | 5,210 (6.9%) | 14,085 (6.9%) |
| $1,000,000 or more | 3,199 (4.2%) | 7,162 (3.5%) |
| Total | 75,522 (100.0%) | 204,519 (100.0%) |
Household Income by Mortgage Status in Area Code 385
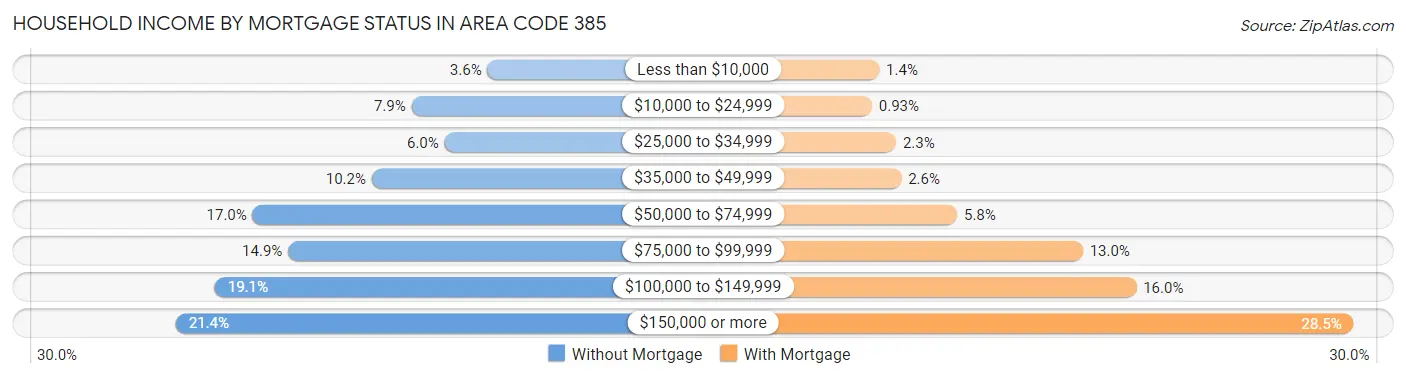
| Household Income | Without Mortgage | With Mortgage |
| Less than $10,000 | 2,678 (3.5%) | 2,761 (1.3%) |
| $10,000 to $24,999 | 5,961 (7.9%) | 1,908 (0.9%) |
| $25,000 to $34,999 | 4,534 (6.0%) | 4,726 (2.3%) |
| $35,000 to $49,999 | 7,671 (10.2%) | 5,343 (2.6%) |
| $50,000 to $74,999 | 12,817 (17.0%) | 11,871 (5.8%) |
| $75,000 to $99,999 | 11,283 (14.9%) | 26,543 (13.0%) |
| $100,000 to $149,999 | 14,449 (19.1%) | 32,801 (16.0%) |
| $150,000 or more | 16,129 (21.4%) | 58,205 (28.5%) |
| Total | 75,522 (100.0%) | 204,519 (100.0%) |
Property Value to Household Income Ratio in Area Code 385
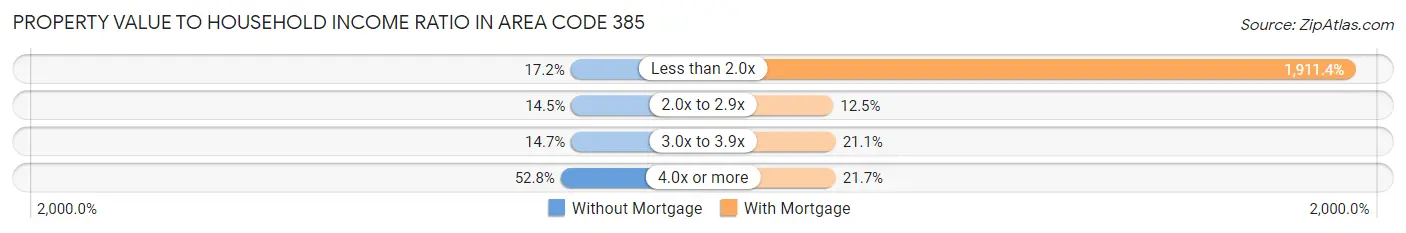
| Value-to-Income Ratio | Without Mortgage | With Mortgage |
| Less than 2.0x | 12,973 (17.2%) | 3,909,160 (1,911.4%) |
| 2.0x to 2.9x | 10,918 (14.5%) | 25,487 (12.5%) |
| 3.0x to 3.9x | 11,106 (14.7%) | 43,066 (21.1%) |
| 4.0x or more | 39,888 (52.8%) | 44,351 (21.7%) |
| Total | 75,522 (100.0%) | 204,519 (100.0%) |
Real Estate Taxes by Mortgage Status in Area Code 385
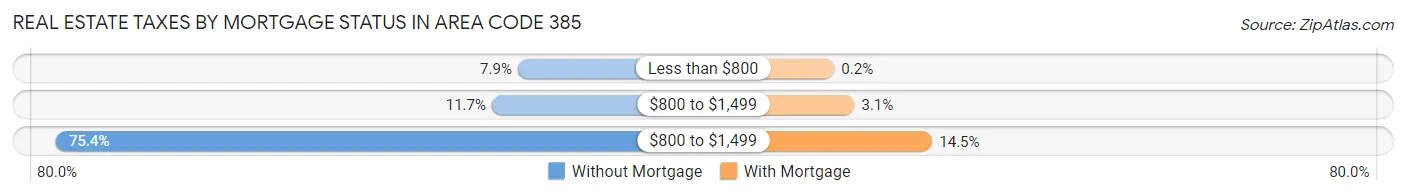
| Property Taxes | Without Mortgage | With Mortgage |
| Less than $800 | 5,999 (7.9%) | 412 (0.2%) |
| $800 to $1,499 | 8,861 (11.7%) | 6,420 (3.1%) |
| $800 to $1,499 | 56,948 (75.4%) | 29,680 (14.5%) |
| Total | 75,522 (100.0%) | 204,519 (100.0%) |
Health & Disability in Area Code 385
Health Insurance Coverage by Age in Area Code 385
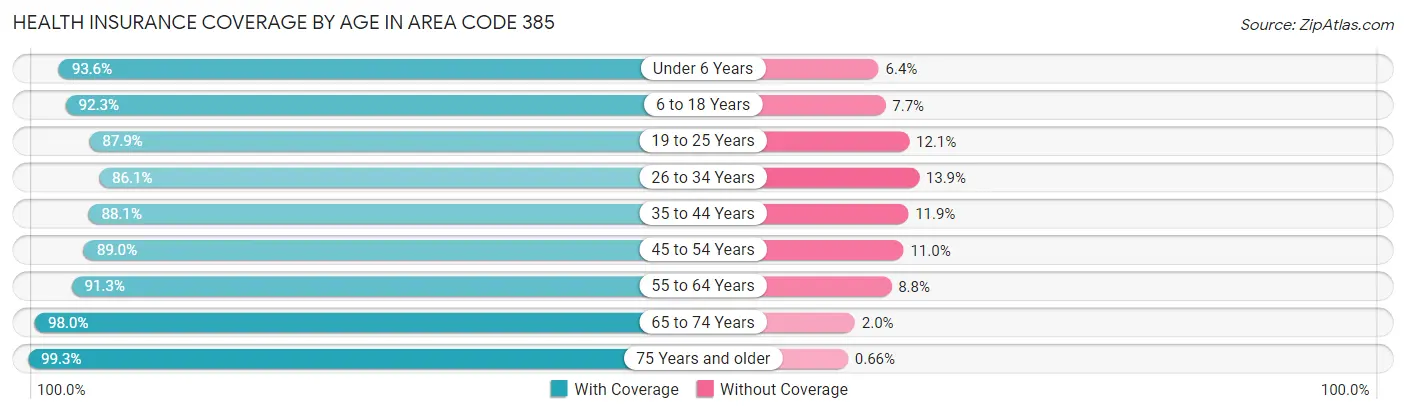
| Age Bracket | With Coverage | Without Coverage |
| Under 6 Years | 117,460 (93.6%) | 8,022 (6.4%) |
| 6 to 18 Years | 265,117 (92.3%) | 21,994 (7.7%) |
| 19 to 25 Years | 147,164 (87.9%) | 20,233 (12.1%) |
| 26 to 34 Years | 156,974 (86.1%) | 25,351 (13.9%) |
| 35 to 44 Years | 161,973 (88.1%) | 21,926 (11.9%) |
| 45 to 54 Years | 120,104 (89.0%) | 14,902 (11.0%) |
| 55 to 64 Years | 101,938 (91.2%) | 9,780 (8.7%) |
| 65 to 74 Years | 73,297 (98.0%) | 1,462 (2.0%) |
| 75 Years and older | 46,687 (99.3%) | 311 (0.7%) |
| Total | 1,190,714 (90.6%) | 123,981 (9.4%) |
Health Insurance Coverage by Citizenship Status in Area Code 385
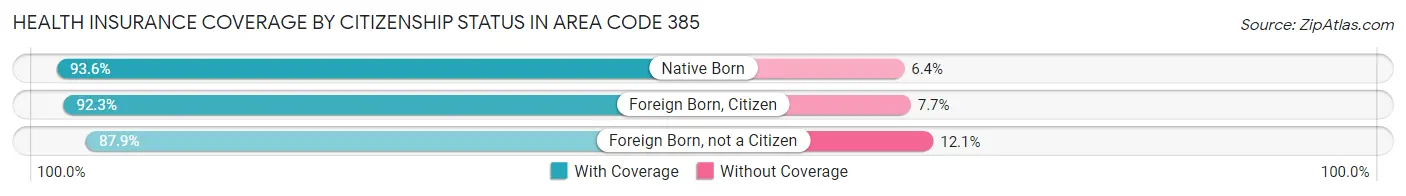
| Citizenship Status | With Coverage | Without Coverage |
| Native Born | 117,460 (93.6%) | 8,022 (6.4%) |
| Foreign Born, Citizen | 265,117 (92.3%) | 21,994 (7.7%) |
| Foreign Born, not a Citizen | 147,164 (87.9%) | 20,233 (12.1%) |
Health Insurance Coverage by Household Income in Area Code 385
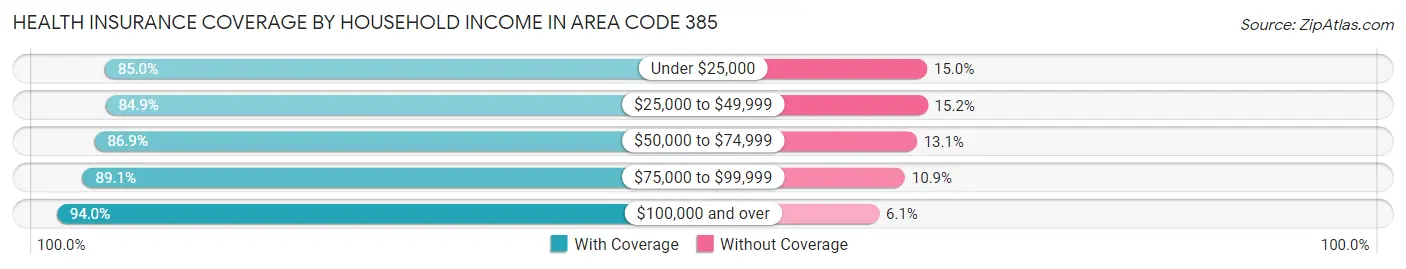
| Household Income | With Coverage | Without Coverage |
| Under $25,000 | 69,042 (85.0%) | 12,221 (15.0%) |
| $25,000 to $49,999 | 127,314 (84.9%) | 22,737 (15.1%) |
| $50,000 to $74,999 | 165,667 (86.9%) | 24,983 (13.1%) |
| $75,000 to $99,999 | 178,125 (89.1%) | 21,736 (10.9%) |
| $100,000 and over | 635,502 (94.0%) | 40,938 (6.0%) |
Public vs Private Health Insurance Coverage by Age in Area Code 385
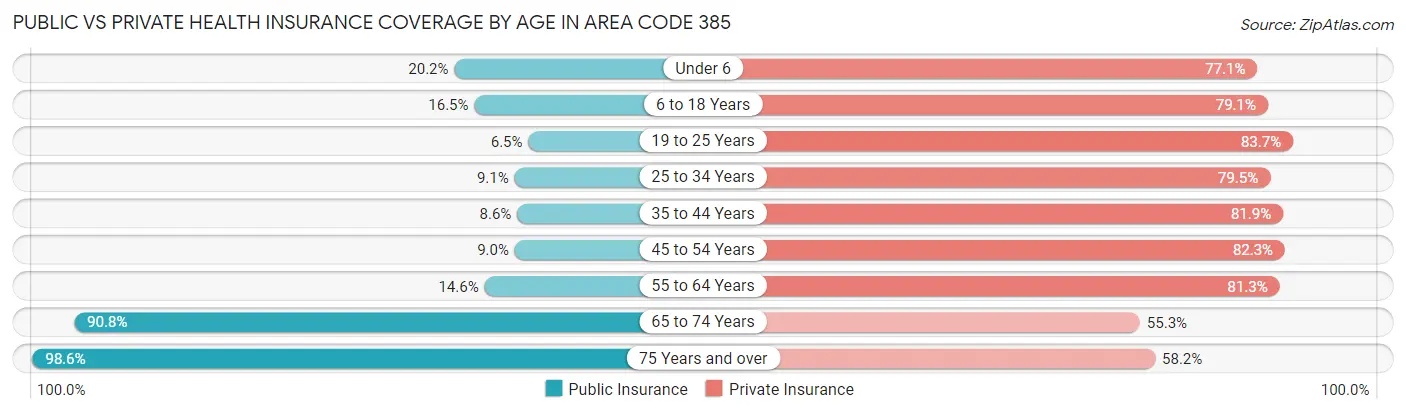
| Age Bracket | Public Insurance | Private Insurance |
| Under 6 | 25,383 (20.2%) | 96,759 (77.1%) |
| 6 to 18 Years | 47,441 (16.5%) | 227,027 (79.1%) |
| 19 to 25 Years | 10,883 (6.5%) | 140,178 (83.7%) |
| 25 to 34 Years | 16,518 (9.1%) | 144,929 (79.5%) |
| 35 to 44 Years | 15,757 (8.6%) | 150,589 (81.9%) |
| 45 to 54 Years | 12,164 (9.0%) | 111,038 (82.3%) |
| 55 to 64 Years | 16,357 (14.6%) | 90,787 (81.3%) |
| 65 to 74 Years | 67,880 (90.8%) | 41,366 (55.3%) |
| 75 Years and over | 46,321 (98.6%) | 27,331 (58.2%) |
| Total | 258,704 (19.7%) | 1,030,004 (78.3%) |
Disability Status by Sex by Age in Area Code 385
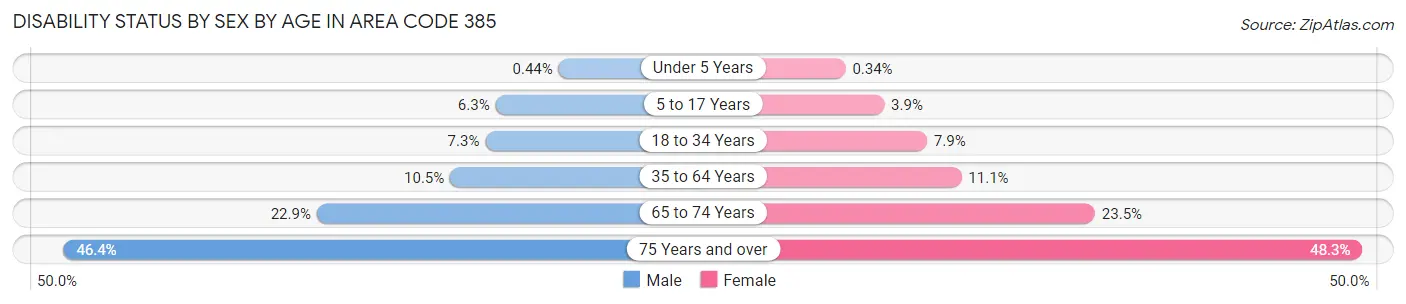
| Age Bracket | Male | Female |
| Under 5 Years | 237 (0.4%) | 171 (0.3%) |
| 5 to 17 Years | 9,227 (6.3%) | 5,419 (3.9%) |
| 18 to 34 Years | 13,743 (7.2%) | 14,551 (7.9%) |
| 35 to 64 Years | 23,232 (10.5%) | 23,260 (11.1%) |
| 65 to 74 Years | 8,310 (22.9%) | 9,032 (23.5%) |
| 75 Years and over | 8,992 (46.4%) | 13,338 (48.3%) |
Disability Class by Sex by Age in Area Code 385
Disability Class: Hearing Difficulty
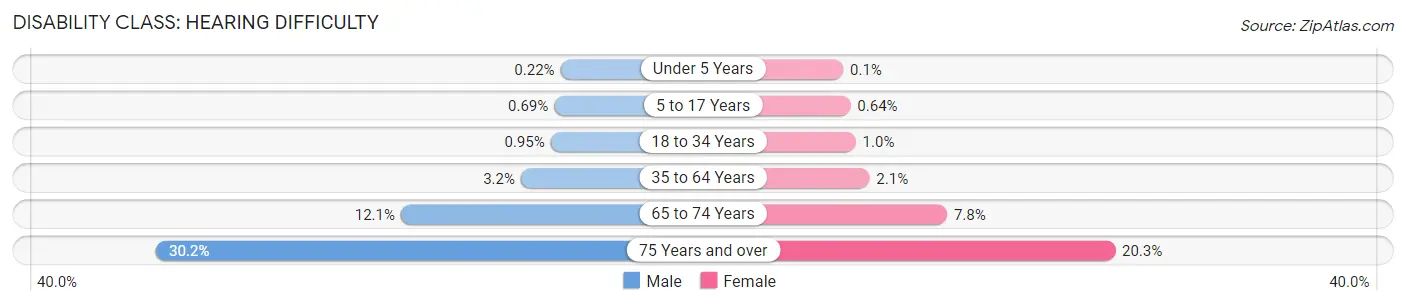
| Age Bracket | Male | Female |
| Under 5 Years | 120 (0.2%) | 49 (0.1%) |
| 5 to 17 Years | 1,009 (0.7%) | 882 (0.6%) |
| 18 to 34 Years | 1,798 (0.9%) | 1,897 (1.0%) |
| 35 to 64 Years | 6,994 (3.2%) | 4,291 (2.1%) |
| 65 to 74 Years | 4,381 (12.1%) | 3,003 (7.8%) |
| 75 Years and over | 5,861 (30.2%) | 5,602 (20.3%) |
Disability Class: Vision Difficulty
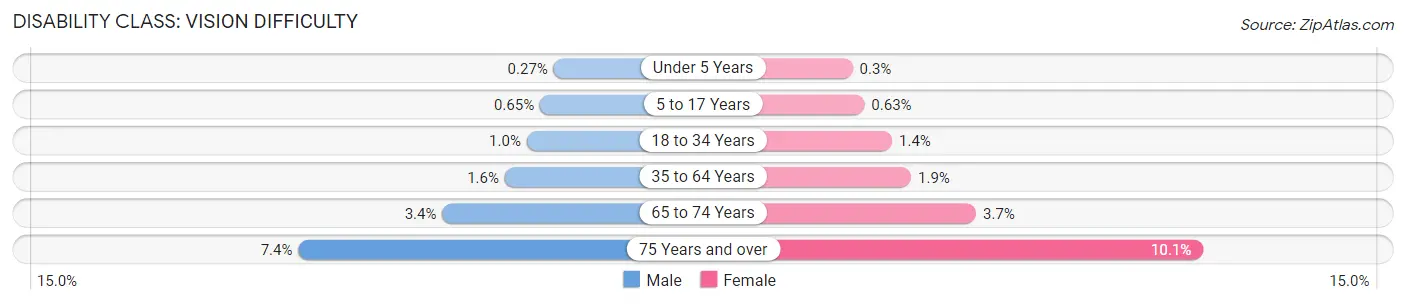
| Age Bracket | Male | Female |
| Under 5 Years | 145 (0.3%) | 150 (0.3%) |
| 5 to 17 Years | 957 (0.6%) | 869 (0.6%) |
| 18 to 34 Years | 1,940 (1.0%) | 2,583 (1.4%) |
| 35 to 64 Years | 3,593 (1.6%) | 4,051 (1.9%) |
| 65 to 74 Years | 1,225 (3.4%) | 1,439 (3.7%) |
| 75 Years and over | 1,430 (7.4%) | 2,777 (10.1%) |
Disability Class: Cognitive Difficulty
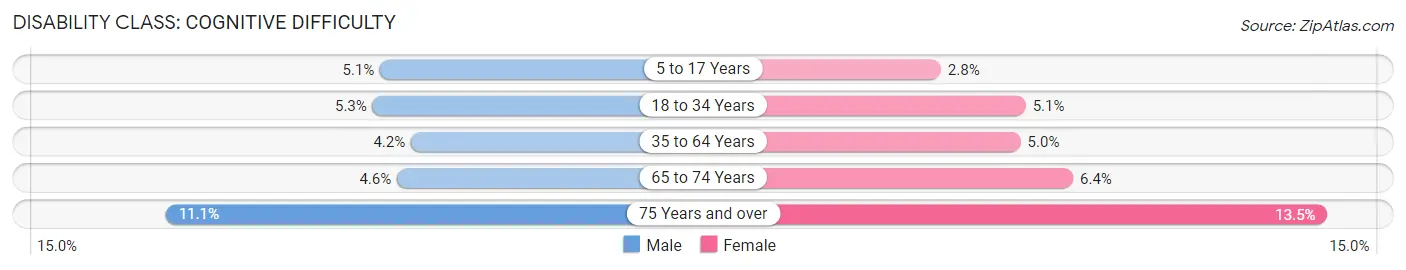
| Age Bracket | Male | Female |
| 5 to 17 Years | 7,475 (5.1%) | 3,804 (2.8%) |
| 18 to 34 Years | 10,071 (5.3%) | 9,435 (5.1%) |
| 35 to 64 Years | 9,370 (4.2%) | 10,432 (5.0%) |
| 65 to 74 Years | 1,680 (4.6%) | 2,477 (6.4%) |
| 75 Years and over | 2,146 (11.1%) | 3,733 (13.5%) |
Disability Class: Ambulatory Difficulty
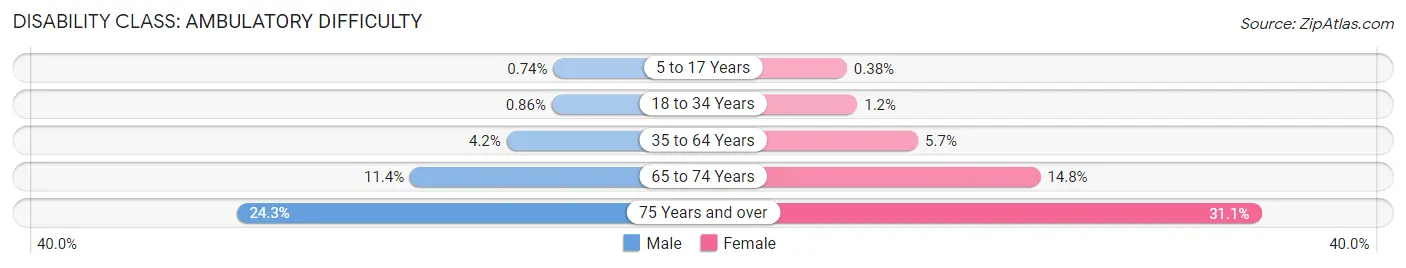
| Age Bracket | Male | Female |
| 5 to 17 Years | 1,081 (0.7%) | 530 (0.4%) |
| 18 to 34 Years | 1,624 (0.9%) | 2,113 (1.1%) |
| 35 to 64 Years | 9,298 (4.2%) | 11,891 (5.7%) |
| 65 to 74 Years | 4,131 (11.4%) | 5,672 (14.7%) |
| 75 Years and over | 4,705 (24.3%) | 8,598 (31.1%) |
Disability Class: Self-Care Difficulty
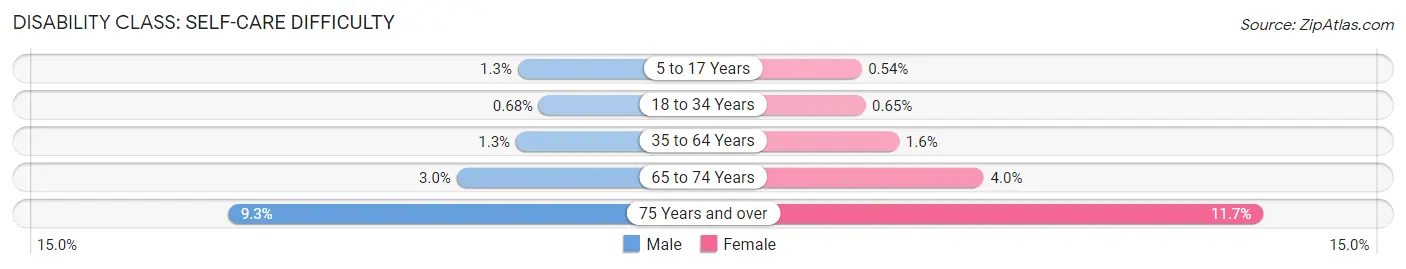
| Age Bracket | Male | Female |
| 5 to 17 Years | 1,859 (1.3%) | 740 (0.5%) |
| 18 to 34 Years | 1,295 (0.7%) | 1,204 (0.6%) |
| 35 to 64 Years | 2,913 (1.3%) | 3,324 (1.6%) |
| 65 to 74 Years | 1,077 (3.0%) | 1,519 (4.0%) |
| 75 Years and over | 1,811 (9.3%) | 3,238 (11.7%) |
Technology Access in Area Code 385
Computing Device Access in Area Code 385
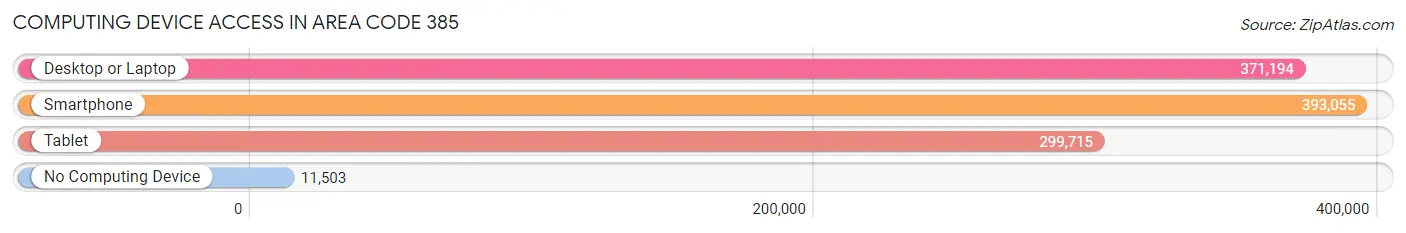
| Device Type | # Households | % Households |
| Desktop or Laptop | 371,194 | 88.3% |
| Smartphone | 393,055 | 93.5% |
| Tablet | 299,715 | 71.3% |
| No Computing Device | 11,503 | 2.7% |
| Total | 420,429 | 100.0% |
Internet Access in Area Code 385
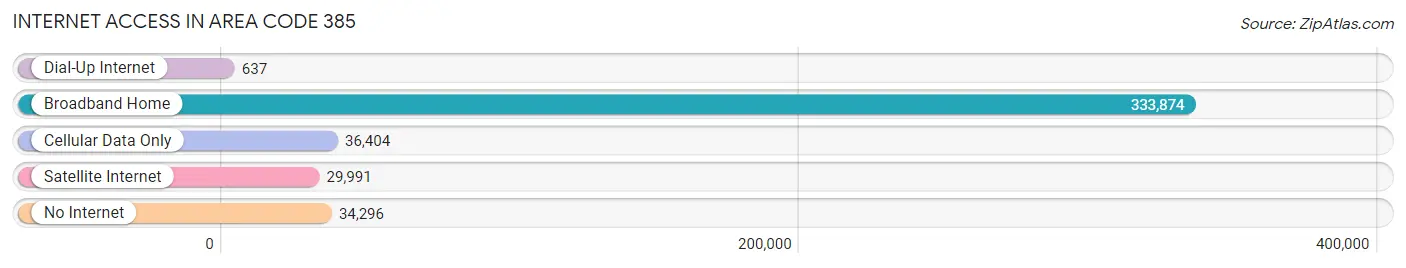
| Internet Type | # Households | % Households |
| Dial-Up Internet | 637 | 0.2% |
| Broadband Home | 333,874 | 79.4% |
| Cellular Data Only | 36,404 | 8.7% |
| Satellite Internet | 29,991 | 7.1% |
| No Internet | 34,296 | 8.2% |
| Total | 420,429 | 100.0% |
Area Code 385 Summary
Geography
Area code 385 is a telephone area code in the North American Numbering Plan (NANP) for the state of Utah. It was created in 1997 as an overlay to area code 801. It covers the Salt Lake City metropolitan area, including the cities of Salt Lake City, West Valley City, Sandy, West Jordan, and South Jordan.
Social
Area code 385 is a vibrant area with a diverse population. It is home to a variety of cultures, religions, and lifestyles. The area is known for its outdoor activities, such as skiing, snowboarding, and hiking. It is also home to a number of universities, including the University of Utah and Brigham Young University.
Economics
Area code 385 is an economically prosperous area. It is home to a number of large companies, such as Goldman Sachs, eBay, and Adobe. The area is also home to a number of start-ups and small businesses. The area is known for its high-tech industry, and is home to a number of research and development centers.
Demographics
Area code 385 is home to a diverse population. According to the 2010 census, the population of the area was 1,073,818. The population is made up of a variety of ethnicities, including White (63.2%), Hispanic or Latino (17.2%), African American (4.3%), Asian (4.2%), and Native American (1.2%). The median household income in the area is $63,902.
Common Questions
What is Per Capita Income in Area Code 385?
Per Capita income in Area Code 385 is $36,322.
What is the Median Family Income in Area Code 385?
Median Family Income in Area Code 385 is $100,640.
What is the Median Household income in Area Code 385?
Median Household Income in Area Code 385 is $87,737.
What is Income or Wage Gap in Area Code 385?
Income or Wage Gap in Area Code 385 is 39.5%.
Women in Area Code 385 earn 60.5 cents for every dollar earned by a man.
What is Family Income Deficit in Area Code 385?
Family Income Deficit in Area Code 385 is $10,800.
Families that are below poverty line in Area Code 385 earn $10,800 less on average than the poverty threshold level.
What is Inequality or Gini Index in Area Code 385?
Inequality or Gini Index in Area Code 385 is 14.21.
What is the Total Population of Area Code 385?
Total Population of Area Code 385 is 1,323,881.
What is the Total Male Population of Area Code 385?
Total Male Population of Area Code 385 is 673,090.
What is the Total Female Population of Area Code 385?
Total Female Population of Area Code 385 is 650,791.
What is the Ratio of Males per 100 Females in Area Code 385?
There are 103.43 Males per 100 Females in Area Code 385.
What is the Ratio of Females per 100 Males in Area Code 385?
There are 96.69 Females per 100 Males in Area Code 385.
What is the Median Population Age in Area Code 385?
Median Population Age in Area Code 385 is 30.4 Years.
What is the Average Family Size in Area Code 385
Average Family Size in Area Code 385 is 3.5 People.
What is the Average Household Size in Area Code 385
Average Household Size in Area Code 385 is 3.1 People.
How Large is the Labor Force in Area Code 385?
There are 690,812 People in the Labor Forcein in Area Code 385.
What is the Percentage of People in the Labor Force in Area Code 385?
70.7% of People are in the Labor Force in Area Code 385.
What is the Unemployment Rate in Area Code 385?
Unemployment Rate in Area Code 385 is 3.8%.