Zip Codes with the Highest Percentage of Population Employed in Accommodation & Food Services in Hurst, TX
RELATED REPORTS & OPTIONS
Accommodation & Food Services
Hurst
Compare Zip Codes
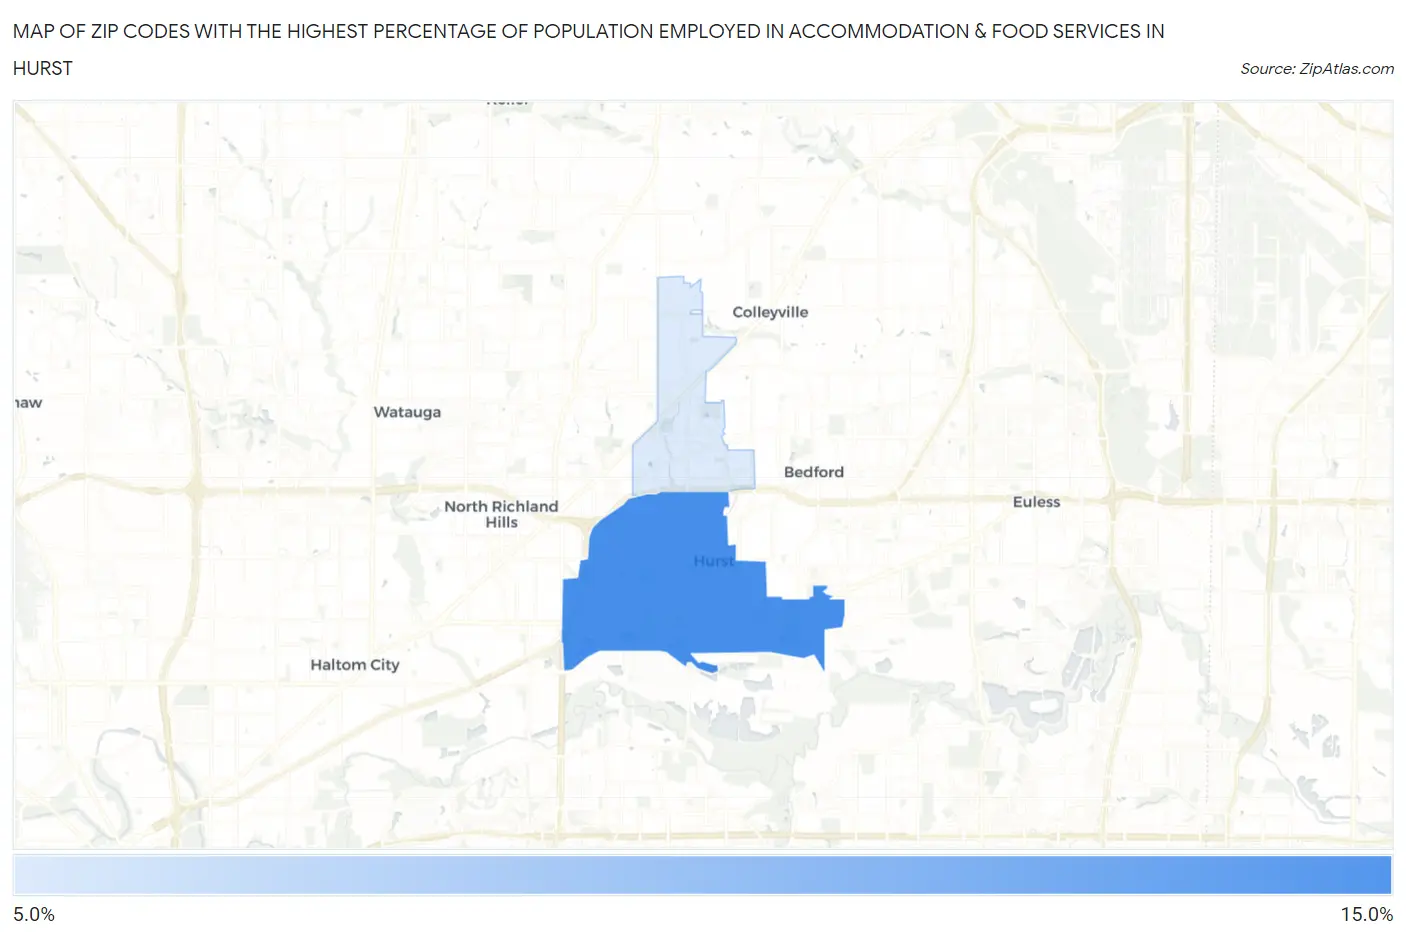
Map of Zip Codes with the Highest Percentage of Population Employed in Accommodation & Food Services in Hurst
6.2%
11.4%
Zip Codes with the Highest Percentage of Population Employed in Accommodation & Food Services in Hurst, TX
| Zip Code | % Employed | vs State | vs National | |
| 1. | 76053 | 11.4% | 7.2%(+4.18)#194 | 6.9%(+4.51)#3,242 |
| 2. | 76054 | 6.2% | 7.2%(-0.962)#873 | 6.9%(-0.637)#12,662 |
1
Common Questions
What are the Top Zip Codes with the Highest Percentage of Population Employed in Accommodation & Food Services in Hurst, TX?
Top Zip Codes with the Highest Percentage of Population Employed in Accommodation & Food Services in Hurst, TX are:
What zip code has the Highest Percentage of Population Employed in Accommodation & Food Services in Hurst, TX?
76053 has the Highest Percentage of Population Employed in Accommodation & Food Services in Hurst, TX with 11.4%.
What is the Percentage of Population Employed in Accommodation & Food Services in Hurst, TX?
Percentage of Population Employed in Accommodation & Food Services in Hurst is 10.3%.
What is the Percentage of Population Employed in Accommodation & Food Services in Texas?
Percentage of Population Employed in Accommodation & Food Services in Texas is 7.2%.
What is the Percentage of Population Employed in Accommodation & Food Services in the United States?
Percentage of Population Employed in Accommodation & Food Services in the United States is 6.9%.