Zip Codes with the Highest Percentage of Population Employed in Accommodation & Food Services in Tyler, TX
RELATED REPORTS & OPTIONS
Accommodation & Food Services
Tyler
Compare Zip Codes
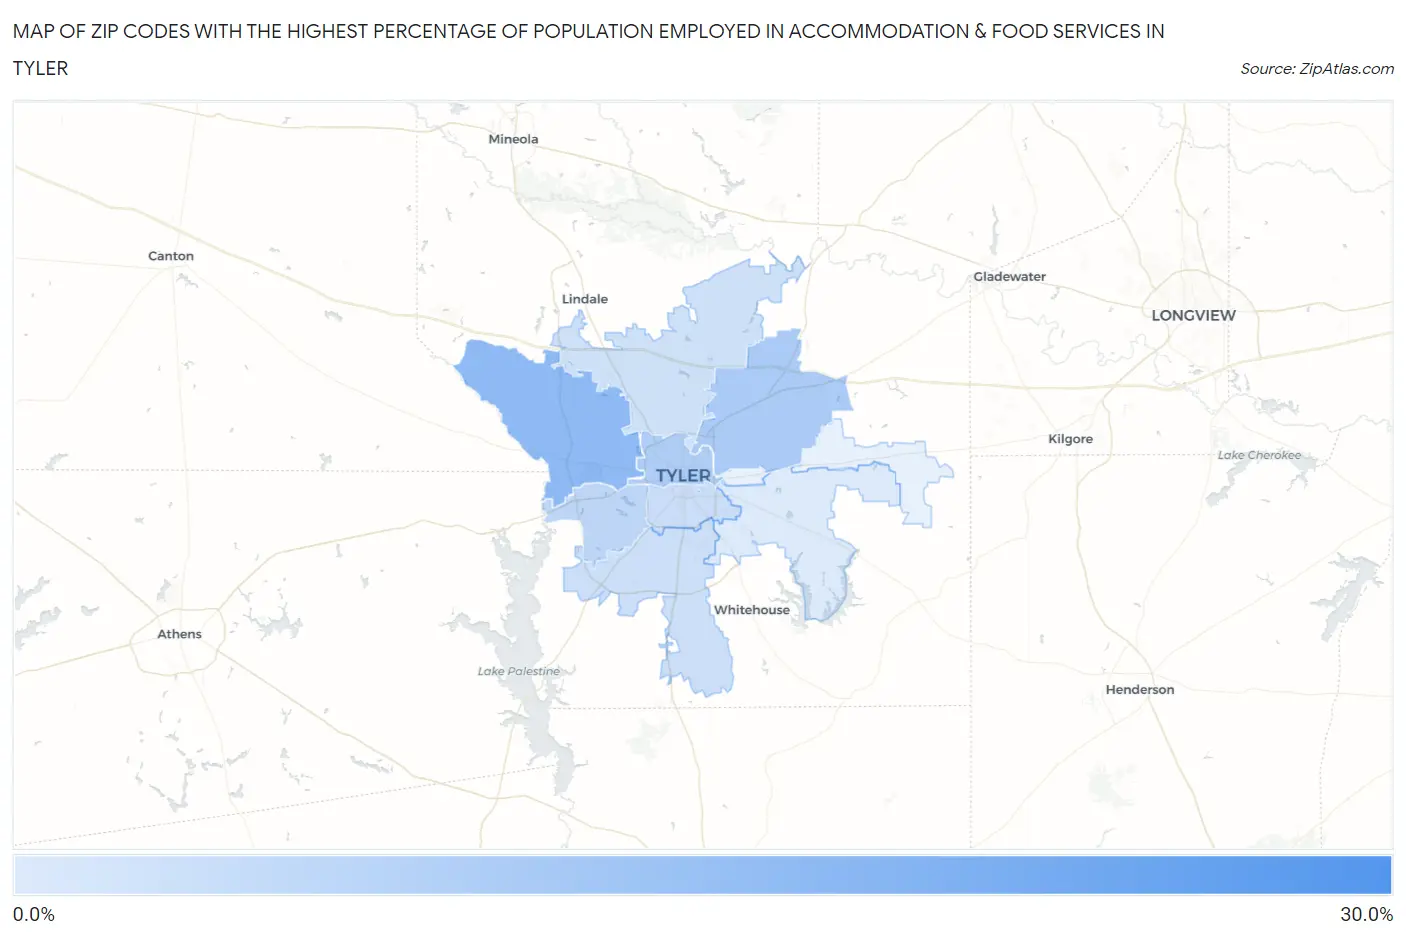
Map of Zip Codes with the Highest Percentage of Population Employed in Accommodation & Food Services in Tyler
4.7%
27.8%
Zip Codes with the Highest Percentage of Population Employed in Accommodation & Food Services in Tyler, TX
| Zip Code | % Employed | vs State | vs National | |
| 1. | 75711 | 27.8% | 7.2%(+20.6)#22 | 6.9%(+20.9)#390 |
| 2. | 75704 | 16.3% | 7.2%(+9.06)#70 | 6.9%(+9.39)#1,397 |
| 3. | 75708 | 11.9% | 7.2%(+4.66)#174 | 6.9%(+4.99)#2,923 |
| 4. | 75702 | 11.5% | 7.2%(+4.26)#192 | 6.9%(+4.59)#3,182 |
| 5. | 75709 | 9.2% | 7.2%(+1.97)#377 | 6.9%(+2.30)#5,683 |
| 6. | 75701 | 7.3% | 7.2%(+0.058)#682 | 6.9%(+0.383)#9,634 |
| 7. | 75703 | 7.0% | 7.2%(-0.209)#718 | 6.9%(+0.116)#10,321 |
| 8. | 75706 | 6.8% | 7.2%(-0.439)#770 | 6.9%(-0.114)#10,996 |
| 9. | 75707 | 4.7% | 7.2%(-2.47)#1,147 | 6.9%(-2.15)#17,704 |
1
Common Questions
What are the Top 5 Zip Codes with the Highest Percentage of Population Employed in Accommodation & Food Services in Tyler, TX?
Top 5 Zip Codes with the Highest Percentage of Population Employed in Accommodation & Food Services in Tyler, TX are:
What zip code has the Highest Percentage of Population Employed in Accommodation & Food Services in Tyler, TX?
75711 has the Highest Percentage of Population Employed in Accommodation & Food Services in Tyler, TX with 27.8%.
What is the Percentage of Population Employed in Accommodation & Food Services in Tyler, TX?
Percentage of Population Employed in Accommodation & Food Services in Tyler is 7.8%.
What is the Percentage of Population Employed in Accommodation & Food Services in Texas?
Percentage of Population Employed in Accommodation & Food Services in Texas is 7.2%.
What is the Percentage of Population Employed in Accommodation & Food Services in the United States?
Percentage of Population Employed in Accommodation & Food Services in the United States is 6.9%.