Zip Codes with the Highest Percentage of Population Employed in Accommodation & Food Services in Kingwood, TX
RELATED REPORTS & OPTIONS
Accommodation & Food Services
Kingwood
Compare Zip Codes
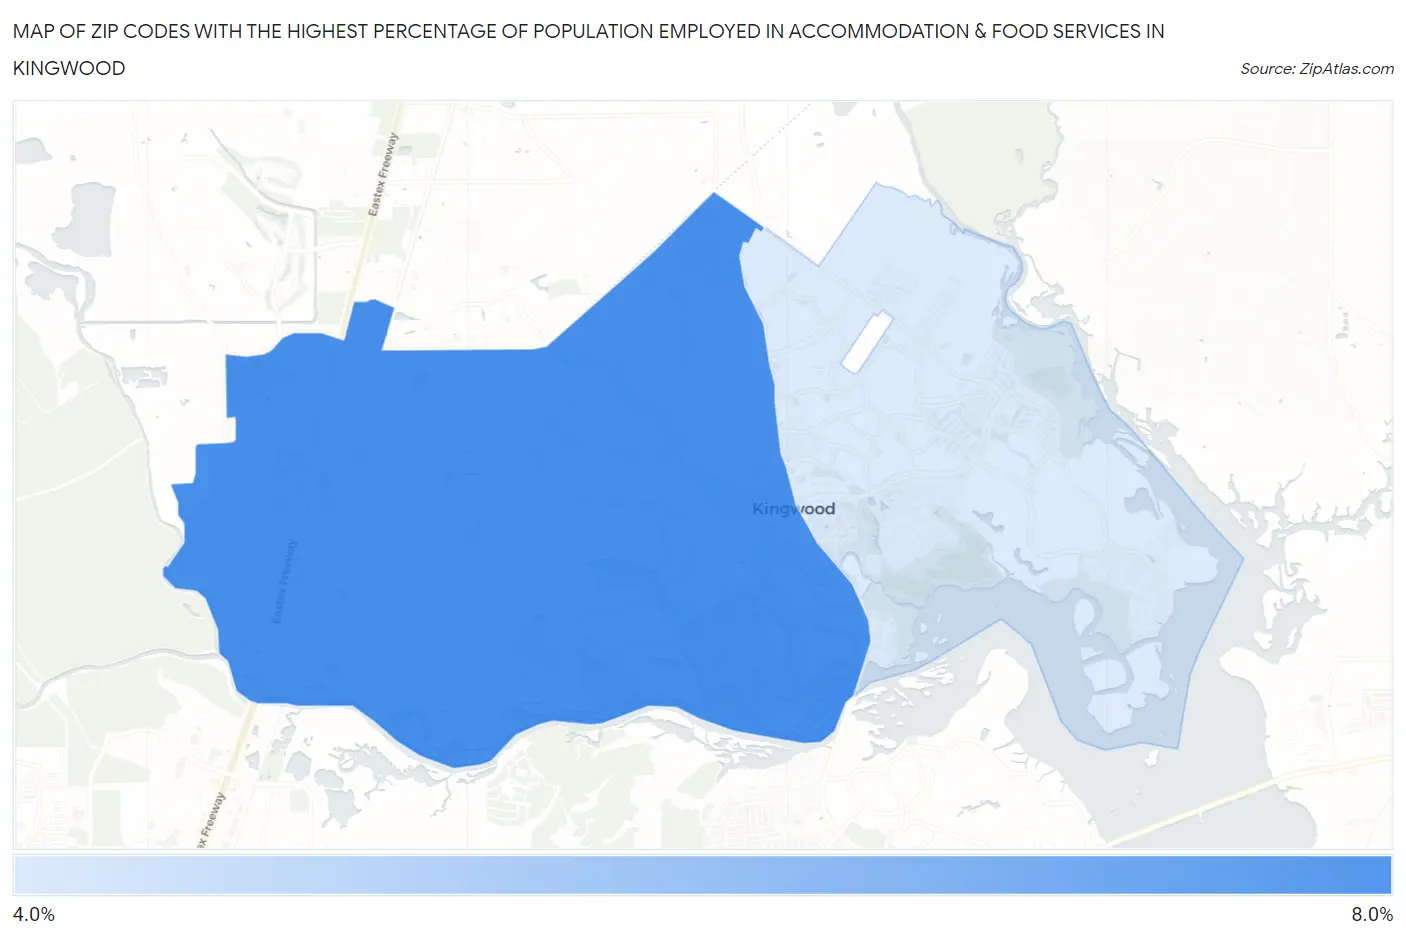
Map of Zip Codes with the Highest Percentage of Population Employed in Accommodation & Food Services in Kingwood
4.4%
6.6%
Zip Codes with the Highest Percentage of Population Employed in Accommodation & Food Services in Kingwood, TX
| Zip Code | % Employed | vs State | vs National | |
| 1. | 77339 | 6.6% | 7.2%(-0.644)#807 | 6.9%(-0.319)#11,646 |
| 2. | 77345 | 4.4% | 7.2%(-2.77)#1,202 | 6.9%(-2.44)#18,708 |
1
Common Questions
What are the Top Zip Codes with the Highest Percentage of Population Employed in Accommodation & Food Services in Kingwood, TX?
Top Zip Codes with the Highest Percentage of Population Employed in Accommodation & Food Services in Kingwood, TX are:
What zip code has the Highest Percentage of Population Employed in Accommodation & Food Services in Kingwood, TX?
77339 has the Highest Percentage of Population Employed in Accommodation & Food Services in Kingwood, TX with 6.6%.
What is the Percentage of Population Employed in Accommodation & Food Services in Texas?
Percentage of Population Employed in Accommodation & Food Services in Texas is 7.2%.
What is the Percentage of Population Employed in Accommodation & Food Services in the United States?
Percentage of Population Employed in Accommodation & Food Services in the United States is 6.9%.