Zip Codes with the Highest Percentage of Population Employed in Accommodation & Food Services in Edinburg, TX
RELATED REPORTS & OPTIONS
Accommodation & Food Services
Edinburg
Compare Zip Codes
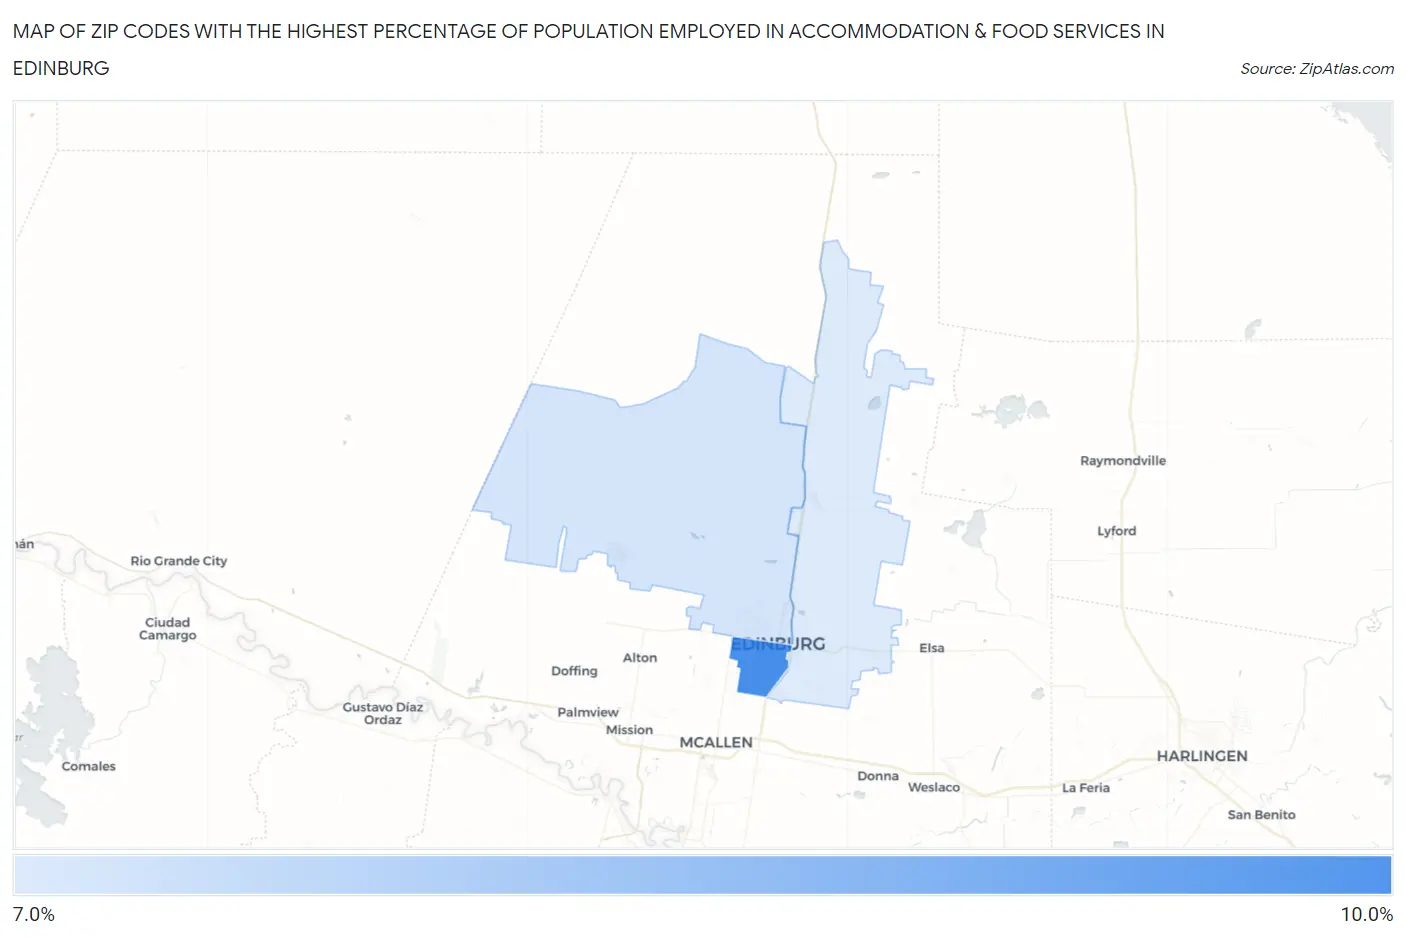
Map of Zip Codes with the Highest Percentage of Population Employed in Accommodation & Food Services in Edinburg
7.4%
9.4%
Zip Codes with the Highest Percentage of Population Employed in Accommodation & Food Services in Edinburg, TX
| Zip Code | % Employed | vs State | vs National | |
| 1. | 78539 | 9.4% | 7.2%(+2.20)#350 | 6.9%(+2.52)#5,347 |
| 2. | 78541 | 7.6% | 7.2%(+0.352)#626 | 6.9%(+0.677)#8,840 |
| 3. | 78542 | 7.4% | 7.2%(+0.227)#641 | 6.9%(+0.552)#9,161 |
1
Common Questions
What are the Top Zip Codes with the Highest Percentage of Population Employed in Accommodation & Food Services in Edinburg, TX?
Top Zip Codes with the Highest Percentage of Population Employed in Accommodation & Food Services in Edinburg, TX are:
What zip code has the Highest Percentage of Population Employed in Accommodation & Food Services in Edinburg, TX?
78539 has the Highest Percentage of Population Employed in Accommodation & Food Services in Edinburg, TX with 9.4%.
What is the Percentage of Population Employed in Accommodation & Food Services in Edinburg, TX?
Percentage of Population Employed in Accommodation & Food Services in Edinburg is 9.2%.
What is the Percentage of Population Employed in Accommodation & Food Services in Texas?
Percentage of Population Employed in Accommodation & Food Services in Texas is 7.2%.
What is the Percentage of Population Employed in Accommodation & Food Services in the United States?
Percentage of Population Employed in Accommodation & Food Services in the United States is 6.9%.