Zip Codes with the Highest Percentage of Population Employed in Accommodation & Food Services in Magnolia, TX
RELATED REPORTS & OPTIONS
Accommodation & Food Services
Magnolia
Compare Zip Codes
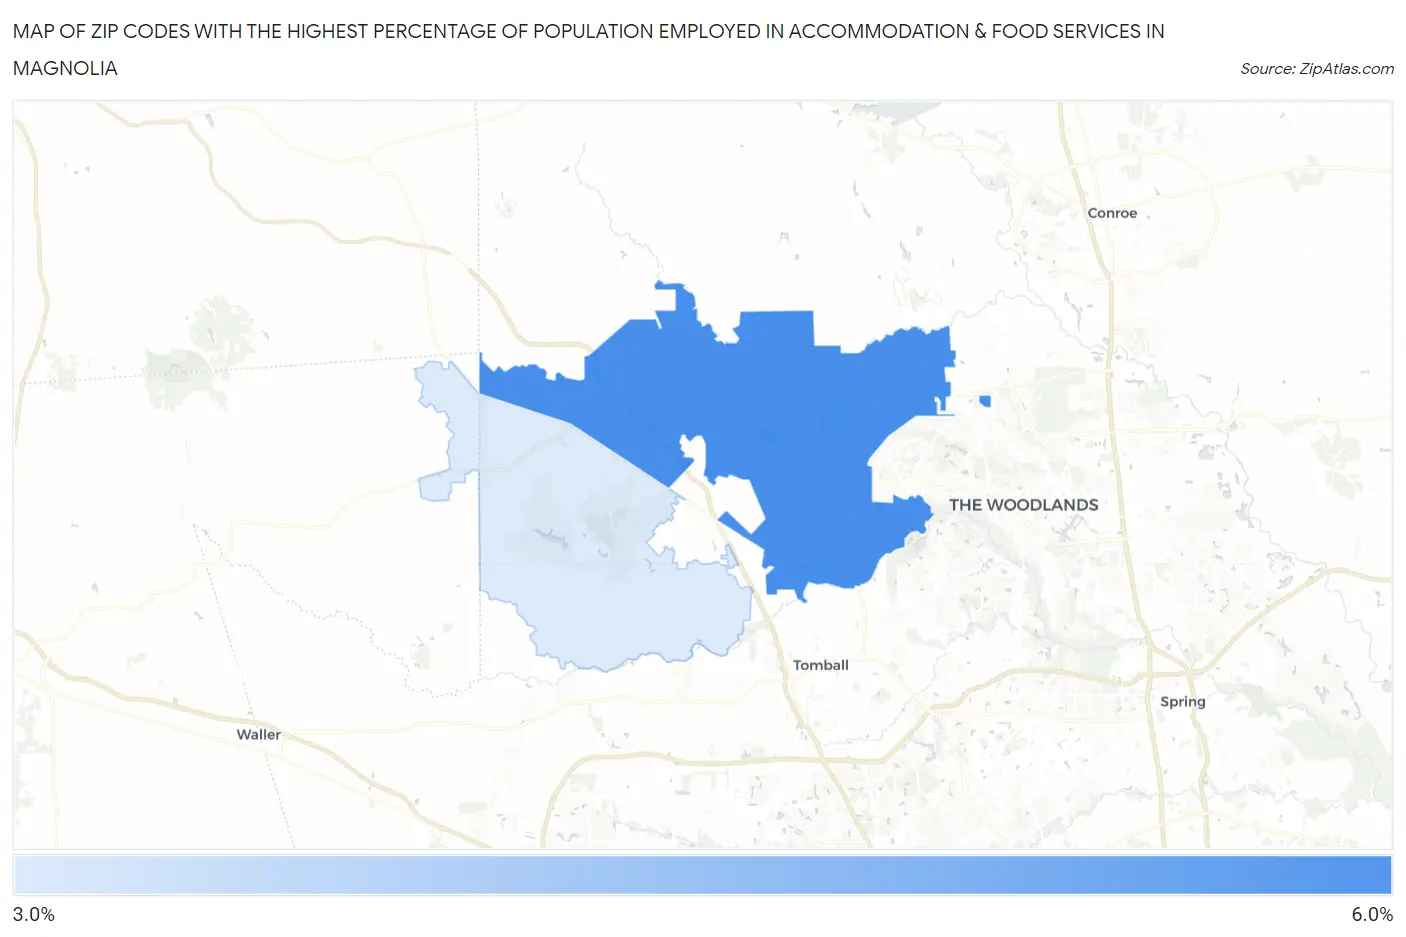
Map of Zip Codes with the Highest Percentage of Population Employed in Accommodation & Food Services in Magnolia
3.9%
5.1%
Zip Codes with the Highest Percentage of Population Employed in Accommodation & Food Services in Magnolia, TX
| Zip Code | % Employed | vs State | vs National | |
| 1. | 77354 | 5.1% | 7.2%(-2.09)#1,062 | 6.9%(-1.76)#16,400 |
| 2. | 77355 | 3.9% | 7.2%(-3.32)#1,286 | 6.9%(-3.00)#20,527 |
1
Common Questions
What are the Top Zip Codes with the Highest Percentage of Population Employed in Accommodation & Food Services in Magnolia, TX?
Top Zip Codes with the Highest Percentage of Population Employed in Accommodation & Food Services in Magnolia, TX are:
What zip code has the Highest Percentage of Population Employed in Accommodation & Food Services in Magnolia, TX?
77354 has the Highest Percentage of Population Employed in Accommodation & Food Services in Magnolia, TX with 5.1%.
What is the Percentage of Population Employed in Accommodation & Food Services in Magnolia, TX?
Percentage of Population Employed in Accommodation & Food Services in Magnolia is 5.0%.
What is the Percentage of Population Employed in Accommodation & Food Services in Texas?
Percentage of Population Employed in Accommodation & Food Services in Texas is 7.2%.
What is the Percentage of Population Employed in Accommodation & Food Services in the United States?
Percentage of Population Employed in Accommodation & Food Services in the United States is 6.9%.