Zip Codes with the Highest Percentage of Population Employed in Accommodation & Food Services in Gilmer, TX
RELATED REPORTS & OPTIONS
Accommodation & Food Services
Gilmer
Compare Zip Codes
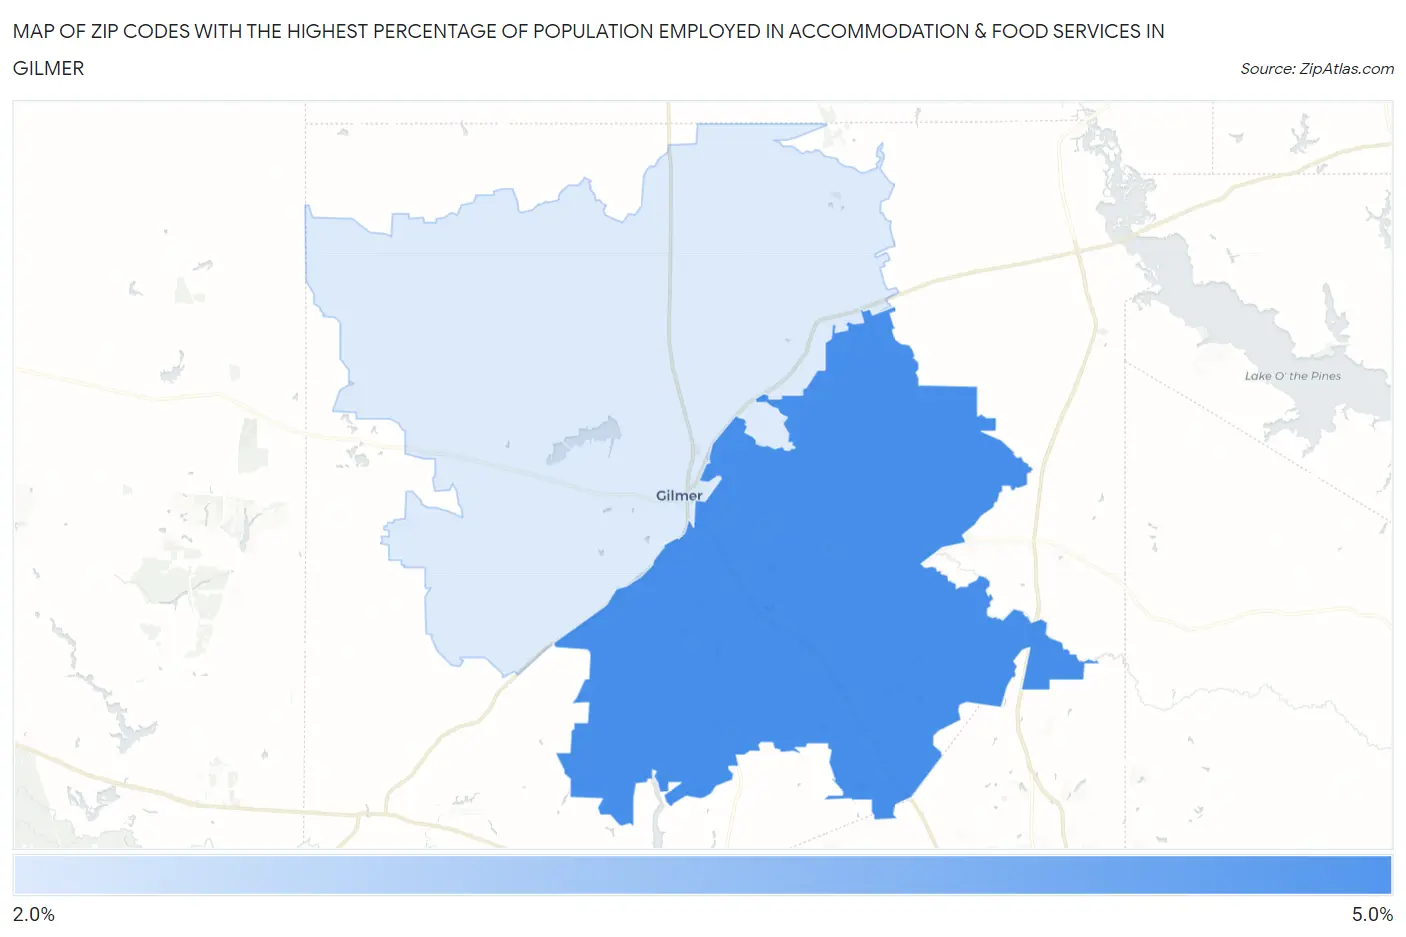
Map of Zip Codes with the Highest Percentage of Population Employed in Accommodation & Food Services in Gilmer
2.6%
4.5%
Zip Codes with the Highest Percentage of Population Employed in Accommodation & Food Services in Gilmer, TX
| Zip Code | % Employed | vs State | vs National | |
| 1. | 75645 | 4.5% | 7.2%(-2.69)#1,184 | 6.9%(-2.37)#18,447 |
| 2. | 75644 | 2.6% | 7.2%(-4.65)#1,477 | 6.9%(-4.32)#24,348 |
1
Common Questions
What are the Top Zip Codes with the Highest Percentage of Population Employed in Accommodation & Food Services in Gilmer, TX?
Top Zip Codes with the Highest Percentage of Population Employed in Accommodation & Food Services in Gilmer, TX are:
What zip code has the Highest Percentage of Population Employed in Accommodation & Food Services in Gilmer, TX?
75645 has the Highest Percentage of Population Employed in Accommodation & Food Services in Gilmer, TX with 4.5%.
What is the Percentage of Population Employed in Accommodation & Food Services in Gilmer, TX?
Percentage of Population Employed in Accommodation & Food Services in Gilmer is 3.1%.
What is the Percentage of Population Employed in Accommodation & Food Services in Texas?
Percentage of Population Employed in Accommodation & Food Services in Texas is 7.2%.
What is the Percentage of Population Employed in Accommodation & Food Services in the United States?
Percentage of Population Employed in Accommodation & Food Services in the United States is 6.9%.