Zip Codes with the Highest Percentage of Population Employed in Accommodation & Food Services in Tomball, TX
RELATED REPORTS & OPTIONS
Accommodation & Food Services
Tomball
Compare Zip Codes
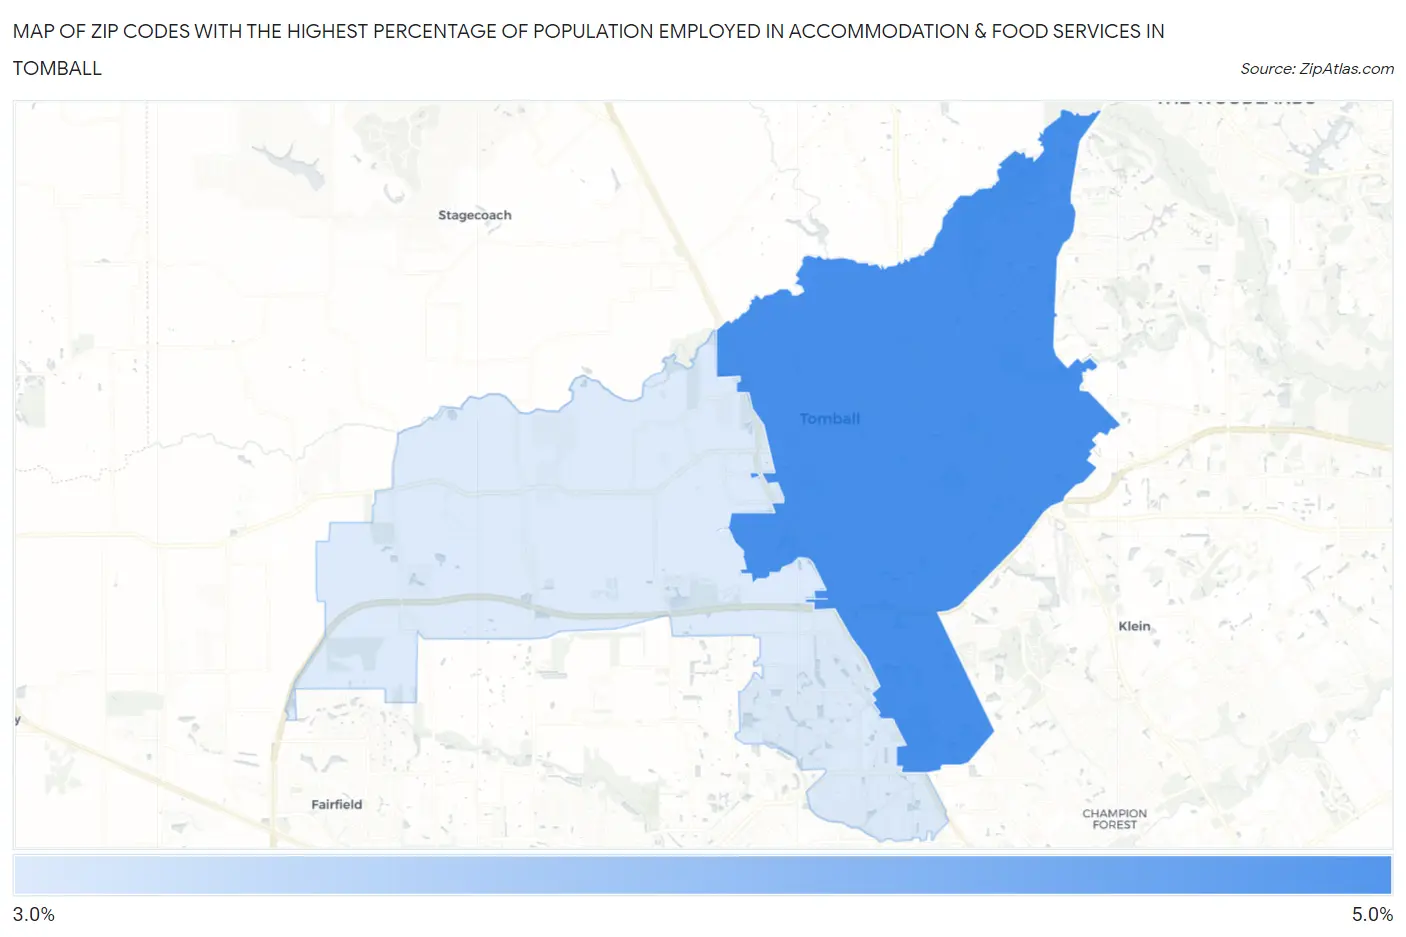
Map of Zip Codes with the Highest Percentage of Population Employed in Accommodation & Food Services in Tomball
3.6%
4.9%
Zip Codes with the Highest Percentage of Population Employed in Accommodation & Food Services in Tomball, TX
| Zip Code | % Employed | vs State | vs National | |
| 1. | 77375 | 4.9% | 7.2%(-2.30)#1,109 | 6.9%(-1.98)#17,151 |
| 2. | 77377 | 3.6% | 7.2%(-3.62)#1,340 | 6.9%(-3.30)#21,510 |
1
Common Questions
What are the Top Zip Codes with the Highest Percentage of Population Employed in Accommodation & Food Services in Tomball, TX?
Top Zip Codes with the Highest Percentage of Population Employed in Accommodation & Food Services in Tomball, TX are:
What zip code has the Highest Percentage of Population Employed in Accommodation & Food Services in Tomball, TX?
77375 has the Highest Percentage of Population Employed in Accommodation & Food Services in Tomball, TX with 4.9%.
What is the Percentage of Population Employed in Accommodation & Food Services in Tomball, TX?
Percentage of Population Employed in Accommodation & Food Services in Tomball is 4.7%.
What is the Percentage of Population Employed in Accommodation & Food Services in Texas?
Percentage of Population Employed in Accommodation & Food Services in Texas is 7.2%.
What is the Percentage of Population Employed in Accommodation & Food Services in the United States?
Percentage of Population Employed in Accommodation & Food Services in the United States is 6.9%.