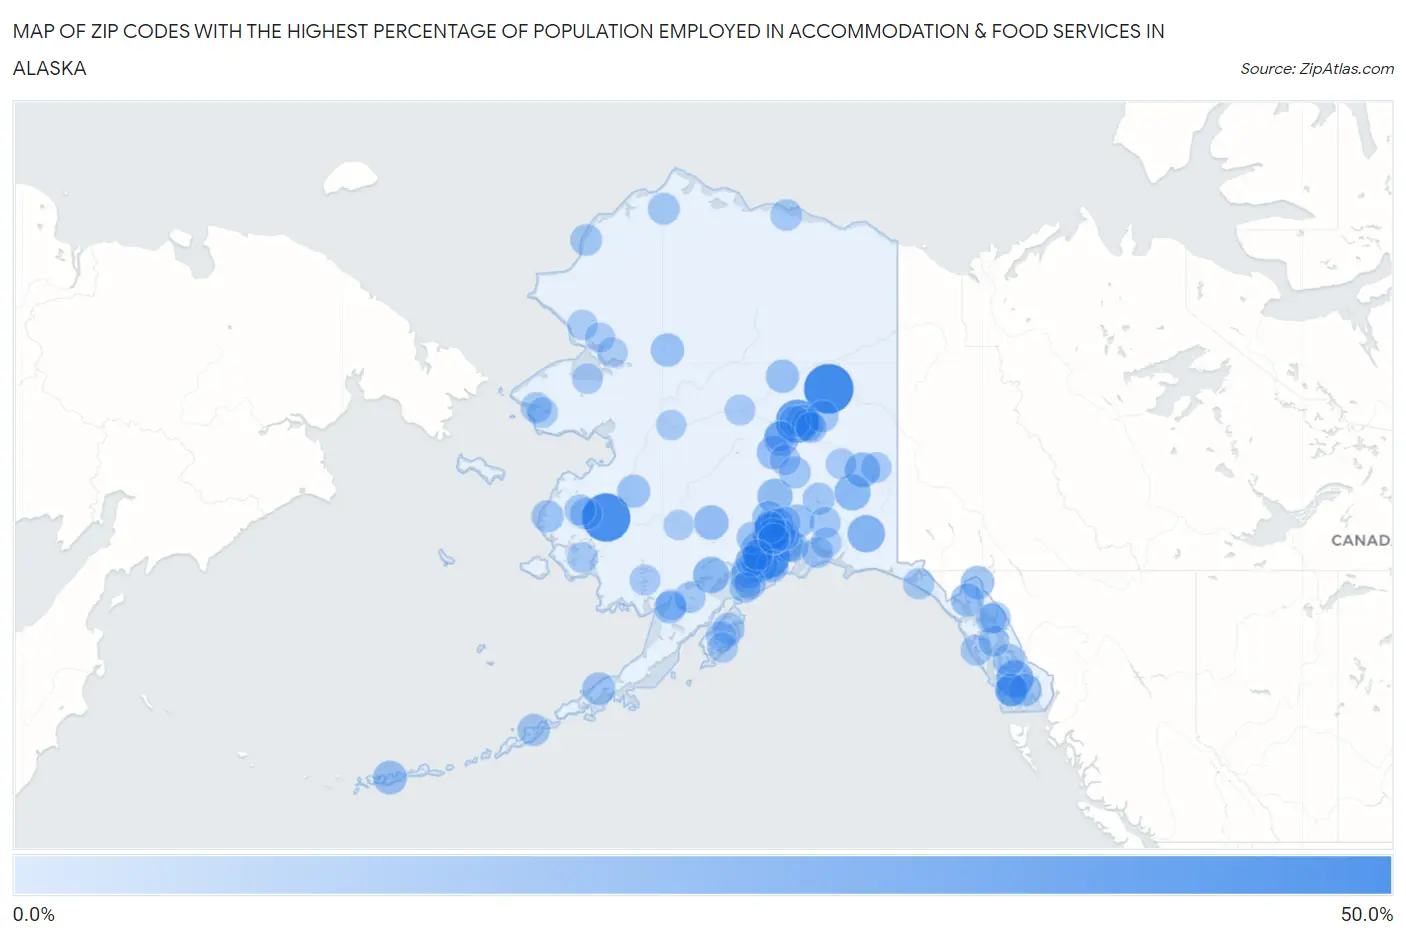
Zip Codes with the Highest Percentage of Population Employed in Accommodation & Food Services in Alaska
RELATED REPORTS & OPTIONS
Accommodation & Food Services
Alaska
Compare Zip Codes
Map of Zip Codes with the Highest Percentage of Population Employed in Accommodation & Food Services in Alaska
0.0%
50.0%
Zip Codes with the Highest Percentage of Population Employed in Accommodation & Food Services in Alaska
| Zip Code | % Employed | vs State | vs National | |
| 1. | 99730 | 47.2% | 6.8%(+40.4)#1 | 6.9%(+40.3)#113 |
| 2. | 99657 | 44.4% | 6.8%(+37.6)#2 | 6.9%(+37.6)#132 |
| 3. | 99572 | 36.0% | 6.8%(+29.1)#3 | 6.9%(+29.1)#211 |
| 4. | 99725 | 32.8% | 6.8%(+26.0)#4 | 6.9%(+25.9)#268 |
| 5. | 99506 | 20.8% | 6.8%(+14.0)#5 | 6.9%(+14.0)#758 |
| 6. | 99566 | 19.0% | 6.8%(+12.2)#6 | 6.9%(+12.2)#944 |
| 7. | 99918 | 18.8% | 6.8%(+11.9)#7 | 6.9%(+11.9)#978 |
| 8. | 99647 | 16.7% | 6.8%(+9.84)#8 | 6.9%(+9.79)#1,320 |
| 9. | 99586 | 16.3% | 6.8%(+9.44)#9 | 6.9%(+9.38)#1,400 |
| 10. | 99568 | 14.6% | 6.8%(+7.82)#10 | 6.9%(+7.76)#1,774 |
| 11. | 99776 | 14.3% | 6.8%(+7.46)#11 | 6.9%(+7.40)#1,880 |
| 12. | 99676 | 14.1% | 6.8%(+7.32)#12 | 6.9%(+7.26)#1,921 |
| 13. | 99587 | 13.1% | 6.8%(+6.27)#13 | 6.9%(+6.21)#2,310 |
| 14. | 99503 | 12.9% | 6.8%(+6.03)#14 | 6.9%(+5.97)#2,411 |
| 15. | 99744 | 12.8% | 6.8%(+5.94)#15 | 6.9%(+5.88)#2,450 |
| 16. | 99518 | 11.6% | 6.8%(+4.76)#16 | 6.9%(+4.71)#3,101 |
| 17. | 99501 | 11.5% | 6.8%(+4.63)#17 | 6.9%(+4.57)#3,191 |
| 18. | 99743 | 11.0% | 6.8%(+4.20)#18 | 6.9%(+4.15)#3,529 |
| 19. | 99546 | 10.9% | 6.8%(+4.06)#19 | 6.9%(+4.00)#3,653 |
| 20. | 99674 | 10.5% | 6.8%(+3.70)#20 | 6.9%(+3.65)#3,964 |
| 21. | 99773 | 10.1% | 6.8%(+3.30)#21 | 6.9%(+3.25)#4,382 |
| 22. | 99840 | 10.0% | 6.8%(+3.21)#22 | 6.9%(+3.16)#4,482 |
| 23. | 99701 | 9.9% | 6.8%(+3.06)#23 | 6.9%(+3.00)#4,681 |
| 24. | 99921 | 9.8% | 6.8%(+3.02)#24 | 6.9%(+2.97)#4,729 |
| 25. | 99827 | 9.8% | 6.8%(+3.02)#25 | 6.9%(+2.96)#4,731 |
| 26. | 99703 | 9.8% | 6.8%(+2.99)#26 | 6.9%(+2.93)#4,775 |
| 27. | 99639 | 9.7% | 6.8%(+2.83)#27 | 6.9%(+2.78)#4,980 |
| 28. | 99515 | 9.6% | 6.8%(+2.77)#28 | 6.9%(+2.72)#5,068 |
| 29. | 99688 | 9.6% | 6.8%(+2.74)#29 | 6.9%(+2.69)#5,121 |
| 30. | 99665 | 9.4% | 6.8%(+2.55)#30 | 6.9%(+2.49)#5,389 |
| 31. | 99611 | 9.2% | 6.8%(+2.42)#31 | 6.9%(+2.37)#5,586 |
| 32. | 99517 | 8.8% | 6.8%(+2.02)#32 | 6.9%(+1.96)#6,203 |
| 33. | 99571 | 8.8% | 6.8%(+1.96)#33 | 6.9%(+1.90)#6,311 |
| 34. | 99504 | 8.6% | 6.8%(+1.80)#34 | 6.9%(+1.74)#6,595 |
| 35. | 99556 | 8.6% | 6.8%(+1.80)#35 | 6.9%(+1.74)#6,597 |
| 36. | 99901 | 8.6% | 6.8%(+1.74)#36 | 6.9%(+1.69)#6,704 |
| 37. | 99508 | 8.3% | 6.8%(+1.50)#37 | 6.9%(+1.45)#7,157 |
| 38. | 99925 | 8.2% | 6.8%(+1.38)#38 | 6.9%(+1.32)#7,406 |
| 39. | 99705 | 8.0% | 6.8%(+1.16)#39 | 6.9%(+1.10)#7,857 |
| 40. | 99669 | 7.9% | 6.8%(+1.06)#40 | 6.9%(+1.00)#8,065 |
| 41. | 99502 | 7.9% | 6.8%(+1.03)#41 | 6.9%(+0.974)#8,138 |
| 42. | 99692 | 7.8% | 6.8%(+1.01)#42 | 6.9%(+0.955)#8,183 |
| 43. | 99833 | 7.8% | 6.8%(+0.960)#43 | 6.9%(+0.903)#8,301 |
| 44. | 99662 | 7.4% | 6.8%(+0.613)#44 | 6.9%(+0.557)#9,146 |
| 45. | 99670 | 7.1% | 6.8%(+0.318)#45 | 6.9%(+0.262)#9,952 |
| 46. | 99588 | 6.9% | 6.8%(+0.084)#46 | 6.9%(+0.027)#10,572 |
| 47. | 99550 | 6.8% | 6.8%(-0.045)#47 | 6.9%(-0.101)#10,955 |
| 48. | 99664 | 6.7% | 6.8%(-0.098)#48 | 6.9%(-0.154)#11,120 |
| 49. | 99712 | 6.7% | 6.8%(-0.155)#49 | 6.9%(-0.211)#11,282 |
| 50. | 99650 | 6.7% | 6.8%(-0.158)#50 | 6.9%(-0.214)#11,301 |
| 51. | 99694 | 6.6% | 6.8%(-0.203)#51 | 6.9%(-0.260)#11,446 |
| 52. | 99791 | 6.5% | 6.8%(-0.303)#52 | 6.9%(-0.359)#11,778 |
| 53. | 99759 | 6.5% | 6.8%(-0.373)#53 | 6.9%(-0.429)#12,000 |
| 54. | 99682 | 6.2% | 6.8%(-0.575)#54 | 6.9%(-0.631)#12,640 |
| 55. | 99729 | 6.2% | 6.8%(-0.575)#55 | 6.9%(-0.631)#12,645 |
| 56. | 99693 | 6.1% | 6.8%(-0.747)#56 | 6.9%(-0.804)#13,218 |
| 57. | 99734 | 6.0% | 6.8%(-0.784)#57 | 6.9%(-0.840)#13,327 |
| 58. | 99603 | 6.0% | 6.8%(-0.801)#58 | 6.9%(-0.858)#13,376 |
| 59. | 99507 | 5.9% | 6.8%(-0.891)#59 | 6.9%(-0.947)#13,662 |
| 60. | 99654 | 5.9% | 6.8%(-0.895)#60 | 6.9%(-0.951)#13,676 |
| 61. | 99709 | 5.9% | 6.8%(-0.912)#61 | 6.9%(-0.968)#13,736 |
| 62. | 99567 | 5.9% | 6.8%(-0.941)#62 | 6.9%(-0.997)#13,817 |
| 63. | 99652 | 5.8% | 6.8%(-1.01)#63 | 6.9%(-1.07)#14,041 |
| 64. | 99645 | 5.4% | 6.8%(-1.40)#64 | 6.9%(-1.45)#15,300 |
| 65. | 99573 | 5.4% | 6.8%(-1.43)#65 | 6.9%(-1.48)#15,422 |
| 66. | 99613 | 5.4% | 6.8%(-1.45)#66 | 6.9%(-1.51)#15,503 |
| 67. | 99577 | 5.4% | 6.8%(-1.47)#67 | 6.9%(-1.53)#15,572 |
| 68. | 99689 | 5.3% | 6.8%(-1.55)#68 | 6.9%(-1.60)#15,846 |
| 69. | 99835 | 5.3% | 6.8%(-1.56)#69 | 6.9%(-1.62)#15,885 |
| 70. | 99505 | 5.3% | 6.8%(-1.57)#70 | 6.9%(-1.63)#15,939 |
| 71. | 99610 | 5.2% | 6.8%(-1.59)#71 | 6.9%(-1.64)#15,973 |
| 72. | 99801 | 5.2% | 6.8%(-1.62)#72 | 6.9%(-1.68)#16,115 |
| 73. | 99702 | 5.2% | 6.8%(-1.65)#73 | 6.9%(-1.70)#16,175 |
| 74. | 99623 | 5.1% | 6.8%(-1.69)#74 | 6.9%(-1.75)#16,344 |
| 75. | 99658 | 4.9% | 6.8%(-1.92)#75 | 6.9%(-1.97)#17,136 |
| 76. | 99574 | 4.7% | 6.8%(-2.09)#76 | 6.9%(-2.15)#17,712 |
| 77. | 99559 | 4.7% | 6.8%(-2.16)#77 | 6.9%(-2.22)#17,948 |
| 78. | 99778 | 4.7% | 6.8%(-2.17)#78 | 6.9%(-2.23)#17,987 |
| 79. | 99633 | 4.5% | 6.8%(-2.30)#79 | 6.9%(-2.36)#18,423 |
| 80. | 99820 | 4.5% | 6.8%(-2.35)#80 | 6.9%(-2.40)#18,587 |
| 81. | 99516 | 4.5% | 6.8%(-2.36)#81 | 6.9%(-2.42)#18,636 |
| 82. | 99760 | 4.4% | 6.8%(-2.41)#82 | 6.9%(-2.46)#18,762 |
| 83. | 99777 | 4.3% | 6.8%(-2.52)#83 | 6.9%(-2.58)#19,179 |
| 84. | 99755 | 4.3% | 6.8%(-2.53)#84 | 6.9%(-2.59)#19,218 |
| 85. | 99737 | 4.3% | 6.8%(-2.55)#85 | 6.9%(-2.61)#19,285 |
| 86. | 99576 | 4.2% | 6.8%(-2.58)#86 | 6.9%(-2.64)#19,378 |
| 87. | 99672 | 4.2% | 6.8%(-2.62)#87 | 6.9%(-2.67)#19,475 |
| 88. | 99762 | 4.1% | 6.8%(-2.71)#88 | 6.9%(-2.76)#19,751 |
| 89. | 99780 | 4.1% | 6.8%(-2.72)#89 | 6.9%(-2.77)#19,784 |
| 90. | 99663 | 4.0% | 6.8%(-2.78)#90 | 6.9%(-2.83)#20,000 |
| 91. | 99615 | 3.9% | 6.8%(-2.93)#91 | 6.9%(-2.98)#20,484 |
| 92. | 99824 | 3.9% | 6.8%(-2.97)#92 | 6.9%(-3.02)#20,610 |
| 93. | 99686 | 3.9% | 6.8%(-2.97)#93 | 6.9%(-3.03)#20,618 |
| 94. | 99736 | 3.8% | 6.8%(-3.05)#94 | 6.9%(-3.11)#20,873 |
| 95. | 99643 | 3.6% | 6.8%(-3.25)#95 | 6.9%(-3.31)#21,561 |
| 96. | 99557 | 3.3% | 6.8%(-3.53)#96 | 6.9%(-3.58)#22,411 |
| 97. | 99741 | 3.3% | 6.8%(-3.55)#97 | 6.9%(-3.61)#22,469 |
| 98. | 99763 | 3.2% | 6.8%(-3.65)#98 | 6.9%(-3.71)#22,774 |
| 99. | 99761 | 3.1% | 6.8%(-3.68)#99 | 6.9%(-3.73)#22,838 |
| 100. | 99752 | 3.1% | 6.8%(-3.70)#100 | 6.9%(-3.76)#22,885 |
Common Questions
What are the Top 10 Zip Codes with the Highest Percentage of Population Employed in Accommodation & Food Services in Alaska?
Top 10 Zip Codes with the Highest Percentage of Population Employed in Accommodation & Food Services in Alaska are:
What zip code has the Highest Percentage of Population Employed in Accommodation & Food Services in Alaska?
99730 has the Highest Percentage of Population Employed in Accommodation & Food Services in Alaska with 47.2%.
What is the Percentage of Population Employed in Accommodation & Food Services in the State of Alaska?
Percentage of Population Employed in Accommodation & Food Services in Alaska is 6.8%.
What is the Percentage of Population Employed in Accommodation & Food Services in the United States?
Percentage of Population Employed in Accommodation & Food Services in the United States is 6.9%.