Zip Codes with the Highest Percentage of Population Employed in Accommodation & Food Services in Longview, TX
RELATED REPORTS & OPTIONS
Accommodation & Food Services
Longview
Compare Zip Codes
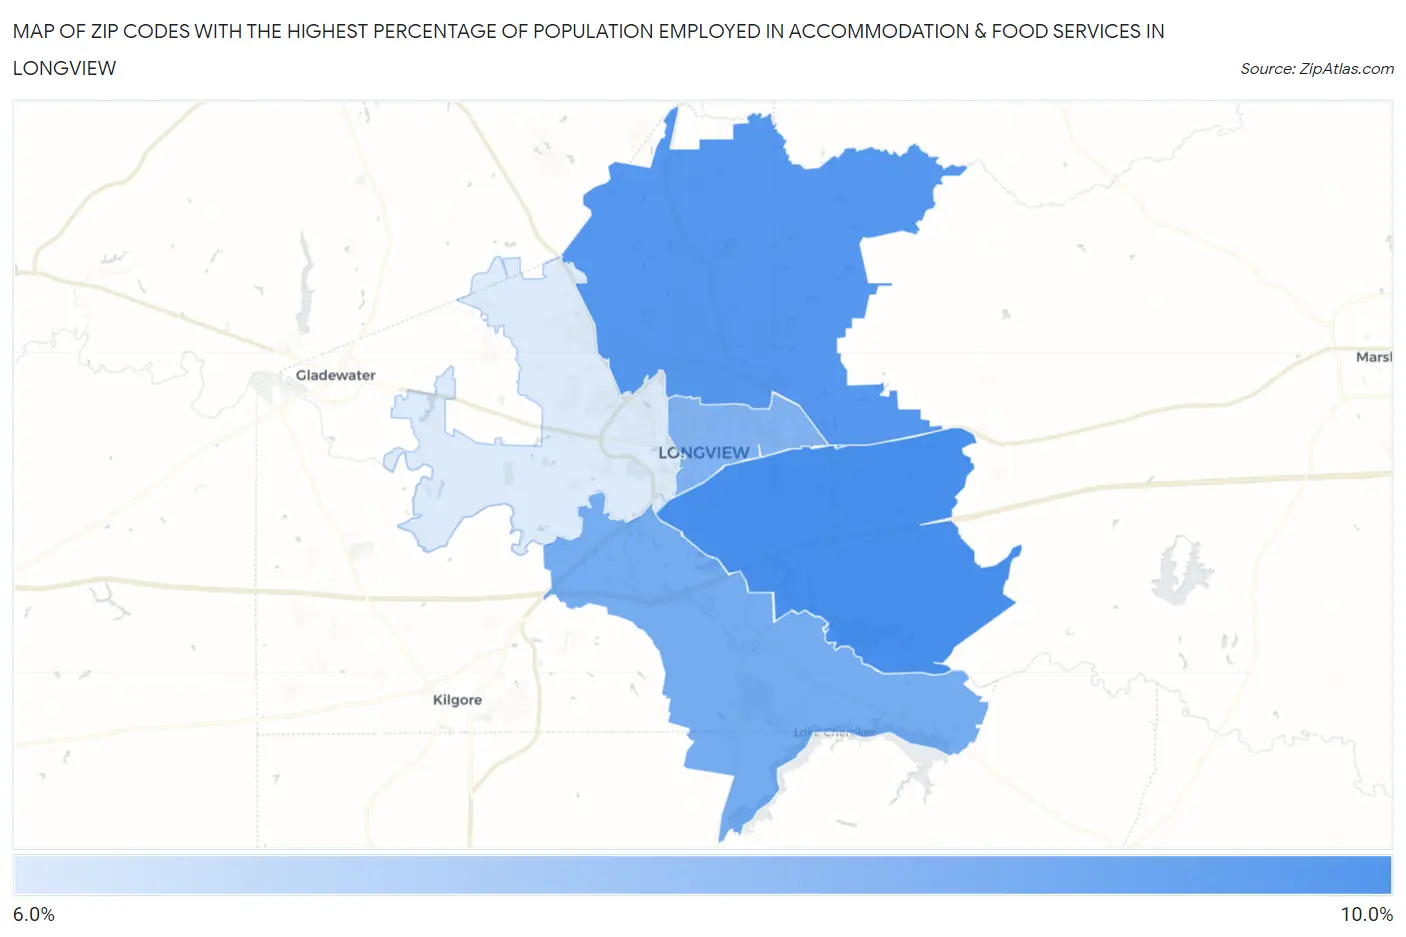
Map of Zip Codes with the Highest Percentage of Population Employed in Accommodation & Food Services in Longview
6.2%
9.4%
Zip Codes with the Highest Percentage of Population Employed in Accommodation & Food Services in Longview, TX
| Zip Code | % Employed | vs State | vs National | |
| 1. | 75602 | 9.4% | 7.2%(+2.23)#343 | 6.9%(+2.55)#5,300 |
| 2. | 75605 | 9.1% | 7.2%(+1.90)#385 | 6.9%(+2.23)#5,793 |
| 3. | 75603 | 8.4% | 7.2%(+1.22)#485 | 6.9%(+1.55)#6,945 |
| 4. | 75601 | 8.2% | 7.2%(+0.982)#520 | 6.9%(+1.31)#7,434 |
| 5. | 75604 | 6.2% | 7.2%(-1.04)#886 | 6.9%(-0.715)#12,906 |
1
Common Questions
What are the Top 3 Zip Codes with the Highest Percentage of Population Employed in Accommodation & Food Services in Longview, TX?
Top 3 Zip Codes with the Highest Percentage of Population Employed in Accommodation & Food Services in Longview, TX are:
What zip code has the Highest Percentage of Population Employed in Accommodation & Food Services in Longview, TX?
75602 has the Highest Percentage of Population Employed in Accommodation & Food Services in Longview, TX with 9.4%.
What is the Percentage of Population Employed in Accommodation & Food Services in Longview, TX?
Percentage of Population Employed in Accommodation & Food Services in Longview is 9.1%.
What is the Percentage of Population Employed in Accommodation & Food Services in Texas?
Percentage of Population Employed in Accommodation & Food Services in Texas is 7.2%.
What is the Percentage of Population Employed in Accommodation & Food Services in the United States?
Percentage of Population Employed in Accommodation & Food Services in the United States is 6.9%.