Zip Codes with the Highest Percentage of Population Employed in Accommodation & Food Services in Paris, TX
RELATED REPORTS & OPTIONS
Accommodation & Food Services
Paris
Compare Zip Codes
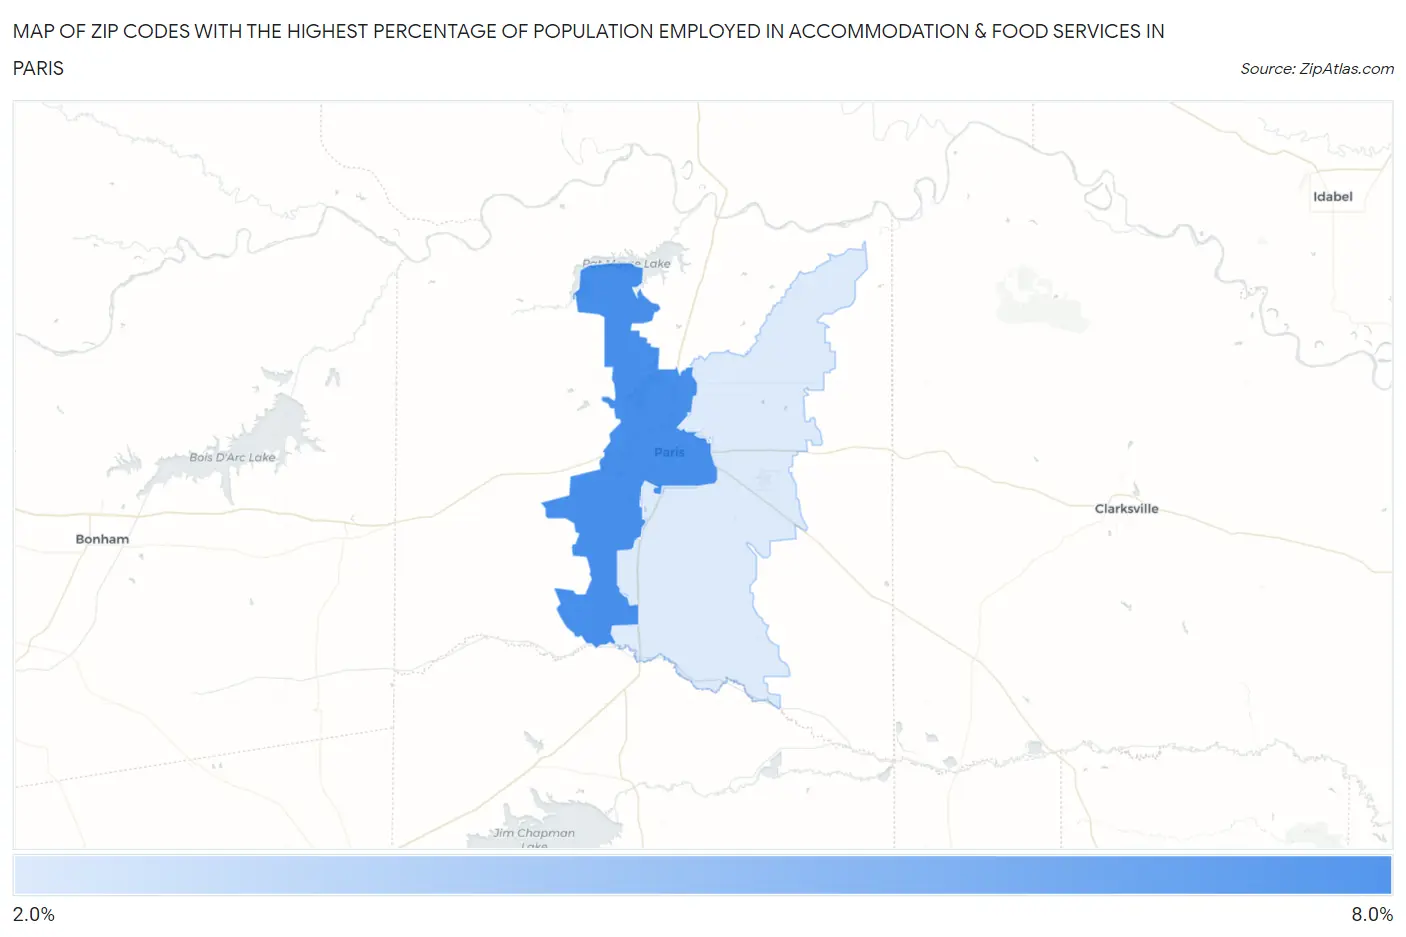
Map of Zip Codes with the Highest Percentage of Population Employed in Accommodation & Food Services in Paris
2.7%
6.7%
Zip Codes with the Highest Percentage of Population Employed in Accommodation & Food Services in Paris, TX
| Zip Code | % Employed | vs State | vs National | |
| 1. | 75460 | 6.7% | 7.2%(-0.541)#785 | 6.9%(-0.217)#11,317 |
| 2. | 75462 | 2.7% | 7.2%(-4.53)#1,467 | 6.9%(-4.21)#24,065 |
1
Common Questions
What are the Top Zip Codes with the Highest Percentage of Population Employed in Accommodation & Food Services in Paris, TX?
Top Zip Codes with the Highest Percentage of Population Employed in Accommodation & Food Services in Paris, TX are:
What zip code has the Highest Percentage of Population Employed in Accommodation & Food Services in Paris, TX?
75460 has the Highest Percentage of Population Employed in Accommodation & Food Services in Paris, TX with 6.7%.
What is the Percentage of Population Employed in Accommodation & Food Services in Paris, TX?
Percentage of Population Employed in Accommodation & Food Services in Paris is 6.7%.
What is the Percentage of Population Employed in Accommodation & Food Services in Texas?
Percentage of Population Employed in Accommodation & Food Services in Texas is 7.2%.
What is the Percentage of Population Employed in Accommodation & Food Services in the United States?
Percentage of Population Employed in Accommodation & Food Services in the United States is 6.9%.